Forest Canopy Density Monitoring by Using Geospatial Techniques: A Study of Gadchiroli District, Maharashtra, India
Ravindra S. Medhe
 and Yogesh P. Badhe
*
and Yogesh P. Badhe
*
1
Department of Geography,
Savitribai Phule Pune University,
Pune,
Maharashtra
India
http://dx.doi.org/10.12944/CWE.18.3.31
Copy the following to cite this article:
Medhe R. S, Badhe Y. P. Forest Canopy Density Monitoring by Using Geospatial Techniques: A Study of Gadchiroli District, Maharashtra, India. Curr World Environ 2023;18(3). DOI:http://dx.doi.org/10.12944/CWE.18.3.31
Copy the following to cite this URL:
Medhe R. S, Badhe Y. P. Forest Canopy Density Monitoring by Using Geospatial Techniques: A Study of Gadchiroli District, Maharashtra, India. Curr World Environ 2023;18(3).
Download article (pdf) Citation Manager Publish History

Introduction
Forests in India and globally are under constant threat due to deforestation, urbanisation, and climate change. Monitoring forest canopy density offers critical information for managing, conserving, and comprehending how these threats affect forests. Gadchiroli District in Maharashtra, India, is renowned for its dense forest cover and diverse wildlife. But over time, there have been experienced significant land-use land-cover changes over the years.
Forests are crucial for the environment and economic growth. Roughly one-third of the world's population uses forest resources directly or indirectly for residential, industrial, recreational, and medicinal purposes. In nature, the primitive humans lived in harmony. Nonetheless, the deterioration began with the development of contemporary industrial civilisation. Forest cover also shows a location's viability and reveals the natural health requirements of a site. Researchers must understand how human action affects the Spatio-temporal changes in forest cover area. Although vegetation density and forest canopy cover may establish a balanced situation in an ecosystem or the ecosphere, forests are being harmed on a large scale daily as a result of some illegal anthropogenic activities.1
The preservation of biodiversity and the management of tropical forests have gained importance in developing nations in recent years. The Earth’s Forest cover has been consistently impacted over the past three decades by several climatological and anthropogenic factors, including tropical deforestation, rangeland transformation, improved productivity in farming, high-growing urbanisation, and population expansion. 2 Although the destruction of tropical forests was considerably less in the first decade of this century, there were still 13 million hectares lost yearly on average. For studying the configuration of the landscape and how it changes over time, geospatial techniques provide a well-established, affordable, and accurate option. Due to its extensive geographical and temporal coverage at frequent intervals, satellite data is instrumental in identifying forest changes. Image interpretation and analysis are now possible on an even greater scale than in earlier times because of recent improvements in the quality and accessibility of satellite imagery.3
Changes in forest cover have an impact on the catchment processes by affecting a variety of hydrological variables, including streamflow, sediment yield, runoff coefficient, and evapotranspiration, as well as biochemical cycles, biodiversity at a global, regional, and local scale; and increasing the likelihood that floods and other catastrophic events will occur. Consequently, inventorying and monitoring the forest cover are essential challenges to managing natural resources within the current environmental change research. Forest canopy changes can occur randomly or according to established patterns. Although these are essentially natural processes, the possibility of human intervention cannot be excluded.
Humans are mainly interested in forest resources for social values, economic security, and cultural and social identity.4 To effectively manage forest resources, changes that have taken place have to be carefully studied, from which probable future changes can be deduced. Detecting changes in the environment, in general, is a challenging task since the changes take place at varying temporal and spatialscales, with the two exhibiting interrelationships and interdependence.
In the 1970s, several satellites were commissioned to capture Earth's surface data from space. These vary in resolutions (temporal, spatial, radiometric and geometric) and applications. Newer satellites have always been more advanced than their predecessors, particularly in geometric resolution. RS GIS has been used to store, process and disseminate remotely sensed data for some applications. GIS also integrates statistical and mathematical packages to simulate, interpolate, extrapolate and predict scenarios and is extensively used in vegetation studies, including forest management. Forest management studies can be done from different perspectives, such as change analysis, yield analysis and ecosystem service value, five mapping forest types, forest succession, assessment of stand structure, evaluation of forest damage, estimate of physiological parameters and forest productivity. 5
The spatial forest health of any region may be determined due to advanced techniques in science and technology, as well as RS and GIS approaches. The 1986 forest policy stipulates that each Indian state shall build an RS-GIS techniques chamber in order to monitor the extent of land degradation.6 The vegetative property and phenology are identified Using multitemporal, multispectral, and hyperspectral imagery.7 Using information from wild-field sensors, the Normalised Difference Vegetation Index (NDVI) distinguishes between different types of vegetation and measures the quantity and vigour of vegetation.8 Several sensors, including TM, ETM, and LISS, have been employed in the global Forest Canopy Density (FCD) investigation as well as in the case of multiple NDVI.9 In the recent decade, it has been possible to limit the forest depletion rate through forestland and scientific management approaches.10 Anthropogenic factors including habitat loss, human encroachment for buildings and industry, and expansion of agricultural land cause a thick forest to become isolated. These vulnerable forest hotspots can be identified using high-resolution satellite images.11
The forests have been degraded in recent years due to the industrial and agricultural revolutions. Correct experimental land cover development is critical for forest resource conservation. Changes in density should be considered for improved reforestation. Forest canopy density is most significant considerations when designing and implementing restoration programs. The forest's density and canopy may change, but the area remains.12 The spatiotemporal shifting prototype FCD model has been observed in various developing nations today.13 Rikimaru was initially used to study forest health and deforestation using TM data; however, it is now widely utilised. It is also commonly used in tropical forest regions to detect forestland depletion and reforesting amounts within the core forest and buffer areas.13
In 2002, the CLEAR created a GIS-based forest fragmentation analysis technique and updated in 2009 and it has the potential to play a significant role in forest resources management and the long-term maintenance of forest ecosystems.14,15,16 Researchers are attempting to measure the forest cover condition and forest canopy in the study region, as well as develop a relationship between topographic characteristics and forest cover status.17 This study aims to examine the changes in forest canopy density over 30 years, specifically from 1989 to 2019, in the Gadchiroli District of Maharashtra. The research work utilized the use of both remote sensing indices and geospatial approaches.
Study Area
The Gadchiroli district is between latitudes 18.44 and 21.51 North and 79.46 and 80.53 East longitude. It is located on Maharashtra's northeastern border, and shares state boundaries with Telangana and Chhattisgarh. It has a boundary with the districts of Bhandara and Gondia in the north, Chandrapur in the west, Rajnandgaon and Bastar in Chhattisgarh to the east and Karimnagar, Bhopalpalli, and Adilabad in Telangana to the south. Gadchiroli is situated at around 667 meters AMSL. The rivers in the Gadchiroli district are Godavari, Pranhita, Wainganga, Gadhavi, Khobragadhi, Sati, Kathani, and Pohar, supplies a sufficient quantity of river sand and water. The district's total area is 14,412 sq. km. covering 4.68% of Maharashtra State's total area, as given in Figure 1.
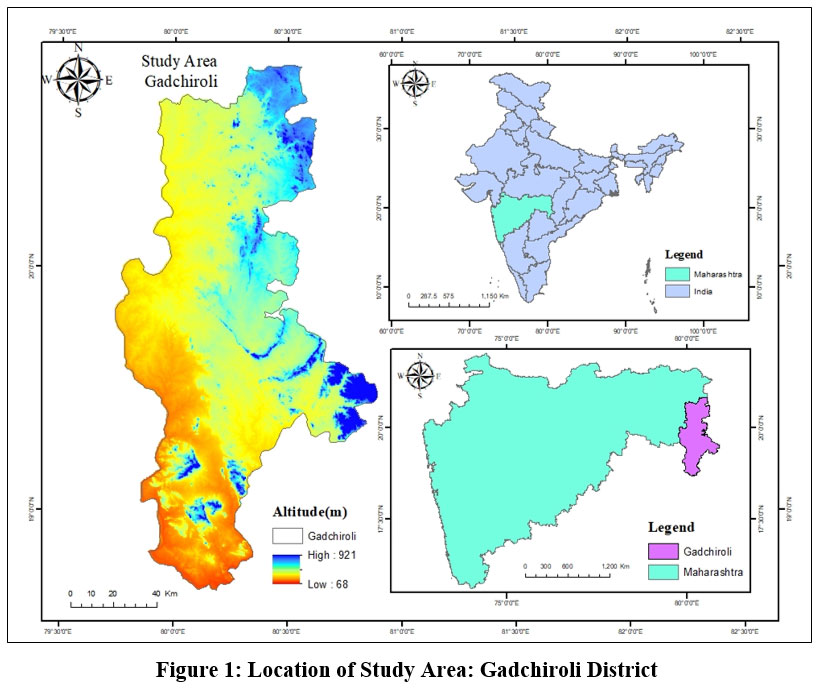 | Figure 1: Location of Study Area: Gadchiroli District.
|
Materials and Method
The Gadchiroli district of Maharashtra is selected for the forest canopy density monitoring. The satellite imagery is obtained from Landsat 5 imagery of January 1989 and Landsat 8 Operational Land Imager (OLI) scenes in February 2019 from USGS Earth Explorer with 30-meter spatial resolution of satellite images. These were regarded as the best times because the scenes were cloud-free. The ERDAS IMAGINE 2014 has been used for Image analysis and recording, and for creating the maps of indices, Arc GIS 10.3 has been used. The flowchart in Figure 2 illustrates how the equations were used to calculate the NDVI, AVI, BSI, SI, TI, and FCD indices.
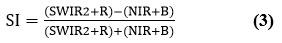
Normalised Differential Vegetation Index
The NDVI is prominent and frequently used vegetation indexes for measuring global and regional vegetation cover changes.18 According to Richardson and Everitt (1992),19 By dividing the variance between the red and near-infrared by the sum of the two bands, the NDVI is calculated (Equation 1). The classification of high and low vegetation areas is frequently done using NDVI. It is not appropriate to draw attention to minute variations in canopy density.
Advanced vegetation index (AVI)
on the Basis of red and NIR spectral band, one of the key factors to identify healthy vegetation is AVI and it is similar to NDVI. This investigation selected AVI using the infrared response's power intensity. Equation (2) is used to calculate this index.

Bare Soil Index (BI)
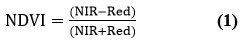
BI is used to classify agricultural and non-agricultural vegetation for a specific area. It is computed using the shortwave infrared band, which increases the land's bare soil property, and the red and NIR bands, which add the vegetation property to the index.20 According to BI, vegetation and forest cover are valued less highly than bare land. We can evaluate the exposed soil conditions by integrating the bare soil state and vegetation properties. Equation 3 is used to calculate it mathematically.
Shadow Index (SI)
To determine the three-dimensional structures of the forest, Using the low radiance of visible bands, SI is calculated. Depending on how the forest's trees are arranged, younger plants emit less light than adult trees.21 Because it is dependent on the arrangement of trees and canopy cover, SI gives the forest canopy a higher value and areas of bare soil and grasslands a lower value. Equation 4 is used to define the shadow index using the visible bands.

The thermal index
Landsat 8 OLI images were used to generate the thermal index using the spectral radiance technique.
Forest Canopy Density
By allocating weights to the calculated biophysical factors—AVI, BI, and SI for the FCD calculation examined the conditions of the forest cover and track changes that occur in the forest during forestry activities, which may involve degradation or rehabilitation. FCD is one of the key parameters for these analyses. Equation 5 is used to compute FCD for the study region.

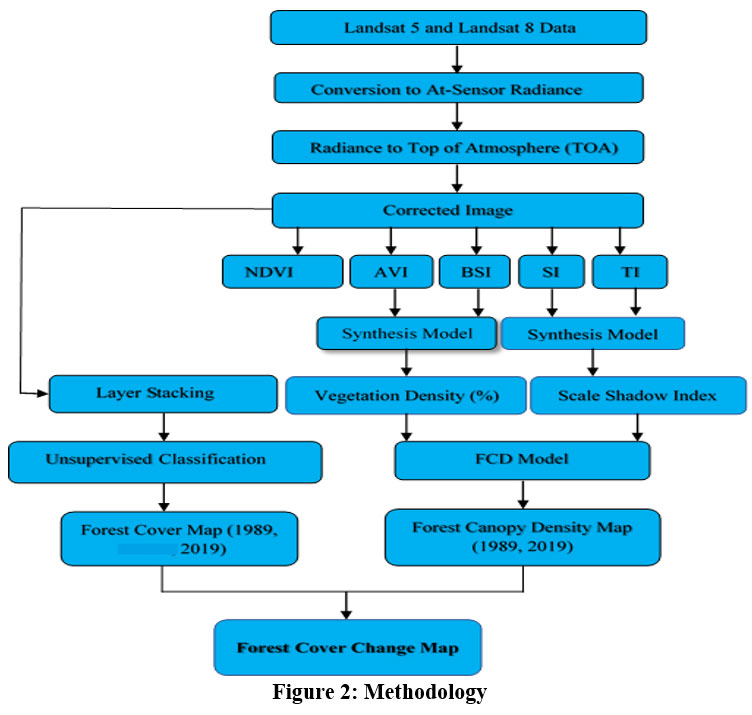 | Figure 2: Methodology
|
Results and Discussion
Normalized Difference Vegetation Index
The NDVI indicates health of the vegetation. It has been shown that the NDVI value in Maharashtra's Gadchiroli district ranges from -0.9 to 0.8. The NDVI range has been further divided into five categories. There is a threshold value for each class. The NDVI value for the highly dense forest class is between 0.413 and higher. Inside the dense forest, high-NDVI values were observed and dominated, as shown in Figure 3. These dense forest enclaves have been discovered in the hilly regions of Gadchiroli District's Bhamragad, Etapalli, Dhanora, and Korchi tehsils (the eastern border of Maharashtra). The study area's moderate NDVI value is concentrated in the upper and middle sections. Values below 0.165 NDVI are mostly confined to Gadchiroli's less vegetated parts while dominating areas exhibit barren land and water bodies. According to Google Earth, scrubs and agricultural land are typically found in the medium and low NDVI values.
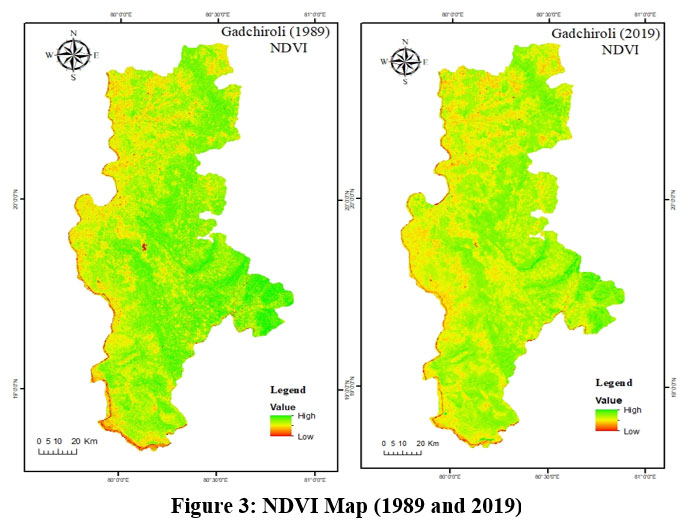 | Figure 3: NDVI Map (1989 and 2019).
|
Advanced Vegetation Index (AVI)
Green vegetation (healthy vegetation) is characterised by absorption and wavelength reflection in the RS spectral response. Due to pigment absorption, the visible portions have low reflectance, whereas the IR zone has high reflectance governed by the leaf's cell structure. Healthy vegetation absorbs the red band of wavelength and reflects it more in the infrared band. We investigate healthy vegetation using this advantage and the scientific ratio index (NDVI) technique. The enhanced Vegetation Index is another prominent vegetation index (AVI shown in Figure 4.
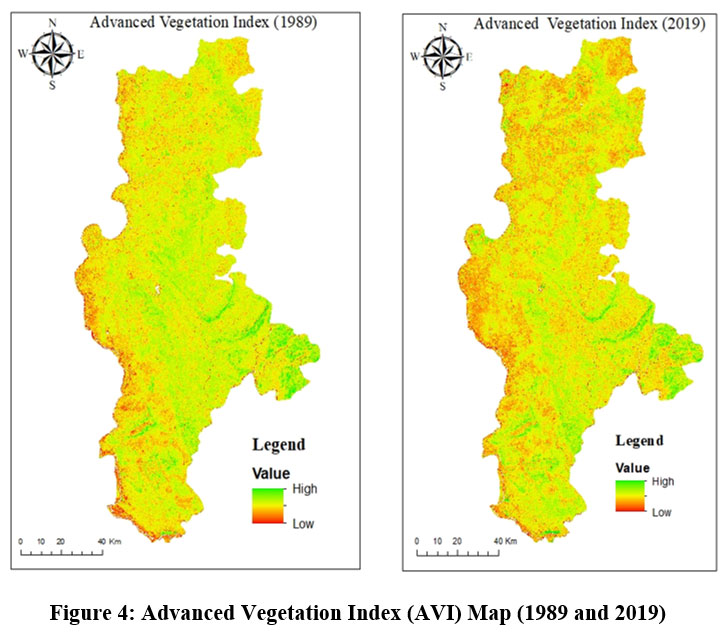 | Figure 4: Advanced Vegetation Index (AVI) Map (1989 and 2019).
|
The AVI value for a specific pixel span from -1 to +1; nevertheless, no green leaves have a value close to zero. Negative values primarily represent water and other non-vegetated surfaces, while zero signifies no vegetation. Values close to plus 1 (0.8 to 0.9) show the highest potential density of green leaves, whereas negative values primarily represent water and other non-vegetated surfaces.
Bareness Index (BSI)
A spectral reflectance index is abbreviated as BI. Soil bareness ratings range from -0.54 to 0.31. Each of the five classes in the district has a unique threshold value that separates it from the others. The river channel and exposed land in Maharashtra's Gadchiroli District show a high bareness value (-0.13 to +0.31) in the district's centre and western areas. Low to shallow BI values (0.54 to 0.19) are found in agricultural land and forest regions, concentrated on the district's eastern side and covered by tropical deciduous forests. The remaining areas are classified as middle BI value groups, as shown in Figure 5.
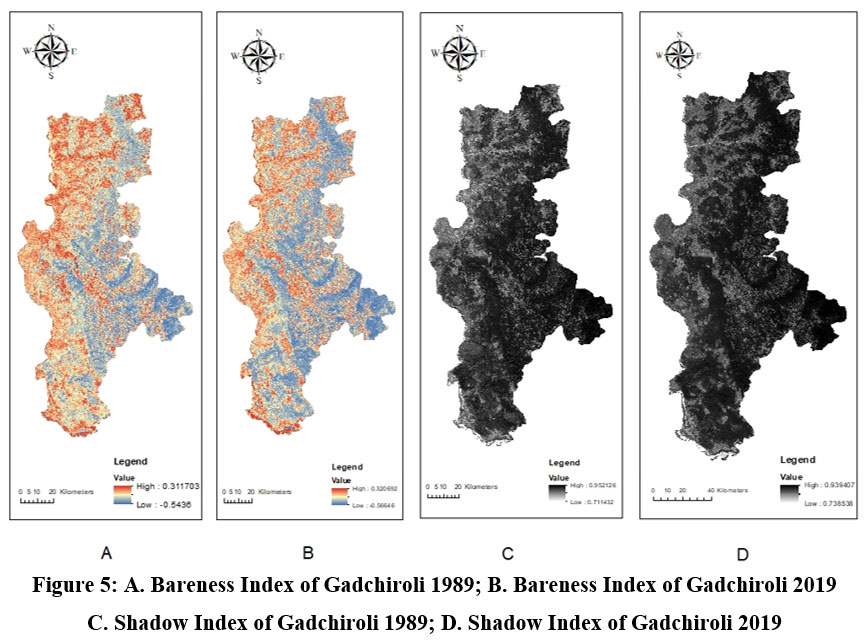 | Figure 5: A. Bareness Index of Gadchiroli 1989; B. Bareness Index of Gadchiroli 2019.
|
Shadow Index of Gadchiroli 1989; D. Shadow Index of Gadchiroli 2019
Shadow Index (SI)
Compared to young forest regions, mature forests have a greater SI value. There is a threshold value for each class. Due to the dominance of tropical deciduous forests, high and extremely high SI values are confined to the eastern half of the district (Maharashtra – Chhattisgarh border region hills). Due to their low and meagre SI values, river networks, aquatic bodies, and exposed land areas have all been prohibited. The remainder falls into the medium SI value category shown in Figure 5.
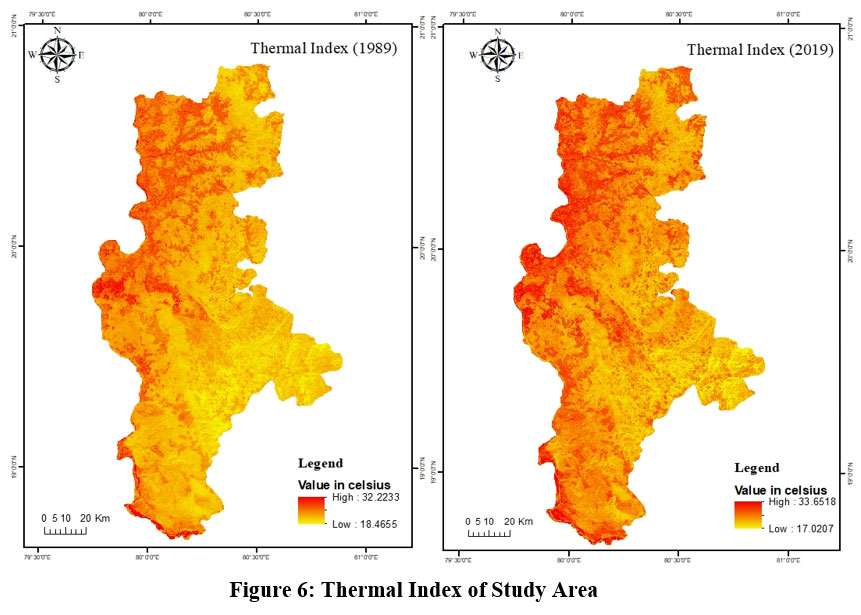
Thermal Index (TI)
The Thermal Index (TI) is calculated using two variables influencing the forest's chilly relative condition. The forest canopy's initial shielding impact is its absorption and block of solar radiation and the leaf's surface area, which minimises heating.16 Data on temperature was then utilised to distinguish between soil and a non-tree shadow, as shown in Figure 6.
 | Figure 6: Thermal Index of Study Area.
|
Forest Canopy Density Model
The FCD Model of Maharashtra's Gadchiroli District was created by combining five indicators, including the NDVI, AVI, BI, and SI and the Thermal Index. FCD is one of the metrics used to assess the quality of the forest. They are combining VD and SSI results in a change in the value of the forest canopy density. VD and SSI determine FCD on a scale from ‘0’ to 100, as shown in Figure 7.
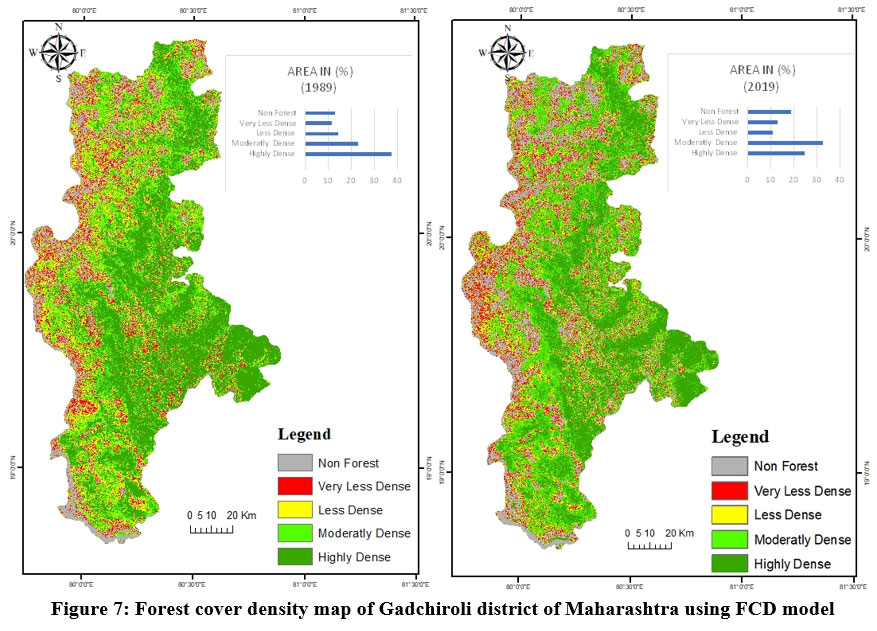 | Figure 7: Forest cover density map of Gadchiroli district of Maharashtra using FCD model.
|
The five classes were evaluated using FCD values ranging from zero to one hundred percent. Due to optimum climatic in the study area, the district's eastern hilly ranges and lower eastern main side have considerable forest cover. The western half of the Gadchiroli District comprises an undulating plateau with a dispersed open forest and a medium to low canopy density. The Gadchiroli District's regions are non-forest scrub, open forest, medium canopy density, and high canopy density forests, with respective percentages of 19.7%, 12.9%, 10.8%, 32.6%, and 24.57%. Tropical deciduous forest, which includes Sal, Palash, bamboo, and teak trees, usually surrounds high canopy density places. Agricultural fields and bare landscapes have moderate to low FCD values. The FCD approach for assessing the amount of forest canopy and the health of the forest is very appropriate and scientific.
Kappa Coefficient = 0.80, Overall Accuracy = 89.3 %
Most of the forest in the research region had a canopy closure of 100% > 70%. The 100 % > 70 % density class, during both the study period and the comprehensive evaluation of forest canopy density, has decreased noticeable changes in forest canopy density A, which fell from 37 percent in 1989 to 26.50 percent in 2019.
The study further indicates that the 40 % to 70% density area has increased from 23.2% in 1989 to 30.6 % in 2019, registering 7.04 %. However, the forest canopy density in the 40% to 10% density class decreased from 14.23% in 1989 to 10.8% in 2019.
Classification
The unsupervised classification results show that the classification was accurate. The Overall type for all the images was above the minimum acceptable threshold of 85 % and 93.00% for 1989 and 2019. For 1989 and 2019, the Kappa coefficients were 0.80 and 0.90, respectively. These show a good agreement between original imagery and classified images. Although these are acceptable values, they could have been improved by collecting field reference data.
Evaluation of Forest Cover Change from 1989 to 2019
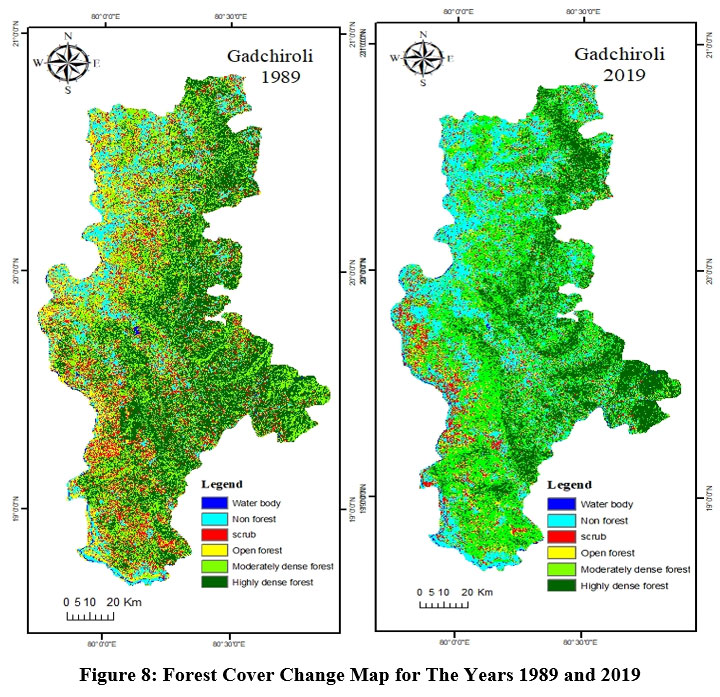
From the worldwide perspective, societal advancement affects the environment, and forest regions and forests are collapsing because of the implementation of some infrastructural developmental as building and complex construction, railway construction, highway construction, and cropland increase.17,18 Rapid population expansion and rising anthropogenic activities, particularly in tropical and developing nations, are posing a threat to a forest region by significantly altering land use.19 Gadchiroli district had roughly 10,887.66 sq. km of forest cover in 1989, accounting for 74 percent of the total area. In 2019, the forest-covered size was estimated to be around 9847.15 sq. km or 68 percent of the entire district area. During the 30 years (1989–2019), the 1040.51 sq. km (7.1%) has been degraded. There was a negative trend and an unfavourable signal for the physical environment, particularly biodiversity. During the study years of 1989 and 2019, the forest was divided into four categories: highly dense, moderately dense, less dense and very less dense.
In 1989, it was discovered that highly dense, moderately dense forests, and open forests covered 5462.90 sq km, 3368.12 sq km, and 2056.22 sq km of area, respectively. The high percentages of core forest areas suggest that natural resources are not under anthropogenic stress. It was revealed that in 2019, there were regions of highly dense, moderately dense and open forest covering 3846.63 sq. km, 4432.21 sq. km, and 1568.31 sq. km, respectively forest (refer table: 1). It has been noticed that the highly dense forest area has reduced over time due to continual human encroachment on the forest of time during the study period (1989–2019). The area of reasonably dense woodland has grown by 1063.86 sq. km. The non-forest area has steadily increased by 876.29 sq km due to severe anthropogenic interference with the forest; the forest has been cleared for agriculture, which has grown the settlement area shown in Figure 8.
Table 1: Forest cover density for the years 1989 and 2019.
No. | Forest Cover Type | 1989 (Area in %) | 2019 (Area in %) | Change in % |
1 | Highly dense forest | 37.7 | 26.5 | -11.2 |
2 | Moderately dense forest | 23.2 | 30.6 | +7.4 |
3 | Open forest | 14.23 | 10.8 | -3.43 |
4 | Scrub | 11.77 | 12.9 | -1.13 |
5 | Non - Vegetation | 13 | 19 | +6 |
 | Figure 8: Forest Cover Change Map for The Years 1989 and 2019.
|
The decline in canopy density indicates the necessity for increased conservation measures to protect the region's remaining forests. Local authorities and policymakers should consider these findings when deciding whether to use land, especially in areas where the canopy density has changed significantly. For climate change mitigation methods to be effective, it is essential to comprehend how variations in canopy density affect carbon sequestration. The study's identification of regions with lower canopy densities, which would need particular conservation measures, can assist direct efforts to protect biodiversity.
Conclusion
Understanding changes in forest ecosystems over time requires continuous monitoring of forest canopy density using a combination of geospatial methods and vegetation indicators. Using the NDVI, AVI, BSI, SI, TI, and FCD indices, a study was carried out in the Gadchiroli District of Maharashtra, India, and offers insightful information on the condition of the area's forests between 1989 and 2019. In response to changing canopy density, the findings illustrate the significance of conservation, land-use planning, climate action, and biodiversity preservation. More investigation and continuous monitoring are required to ensure these essential ecosystems' long-term survival and health.
FCD showed that healthy forests have suffered significant degradation, with a higher class of forest canopy density losing more than 70% between 1989 and 2019. A few centres and a few pockets in the Gadchiroli district's northwestern portion reveal largely non-forest areas with low FCD values. The eastern part of the district, which encompasses the entire Forest region, has exceptionally high FCD values. The forest covers the district's eastern portion, including the talukas of Sironcha, Etappali, Aheri, and Dhanora. In the eastern part of the district, hills may be found in Bhamaragad, Tipagad, Palasgad, and Surjagad. Similarly, somewhat dense forest rangers can be found in the district's upper reaches, such as the Armori, Wadasa, Kurkheda, and Korchi forest ranges. In the research period (1989–2019), it was found that the area of highly dense forest decreased; nevertheless, the moderately dense forest area expanded by 1063.86 sq. km, while the non-forest area increased by 876.29 sq. km.
The total forest cover area was 74 percent in 1989 but only 6 percent in 2009 and 2019 compared to 1989. Forest fires, increased mining activities, agricultural land use, and urban growth may contribute to deforestation and forest fragmentation in the district's centre and northern pockets. People's predisposition towards growing various crops has increased in recent years, as farming, along with animal husbandry, has become the main employment of the people in the Gadchiroli area, resulting in a significant rate of deforestation. Over time, the situation of intact forest cover might change in tropical and subtropical forest zones due to significant anthropogenic stress. As previously said, further research and development is needed to improve the accuracy of these models. When making decisions about balanced regional growth, sustainable development and forest ecological sustainability, policymakers and administrators should take these research findings into account.
Acknowledgement
The corresponding author is thankful to the Chhatrapati Shahu Maharaj Research, Training and Human Development Institute (SARTHI) for offering me a JRF and SRF fellowship under the CSMNRF 2021 for the research.
Conflict of Interest
The authors declare that there is no conflict of interest.
Funding Sources
There is no funding or financial support for this research work
Reefrences
- Kayet N, Pathak K, Chakrabarty A. and Sahoo S. "Spatial impact of land use/land cover change on surface temperature distribution in Saranda Forest, Jharkhand." Modeling earth systems and environment. 2016; 2: 1-10.
CrossRef - Boakye, E., S. N. Odai, K. A. Adjei, and F. O. Annor. "Landsat images for assessment of the impact of land use and land cover changes on the Barekese catchment in Ghana. European Journal of Scientific Research. 2008;22(2):269-278
- Deb, P., and Mishra A. Forest cover change estimation using remote sensing and GIS—A study of the Subarnarekha River Basin, Eastern India. In International conference on agriculture, food science, natural resource management and environmental dynamics: the technology, people and sustainable development. 2016:165-171
- Mayers J, and Bass S. Policy that works for forests and people: real prospects for governance and livelihoods. Earthscan, 2004;4
- Rai R. Yili Zhang, Basanta P., Acharya B. K, and Laxmi B. Land use and land cover dynamics and assessing the ecosystem service values in the trans-boundary Gandaki River Basin, Central Himalayas. Sustainability 2018; 10(9): 3052
CrossRef - Raha A. K, S. Sudhakar, and M. Prithviraj. "Forest change detection studies and wetland mapping through digital image processing of Indian remote sensing satellite data." The Journal of Ecology (Photon) 1997;108: 255-265
- Zhang, Xiaoyang, Mark A. Friedl, Crystal B. Schaaf, Alan H. Strahler, John CF Hodges, Feng Gao, Bradley C. Reed, and Alfredo Huete. "Monitoring vegetation phenology using MODIS." Remote sensing of the environment. 2003; 84(3): 471-475.
CrossRef - Singh S, Agarwal S, Joshi P. K, Roy P. S. Biome level classification of vegetation in western India—an application of wide-field view sensor (WiFS)."In Joint Workshop of ISPRS Working Groups I/1, I/3 and IV/4: Sensors and Mapping from Space, Hanover (Germany).1999; (9) 27-30
- Maselli F, Claudio C, Tiziana D. F, Stefano N. "Estimating forest parameters through fuzzy classification of TM data." IEEE Transactions on Geoscience and Remote Sensing. 1995;33(1): 77-84.
CrossRef - Beaulieu E, Yann L, Daniel V, François C, Philippe A, Yves G, and Marie-Claire P. Hydrological and vegetation response to climate change in a forested mountainous catchment. Modelling earth systems and environment 2016; 2:1-15
CrossRef - Dutta S, Mehebub S, Guchhait S. K. Assessing anthropogenic disturbance on forest health based on fragment grading in Durgapur Forest Range, West Bengal, India. Spatial Information Research. 2017;25: 501-512
CrossRef - Azizi, Z. "Forest canopy density estimating using satellite images. The international archives of the photogrammetry, remote sensing and spatial information sciences. 2008;8(11):1127–1130.
- Rikimaru A. Development of forest canopy density mapping and monitoring model using indices of vegetation, bare soil and shadow. In The 18th Asian Conference on Remote Sensing, Kuala Lumpur, Malaysia. 1997; E 6.1/6.6
- Singh R. K, Aparajita D, Reddy C. S. Spatial patterns of forest fragmentation in Manipur, North East India: A case study using RS and GIS technique. International Journal of Earth Science and Engineering 2013; 6(6): 1713-1717
- Jaybhaye, R. G, Badhe Y. P., Hingonekar P. S. Forest Fragmentation Analysis in Part of Kalsubai Harishchandragad Wildlife Sanctuary of Northern Western Ghats, Maharashtra. Indian Journal of Ecology. 2022;49(2):553-558
- Southworth J, Darla M, Harini N. Land cover change and landscape fragmentation—comparing the utility of continuous and discrete analyses for a western Honduras region. Agriculture, ecosystems & environment. 2004;101(2-3): 185-205
CrossRef - Jaybhaye, R. G, Badhe Y. P, Kale P. K. Assessment of Forest Cover Change in Part of The Northern Western Ghats: A Case Study of The Kas and Panchgani Plateaus. The Indian Geographical Journal. 2021; 96(1):60-72
- Bhandari AK, Kumar A, Singh GK. Feature extraction using Normalized Difference Vegetation Index (NDVI): A case study of Jabalpur city. Procedia technology. 2012 Jan 1; 6:612-21.
CrossRef - Richardson AJ, Everitt JH. Using spectral vegetation indices to estimate rangeland productivity. Geocarto International. 1992 Mar 1;7(1):63-9.
CrossRef - Duy NB, Giang TT, Son TS. Study on vegetation indices selection and changing detection thresholds selection in Land cover change detection assessment using change vector analysis. International Environmental Modelling and Software Society (iEMSs).2012
- Pandian M, Nandhini R. Forest canopy density and ASTER DEM based study for dense forest investigation using remote sensing and GIS techniques. International Journal of Research in Environmental Science and Technology. 2016;6(1):1-4.
CrossRef


