Groundwater Assessment in Udham Singh Nagar, Uttarakhand, India Using Multivariate Statistical Techniques, WQI, and HPI
Bahadur Singh Kotlia
 and Shahditta Bakshi
*
and Shahditta Bakshi
*
1
Centre of Advanced Study in Geology,
Kumaun University,
Nainital,
Uttarakhand
India
http://dx.doi.org/10.12944/CWE.18.3.06
Copy the following to cite this article:
Kotlia B. S, Bakshi S. Groundwater Assessment in Udham Singh Nagar, Uttarakhand, India Using Multivariate Statistical Techniques, WQI, and HPI. Curr World Environ 2023;18(3). DOI:http://dx.doi.org/10.12944/CWE.18.3.06
Copy the following to cite this URL:
Kotlia B. S, Bakshi S. Groundwater Assessment in Udham Singh Nagar, Uttarakhand, India Using Multivariate Statistical Techniques, WQI, and HPI. Curr World Environ 2023;18(3).
Download article (pdf) Citation Manager Publish History

Introduction
Due to its extensive effects on human health, sustainable management of water and its contamination requires our full attention. The litho logy of the region, atmospheric input, climatic situation, and anthropogenic input are a few notable elements that can have an extensive impact on the quality of groundwater resources at any given location. Surface and groundwater are harmed by natural process for example variations in rain inputs, soil wearing away, and weathering of crustal rocks, which impair the utilisation of water resources for a variety of reasons, including drinking, industrial use, farming, recreation, and other uses. Surface run off is a cyclic phenomenon that is mostly influenced by the climate in the basin, unlike wastewater from municipal and industrial release, which contains a persistent pollute source 1, 2. Changes in water chemistry at both the temporal and spatial levels, as well as yearly variations in precipitation type and rate, surface runoff, groundwater flow rate, and water interception and detachment, all have a major effect on river discharge, which in turn has a result on pollutant concentrations in surface and groundwater 3, 2.
If metal-containing solutions enter the surface with organic matter in the soil, the patches of natural heavy metals become poisoned. As a result, surface soil and water can contain up to several percent of heavy metal Pb and others. Geogenic or anthropogenic activities may cause trace metal contamination of groundwater; a few trace metals, e.g., zinc, copper and manganese is necessary for humans, high levels may result in physiological problems. Pb occurs as only one mineral galena(PbS) that are disseminated through largely mono-mineralized rock (quartzite, primarily SiO2), making the geological setting of our study area relatively simple. The main rocks types of the study area are gneisses, quartzite, schist, calc-silicate, and leucogranite dikes, especially at higher (northern) elevations4. Depending on the physiographic, geology and soil texture of the area, the chemical class of groundwater of shallow & deep aquifers varies widely. The Ca-Mg-HCO3 and Ca-HCO3 types of groundwater aquifers are dominated. Cr and Pb trace metals are noxious at low concentration 5. Such as industrialization and urbanization types of anthropogenic activity have led to the result of environmental contamination on today's earth. As per 2002 UN reports, in urban areas, 50% of the world's residents lives and grows faster because of continued human subsistence. Environmental pollution has a feeble impact on air, land and water quality. Notably, Groundwater accounts for only 0.61 percent of the globe's total water resources, with oceans and frozen icebergs providing twenty percent ??of the globe's supply of freshwater 6. The largest source of drinkable water that is currently available on a worldwide scale, out of all the freshwater, is groundwater. In developing nations like India, groundwater is used for household, industrial, and agricultural uses.
The main issue with the pollution of groundwater is the unbearable disposal of industrial, agricultural and home waste. Groundwater contamination has a detrimental result on both human health and aquatic environment. The swift industrialisation and urbanisation caused a buildup of trace metals in the soil & water, which has been reported in a abundant studies from India. The existence of natural heavy metals gives suitable places for assessing the form of heavy metals in groundwater, as indicated by high heavy metal concentrations. 7 Have also done a good job ondrinking groundwater in this area with limited water samples. It is the first time that the entire area of ??Udham Singh Nagar district has been densely covered with a big quantity of samples to get the precise results and the data analyzed by WQI, HPI and multivariate statistical techniques simultaneously.
 | Figure 1. Studied location points of collected water Samples (a total of 250 samples were collected).
|
Study Area
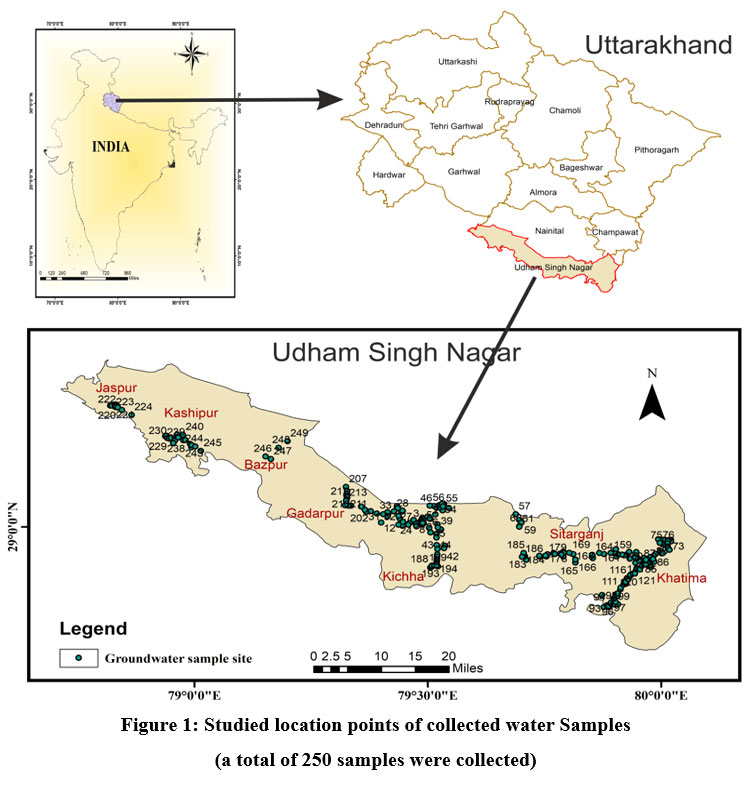
U S Nagar District is the ninth-largest district in Uttarakhand State by area (3055 km2). It is located between latitudes 28° 53' and 29° 23' N and laterally stretches between longitudes 78° 45' and 80° 08' E; on the north, it is surrounded by the Uttarakhand districts of Nainital and Champawat; on the south, by the Uttar Pradesh districts of Rampur, Moradabad, Philibhit, and Bareilly; on the west, by the Uttar Pradesh district of Bijnor; and on the east, by Nepal. The international border between India and Nepal runs along the Sharada River in the east. District U S Nagar comes under the Tarai region and is part of the Kumaon Division of Uttarakhand. Tarai is the name it derived due to marshy condition. Southern part of the Bhabar Formation is the Tarai Formation, and Udham Singh Nagar and Haridwar districts cover Uttarakhand's Tarai belt. It features a substantial drainage network. The U S Nagar is the Meal Goblet of Uttarakhand State. As the geographical location is helpful, it is also known for industries and also for agriculture and irrigation on a synchronous pattern, it is known as the "Chawal ki Nagari" and has earned fame for its productivity in paddy fields throughout the state of Uttarakhand, making the district crucial for producing groundwater brochures 8. The average annual rainfall is 128.2 cm, and the climate is sub-tropical and sub-humid with three distinct seasons: summer, monsoon, and winter. Approximately 90% of the rainfall falls during the monsoon period. The remaining 10% falls during non-monsoon periods 8. The geology of the research region is expressed by Piedmont alluvial deposits, which play a significant part in determining the groundwater situation of an area. It can be broadly separated into the Bhabar and Tarai formations 8. Fig.1 depicts a map of the research region.
Sample collection and methodology
We collected samples from main towns and surrounding villages along the National Highway and major sub-Highways. Once a hand pump was identified, its elevation, latitude and longitude were recorded using a handheld GPS receiver and a water sample was collected in 250 ml wide-mouth polypropylene bottles and noted down the temperature of the water. Additionally, the onsite occurrence of topography, land use, water access, and purpose of use was recorded. A total of 250 samples during monsoon season of the year 2021 were used for laboratory analysis. Samples were taken from government and private hand pumps and tube wells to identify potentially vulnerable sites. In this study, we have given the study area two types of code UAW (Artesian well) and UHP (govt. and private hand pumps). For water sampling and collection the APHA (“American Public Health Association”) Recommended Procedures are used 9. The samples were first filtered with Whatmann's filter paper to remove the undissolved material. Following this, each water sample was tested for drinking specifications to decide the water quality and appropriateness for usage. The pH value, EC, TDS, ORP, DO and Salinity were measured, following the standard code of Indian Bureau 12 for testing procedures of physio-chemical analysis. Furthermore, Values were measured by digital water and soil analysis kit (Model-161). Chloride content was measured by the titration method, the measurements of Pb, Fe, Zn Cu, Cr, Ni, Mn, Mg, K, and Na were performed in the AAS (Atomic Absorption Spectrometer) of Varian (Model AA240FS) using air–acetylene flame and Fluoride, Nitrate, measured in Double Beam Spectrophotometer (Model 3375) in the Department of Geology, Kumaun University respectively. To get the best results, the preparation conditions were modified in accordance with the manufacturer's specifications, and metal quantification was based on calibration curves of standard solutions (in acidic medium), which were determined numerous times during the analysis. This equipment allows us to measure several elements to produce consistent results. The obtained results were then analyzed and compared with BIS standard 10 and WHO 11. Above the permissible limit, the sources are to be discarded 10. See Table 5: The physio-chemical parameter and heavy metals in the study area show Descriptive statistics.
WQI Determination
In this study, the method adopted for calculating WQI is taken from 12, 13. A total of 9 parameters were considered, and on the on the whole quality of water, according to its relative importance a definite “Assigned Weightage”(Wa) was given to each parameter. This ranges from 1 to 5. The weightage 5 is assigned, which has the most influence on Water quality and 1 is assigned to one causative the least. Relative weights(Wr) calculation:
Here each parameter represented by Wa as “Assigned Weightage” and the number of parameters taken as “n” and the “Relative Weight” as Wr for every parameter calculated as per equation (1). The calculated relative weightage is shown in Table 1. Subsequent to assigning relative weightage, calculate the "Quality Rating Scale"(Q) by dividing the concentration of the considered factor (Ci) by its respective “Standard Value”(Si) as mentioned in the guiding principle of the WHO and BIS (Indian Standards).
For the two parameters, i.e., dissolved oxygen (DO) and pH, the Q value is calculated another way by using their “Ideal Values” (Vi) 14, 15, 16. For pH, the Ideal Value (Vi) is 7, and DO is 14, and the calculation for the above is given below.
Table 1: Each parameter's weightage and relative weightage.
A | B | C | D = C/29 |
S. No | Parameter | Weight (Wai) | Relative weight (Wr) |
1 | pH | 4 | 0.13793103 |
2 | TDS | 4 | 0.13793103 |
3 | EC | 5 | 0.17241379 |
4 | DO | 4 | 0.13793103 |
5 | Na+ | 1 | 0.03448276 |
6 | Mg++ | 2 | 0.06896552 |
7 | F¯ | 2 | 0.06896552 |
8 | Cl¯ | 3 | 0.10344828 |
9 | NO3¯ | 4 | 0.13793103 |
|
| Ei=1n Wai = 29 |
|
Table 2: WQI, the two (Water quality) scales that have been referred to are as follows.
WQI (values) | ||
Water Quality Scale | Yadav Index 17 | Ramakrishnaiah Index 18 |
Excellent | 0-25 | < 50 |
Good | 26-50 | 50-100 |
Poor | 51-75 | 100-200 |
Very Poor | 76-100 | 200-300 |
Unsuitable | >100 | >300 |
After computing Q values, the "Sub-Indices" (SI) are calculated as a product of relative weight (Wr) and Quality rating scale (Qi), and in the end, the WQI is the sum of all sub-Indices. The calculation of WQI is given by equ. (5).
Table 3: Standards used for the WQI index computation.
Chemical parameters | C | D = C/29 | Ci | Si | Oi | SI | WQI |
Weight (Wai) | Relative weight (Wr) | ||||||
pH | 4 | 0.13793103 | 8.03 | 8.5 | 68.66667 | 9.471264 | 41.065 |
TDS ( mg/l ) | 4 | 0.13793103 | 350 | 500 | 70 | 9.655172 | |
EC ( ?moh/cm ) | 5 | 0.17241379 | 500 | 750 | 66.66667 | 11.49425 | |
DO ( mg/l ) | 4 | 0.13793103 | 10 | 5 | 44.44444 | 6.130268 | |
Na ( mg/l ) | 3 | 0.10344828 | 11.4 | 200 | 5.7 | 0.589655 | |
Mg ( mg/l ) | 1 | 0.03448276 | 46.25 | 100 | 46.25 | 1.594828 | |
F¯ ( mg/l ) | 2 | 0.06896552 | 0.057 | 1.5 | 3.8 | 0.262069 | |
Cl¯ ( mg/l ) | 2 | 0.06896552 | 9.1 | 1000 | 0.91 | 0.062759 | |
NO3¯ ( mg/l ) | 4 | 0.13793103 | 5.89 | 45 | 13.08889 | 1.805364 |
Note: E SI = 41.065
HPI Determination
By assigning a rating or weightage(Wi) for each suitable parameter, the HPI was developed, its rating system is a random value between 0 and 1, expressing the relative significance of particular quality concern, and can be definite as inverted ratio to the standardised allowable value(Si) for each parameter 17, 18. The most liberal value for drinking water (Si), in the absence of a substitute water supply, denotes the BIS 10 upper limit permissible concentration. According to BIS 10, the standard limits for the same characteristics in drinking water are denoted by the intended value (Ii). Below is the HPI Index given by Mohan 18.
Where Qi is the ith Water quality parameter's sub-index. The weight associated with ith water's quality parameter is denoted by Wi. The parameter's sub-index (Qi) is calculated as follows:
Where Mi as the monitor value, Ii as the ideal value and Si as the standard value of the ith parameter's heavy metal. The symbol (-) represents the difference in value between the two numbers, but the algebraic sign is ignored. In general, the important pollution index of HPI value for consuming water is 100 18, 19.
Table 4: standard used for the HPI index computation (Unit in mg/l).
Elements | Mi | Si | Ii | Wi | Qi | Wi. Qi | HPI |
Lead, Pb | 0.0990 | 0.05 | 0 | 20 | 198 | 3960 | 28.53 |
Chromium, Cr | 0.0131 | 0.05 | 0 | 20 | 26.2 | 524 | |
Zinc, Zn | 0.0257 | 15 | 5 | 0.066666667 | -49.743 | -3.3162 | |
Manganese, Mn | 0.0361 | 0.3 | 0.1 | 3.333333333 | -31.95 | -106.5 | |
Copper, Cu | 0.0279 | 1.5 | 0.05 | 0.666666667 | -1.52414 | -1.01609 | |
Iron, Fe | -0.2201 | 0.3 | 0 | 3.333333333 | -73.3667 | -244.556 | |
Nickel, Ni | -0.0054 | 0.02 | 0 | 50 | -27 | -1350 |
Note: E Wi = 97.39, EWi.Qi = 2778.612, HPI value = 28.529
Multivariate statistical methods
Principal Component Analysis:
To generate new hidden factors that are orthogonal and not correlated, through a linear combination of original data, PCA reduces the dimensionality of data 20. The covariance matrix of the initial variables extracts Eigen-values and eigenvectors 21. In the PCs (principal components), Eigen-values are a measure of their connected inconsistency. The loadings provide the input of novel variables in PCs, and the geographic locations of the objects are referred to as scores 22, 23, 24. In order to convey the variation in the data as succinctly as possible, PCA offers an intended method for finding these kinds of indices 25. The experimental groundwater data has been statistically analyzed by GNU pspp 1.2.0 software and JASP 0.17.1.0.
Factor analysis
Is differs from PCA in that an experiential correlation matrix is created for both the extraction and underpinning theory. The FA aim can be accomplished by twisting the PCA line in accordance with well-established concepts and adding additional factors, commonly referred to as variable factors (VF). The coefficient of correlation matrix assesses how well the variation of each component can be explained by how it's related to the others. "Strong," "Moderate," and "Weak" terms are used to denote factor loadings, and they apply to comparative loading levels of 0.75, 0.75-0.50, and 0.50-0.30, respectively, according to 26. The experimental ground water data has been statistically analyzed by GNU pspp 1.2.0 software and JASP 0.17.1.0.
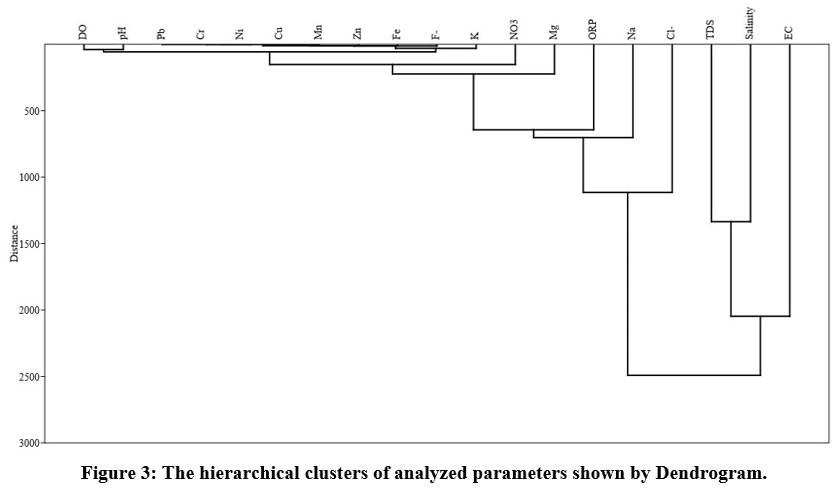
Hierarchical clustering analysis (HCA)
Is an approach that groups together variables that are connected in a cluster. Each cluster is distinguished by homogenous variables from the other clusters. A graphic summary of the algorithm's results might be used to illustrate the results of the grouping process in form of a Dendrogram. The HCA next to the square Euclidian distance and the single linkage method is successfully performed in the current study by using statistical software. Past 4.03.
Results and discussion
Groundwater quality for drinking purposes
The determined Groundwater quality is represented in Table 5, where all parameter values are compared with BIS standard 2012 and shown by Mean, Standard deviation, Minimum, and Maximum. The pH value varies from 6.31 to 8.54, having an average value of 7.637 ± 0.416 in the study area, which indicated the groundwater has somewhat acidic to somewhat alkaline samples. Only two samples showed the over limit of pH in groundwater samples. The EC value varies from 59 to 738 (?moh/cm) Having an average value of 333.204 ± 143.214 (?moh/cm). The TDS value varies from 38 to 486mg/l having an average value of 214.212 ± 92.161mg/l. The DO, ORP, and salinity values varies from 4.1 to 8.6 mg/l, -82 to 38 mV, and 80 to 500mg/l, respectively, Having an average value of 5.216 ± 0.509mg/l, -33.62 ± 23.016 mV, 158.016 ± 83.472mg/l respectively.
Table 5: The physio-chemical parameter and heavy metals in the study area show Descriptive statistics (N=250).
Parameter | Mean | Std. Deviation | Minimum | Maximum | Acceptable limit as BIS 10500-2012 | Permissible limit as BIS 10500-2012 | Standard WHO (2011) |
pH | 7.637 | 0.416 | 6.31 | 8.54 | 6.5-8.5 | No Relaxation | - |
EC (?moh/cm) | 333.204 | 143.214 | 59 | 738 | - | - | - |
TDS (mg/l) | 214.212 | 92.161 | 38 | 486 | 500 mg/l | 2000 mg/l | - |
DO (mg/l) | 5.216 | 0.509 | 4.1 | 8.6 | - | - | - |
ORP mV | -33.62 | 23.016 | -82 | 38 | - | - | - |
Salinity (mg/l) | 158.016 | 83.472 | 80 | 500 | - | - | - |
Pb (mg/l) | 0.032 | 0.083 | -0.27 | 0.395 | 0.01 mg/l | No Relaxation | 0.01 mg/l |
Cr (mg/l) | 0.007 | 0.004 | -0.008 | 0.016 | 0.05 mg/l | No Relaxation | 0.05 mg/l |
Zn (mg/l) | 0.173 | 0.684 | -0.196 | 7.467 | 5 mg/l | 15 mg/l | - |
Mn (mg/l) | 0.03 | 0.106 | -0.366 | 1.025 | 0.1 mg/l | 0.3 mg/l | 0.4 mg/l |
Cu (mg/l) | 0.006 | 0.034 | -0.03 | 0.492 | 0.05 mg/l | 1.5 mg/l | 2 mg/l |
Fe (mg/l) | 0.563 | 0.569 | -0.328 | 1.625 | 0.3 mg/l | No Relaxation | - |
Ni (mg/l) | 0.013 | 0.016 | -0.021 | 0.043 | 0.02 mg/l | No Relaxation | 0.07 mg/l |
K (mg/l) | 1.897 | 1.377 | 0.023 | 7.957 | - | - | - |
Na (mg/l) | 22.22 | 43.938 | 0.356 | 335.68 | - | - | - |
Mg (mg/l) | 24.717 | 10.942 | 1.7 | 46.53 | 30 mg/l | 100 mg/l | - |
F¯ (mg/l) | 0.619 | 0.608 | -0.947 | 2.558 | 1.0 mg/l | 1.5 mg/l | 1.5 mg/l |
Cl¯ (mg/l) | 54.68 | 106.297 | 0.801 | 755.29 | 250 mg/l | 1000 mg/l | 200-300 mg/l |
NO3¯ (mg/l) | 16.412 | 3.942 | 8.873 | 26.089 | 45 mg/l | No Relaxation | 50 mg/l |
The concentration of cations Cr, Zn, Cu, K, and Na, ions varies from -0.008 to 0.016mg/l, -0.196 to 7.467mg/l, -0.03 to 0.492mg/l, 0.023 to 7.957mg/l, 0.356 to 335.68mg/l, Having an average value of 0.007 ± 0.004mg/l, 0.173 ± 0.684mg/l, 0.006 ± 0.034mg/l, 1.897 ± 1.377mg/l, 22.22 ± 43.938mg/l, respectively. The concentration of dissolved anion, NO3¯, varies from 8.873 to 26.089mg/l, having an average value of 16.412 ± 3.942mg/l.
The Fe value varies from -0.328 to 1.625mg/l having an average value of 0.563 ± 0.569mg/l, and the Iron value in out of 250 samples, 185 samples crossed the desirable limit as per BIS. According to 27, the higher content of Fe alters the flavour and look of water while fostering the development of iron bacteria. Continuous usage of too much Fe can result in sluggishness, liver difficulties, joint discomfort, weight loss, and eventually heart disease, diabetes issues, and hemosiderosis 28, 29.
The Pb value varies from – 27 to 0.395mg/l, having an average value of 0.032 ± 0.083mg/l. The Lead concentration out of 250 samples, 180 samples crossed the desirable limit of BIS. The high concentration of Lead in the human body causes blood disorders, hearing loss, reduced mental capacity, and interference with renal and neurologic functions, hypertension, and high-level deaths. The treatment of Pb in water is possible by ion exchange, distillation, activated carbon, and reverse osmosis.
The Nickel value varies from -0.021 to 0.043mg/l, having an average value of 0.013 ± 0.016mg/l. The Ni concentration in 117 groundwater samples crossed the desirable limit of BIS. According to 30 and 31, ingesting too large a quantity of Ni in groundwater increases the chance of developing lung cancers, larynx nose, prostrate, congenital disabilities, respiratory failures, and heart disorders.
The Mg value varies from 1.7 to 46.53mg/l having an average value of 24.717 ± 10.942mg/l. The Mg value in 82 groundwater samples crossed the desirable limit of BIS 10. As per 32 Magnesium is an essential nutrient for people, and the micro-element Mg is necessary for the development of muscles, DNA replication, membrane function, and stimulation of nerve transmission.
The Mn value varies from -0.366 to 1.025mg/l, having an average value of 0.03 ± 0.106mg/l. The Mn value in 24 groundwater samples crossed the desirable limit of BIS. Manganese is important for humans, and a lack of it may impair development, cause skeletal malformations, and cause reproductive disorders. Consuming more Mn, on the other hand, may be responsible for a condition known as manganism, which may induce muscular weakness 33. 34 observed that high Mn in potable water can cause adult neurological problems.
The Fluoride value varies from -0.947 to 2.558mg/l having an average value of 0.619 ± 0.608mg/l, the F¯ out of 250 samples 63 crossed the desirable limit of BIS. Fluoride is a crucial micronutrient that the human body needs in small quantities. Drinking water with 1 mg/l of fluoride reduces dental plaque and girds the apatite matrix tissues 35 and 36. At a higher level of concentration, which is as follows, fluoride causes various diseases of teeth and bones when the content in drinking water exceeds 1.5mg/L: Constant exposure to high fluoride (F-) exceeding (4–10 mg/l) in drinking water causes skeletal fluorosis and a disabling condition characterised by over-mineralization of joints and bones 37.
The Chloride value varies from 0.801 to 755.29mg/l having an average value of 54.68 ± 106.297mg/l, the Cl¯ out of 250 samples, 12 crossed the desirable limit of BIS. Although chloride ions are safe at low quantities, well water with high chloride ions concentrations may harm plants if used for irrigation or gardening, and it may also impart an unpleasant taste to drinking water if consumed 38.
The cations which were over the limit in groundwater samples are presented in chronological order Fe > Pb > Ni > Mg > Mn > Zn > Cu, and significant anions were over the limit F¯ > Cl¯, and the rest was under the limit. from this research found that a large amount of the groundwater samples showed high concentrations of Fe, Pb, Ni, Mg, Mn, F¯ and Cl¯ values in the study area. Weathering of rocks and discharge of industrial waste could be the primary sources of groundwater contamination. 8 reported that the anomalous values of TH, TDS, Mg, Fe, and Pb in the U S Nagar area confirm about degradation in the groundwater quality. So that previous study agrees that Fe concentration in groundwater of samples in the study area exceeded the Desirable limit of 0.3mg/l, the results were somewhat similar to ours. According to 39, the presence of Lead in groundwater samples of Uttarakhand was high compare to the BIS standard limit. The research area of this article was Dehradun, Vikasnagar, Dakpathar, Haridwar, and Roorkee, which supports our research that lead concentration is above the desirable limit in U S Nagar.
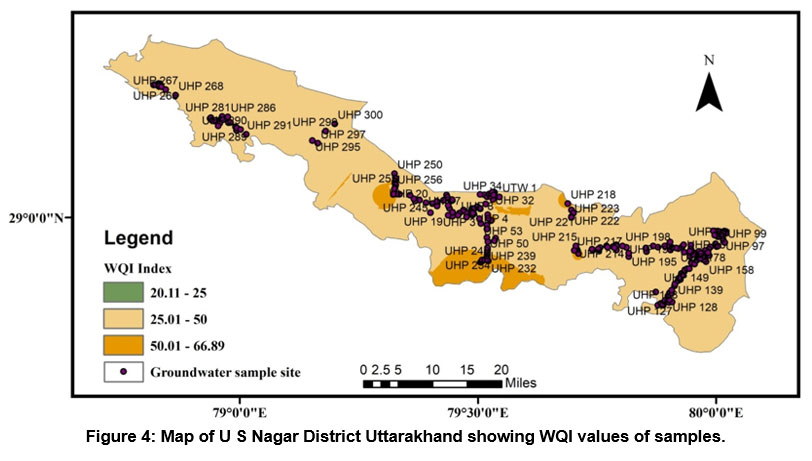
Water quality Index Results
WQI was implemented in the research region to assess groundwater quality for drinking water purposes. WQI index was calculated for 250 samples, and for this, we used the parameters pH, Electric conductivity, Total Dissolved solid, Dissolved Oxygen, Mg, Na, F¯, Cl¯, and No3¯. The result of wqi varies from 17.83 to 67.60, with an average value of 43.42. We have used two WQI index categories (Yadav and Ramakrishnaiah) to evaluate the WQI result. According to 15, if WQI is smaller than 25, the water class is classify as excellent, if the WQI is between 26 and 50, it is considered to be of Good Water class type. poor Water class type is defined as being between 51 and 75, very poor Water class type is defined as being between 76 and 100, and unsuitable for drinking water type is defined as being greater than 100(see Table 2). Out of two fifty groundwater samples Water class of 5 samples (2 %) comes under the excellent, 211 samples (84.4 %) fall under good class, and 34 samples (13.6 %) have poor Water quality WQI status as per Yadav index (see Table 6). Further, referring to the 16 index if WQI is smaller than 50, the Water class is classify
Table 6: Analysis of Water Quality Indices is as follows.
Water Quality Index | Yadav Index 17 | Ramakrishnaiah Index 18 | ||
No. of samples | Percentage of the samples | No. of samples | Percentage of the samples | |
Excellent | 5 | 2 | 216 | 86.4 |
Good | 211 | 84.4 | 34 | 13.6 |
Poor | 34 | 13.6 | - | - |
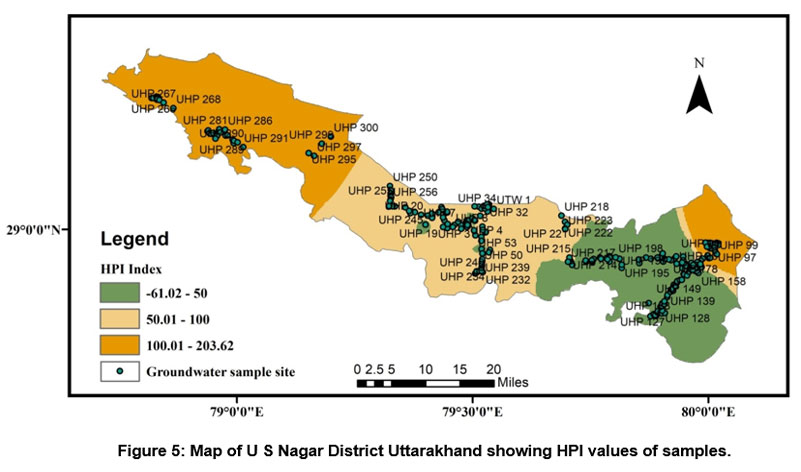
Heavy metal pollution index Results:
A HPI rating was also used to measure the class of groundwater in research region. Because the role of heavy metals in drinking water is significant, the amount of these heavy elements in groundwater can be used to determine how polluted it is. The result of the HPI index varies from -107.95 to 227.60 and an average value of 54.35. We have used two HPI categories (Indian and International standards) to evaluate groundwater quality. According to Indian Standard, it is classified as a low-grade degree of pollution type if it is smaller than 50, if it is between 50 and 100 medium grade degree of pollution type, and a High-grade degree of pollution classify if it is larger than 100 (see Table 7). Out of two fifty groundwater samples, nearly 40.4% of samples show a low degree of pollution, 33.2% of samples show a medium degree of pollution, and 26.4% show a High degree of pollution. According to International Standard, it is classified as a low-grade degree of pollution type if it is smaller than 60 if it is between 60 and 120, medium grade degree of pollution type, and High-grade degree of pollution type classify if it is larger than 120, and out of two fifty groundwater samples 46% samples show low degree of pollution, 38% samples medium degree of pollution and 16% show high grade of degree of pollution (see Table 7). Standards used for the HPI index computation are shown in (Table 4). According to both standards of the HPI, overall values (except for some individual sites) lie under low to moderate groundwater pollution. Figure 5 depicts the spatial distribution of WQI in the research region.
Table 7: Categories of Groundwater Pollution Indices 40.
Index method | Category | Degree of pollution | No. of samples | Percentage of the samples |
HPI (International Standard) | <60 | Low | 115 | 46 |
60–120 | Medium | 95 | 38 | |
>120 | High | 40 | 16 | |
HPI (Indian standard) | <50 | Low | 101 | 40.4 |
50–100 | Medium | 83 | 33.2 | |
>100 | High | 66 | 26.4 |
Principal component analysis (PCA)/factor analysis (FA)
PCA is used to identify sources of heavy metals according to standard procedures. To better explain the many groups and sources that might have an impact on water systems, to maximise the total variance of factorial coefficients, varimax rotation is performed.
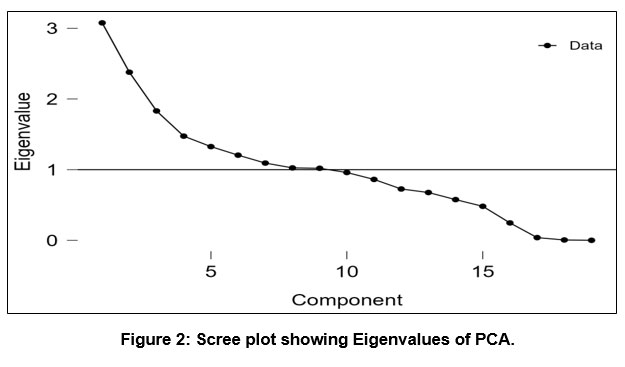
The cumulative percentage and percentages of variance are described together with the total variance in Table 8. The scree graph also helps determine how many PCs should be kept in order to comprehend the structure of the underlying parameters (see Fig. 2), it shows the rough outline of the component's Eigen-values. Its collective Eigen-values % yield nine PCs with Eigen values > 1, This scree plot reveals a considerable variation in slope, accounting for 72.17% of the overall variance in the dataset, from the 1st to the 2nd Eigen-value, thus because PC_1 is responsible for 16.19% of the variation in the water quality, PC_2 is accountable for 12.52%, PC_3 Showing 9.64%, PC_4 Showing 7.76%, PC_5 Showing 6.98%, PC_6 Showing 6.34%, PC_7 Showing 5.75%, PC_8 Showing 5.39%, and PC_9 Showing 5.37%, respectively. In the research, the factor loading matrix is produced on the basis of groundwater quality markers. An Eigen-value quantifies the importance of a factor. The variables with the highest significance have the greatest Eigen-values; Eigen-values of 1.0 or above are considered significant 41. For the whole dataset after varimax rotation, the Factor Loadings matrix is listed in Table 9. More than 16.19 % of the total variance explains by the first PC_1. It contains EC, TDS, and salinity, indicating the physio-chemical variability source. The PC_2, explaining 12.52 % of the total difference, is laden with Na and Cl¯, indicating natural causes like the geogenic process from the salty type of rocks. The PC_3 is loaded with pH and ORP (Oxidation-Reduction Potential), accounting for 9.64 % of the total variance. The pH indicates groundwater's acidity and alkalinity by the rocks' leaching. The occurrence of an oxidising agent is indicated by an ORP value, it is an essential indicator of pollution levels, and a low reading suggests the presence of a reducing agent. Pollution of the water levels tends to rise when ORP levels are low and fall when they are high. The PC_4, accounting for 7.76 % of the total difference, is allied with the high Fe loading and weak Ni loading, indicating a geogenic factor. The PC_5 has weak to moderate loadings of Ni and Pb, Zn, respectively, with the 6.98 % of the total variance and which is linked to explain the leaching of minerals and partial natural weathering processes from rocks like carbonate rocks (limestone, dolomite), and quartzite and transported to the underground seepages. Lead also occurs from anthropogenic activities like paints, automobile parts, batteries, and sewage. The PC_6 is linked to geogenic sources and has a significant Mn loading, accounting for 6.34% of the total variation. Mn often occurs naturally in sedimentary rocks or from mining and industrialized wastage. The PC_7 has weak loadings of F¯containing 5.75 % of the total variance, which is linked to fluoride occurring, dissolution in groundwater is favorable in an alkaline environment. The PC_8, explaining 5.39 % of the total variance, is weighed down with K, indicating the source of silicate minerals by the geogenic process.
Table 8: Total Variance Explained.
component | Initial Eigenvalues | Extraction Sums of Squared Loadings | Rotation Sums of Squared Loadings | ||||||
Total | % of variance | Cumulative % | Total | % of variance | Cumulative % | Total | % of variance | Cumulative % | |
1 | 3.08 | 16.19 | 16.19 | 3.08 | 16.19 | 16.19 | 2.86 | 15.06 | 15.06 |
2 | 2.38 | 12.52 | 28.71 | 2.38 | 12.52 | 28.71 | 2.17 | 11.4 | 26.47 |
3 | 1.83 | 9.64 | 38.35 | 1.83 | 9.64 | 38.35 | 2.01 | 10.59 | 37.06 |
4 | 1.47 | 7.76 | 46.11 | 1.47 | 7.76 | 46.11 | 1.48 | 7.81 | 44.87 |
5 | 1.33 | 6.98 | 53.09 | 1.33 | 6.98 | 53.09 | 0.04 | 0.2 | 45.07 |
6 | 1.2 | 6.34 | 59.43 | 1.2 | 6.34 | 59.43 | 0 | 0.03 | 45.09 |
7 | 1.09 | 5.75 | 65.18 | 1.09 | 5.75 | 65.18 | 0 | 0 | 45.09 |
8 | 1.02 | 5.39 | 70.58 | 1.02 | 5.39 | 70.58 | 0.32 | 1.67 | 46.76 |
9 | 1.02 | 5.37 | 75.94 | 1.02 | 5.37 | 75.94 | 1.49 | 7.85 | 54.61 |
10 | 0.96 | 5.05 | 80.99 |
|
|
|
|
|
|
11 | 0.86 | 4.54 | 85.53 |
|
|
|
|
|
|
12 | 0.73 | 3.82 | 89.35 |
|
|
|
|
|
|
13 | 0.68 | 3.56 | 92.91 |
|
|
|
|
|
|
14 | 0.58 | 3.03 | 95.94 |
|
|
|
|
|
|
15 | 0.48 | 2.53 | 98.48 |
|
|
|
|
|
|
16 | 0.25 | 1.3 | 99.77 |
|
|
|
|
|
|
17 | 0.04 | 0.2 | 99.97 |
|
|
|
|
|
|
18 | 0 | 0.03 | 100 |
|
|
|
|
|
|
19 | 0 | 0 | 100 |
|
|
|
|
|
|
Table 9: After varimax rotation Factor Loadings matrix for the whole dataset.
Parameters | PC1 | PC2 | PC3 | PC4 | PC5 | PC6 | PC7 | PC8 | PC9 |
pH | -0.12 | 0.06 | 0.99 | 0.00 | -0.03 | -0.01 | -0.05 | 0.08 | 0.11 |
EC | 0.99 | 0.00 | -0.07 | -0.06 | 0.13 | 0.03 | -0.01 | 0.02 | -0.01 |
TDS | 0.98 | 0.00 | -0.08 | -0.05 | 0.14 | 0.04 | -0.01 | 0.03 | -0.02 |
DO | 0.06 | 0.10 | 0.07 | 0.14 | 0.02 | -0.12 | -0.14 | 0.05 | 0.02 |
ORP | 0.10 | -0.05 | -0.94 | -0.03 | 0.07 | 0.10 | -0.03 | -0.07 | -0.02 |
Salinity | 0.79 | -0.01 | -0.10 | -0.01 | -0.17 | -0.13 | 0.04 | 0.01 | 0.21 |
Pb | 0.01 | -0.12 | 0.02 | -0.09 | 0.58 | -0.07 | 0.16 | -0.02 | -0.23 |
Cr | -0.02 | -0.08 | -0.01 | -0.01 | -0.09 | 0.07 | 0.12 | -0.38 | -0.02 |
Zn | 0.09 | -0.02 | -0.09 | 0.06 | 0.51 | 0.13 | -0.03 | 0.04 | 0.11 |
Mn | -0.03 | -0.1 | -0.06 | 0.00 | 0.07 | 0.81 | -0.05 | -0.13 | 0.03 |
Cu | 0.04 | -0.03 | 0.05 | -0.04 | 0.00 | 0.00 | 0.05 | 0.07 | 0.25 |
Fe | -0.09 | -0.06 | 0.01 | 0.98 | -0.03 | 0.05 | 0.13 | 0.00 | -0.17 |
Ni | -0.10 | -0.08 | -0.01 | 0.39 | 0.39 | -0.07 | -0.14 | 0.16 | 0.11 |
K | 0.28 | -0.1 | -0.02 | 0.07 | -0.18 | -0.11 | 0.27 | 0.47 | 0.19 |
Na | -0.02 | 0.99 | 0.05 | -0.03 | -0.09 | -0.08 | 0.06 | -0.06 | -0.04 |
Mg | 0.02 | 0.05 | -0.04 | -0.01 | 0.00 | 0.00 | -0.02 | -0.19 | -0.02 |
F¯ | 0.00 | 0.12 | 0.15 | 0.00 | 0.11 | -0.14 | 0.43 | 0.03 | -0.03 |
Cl¯ | -0.01 | 0.98 | 0.06 | -0.04 | -0.09 | -0.08 | 0.05 | -0.06 | -0.04 |
NO3- | -0.02 | 0.00 | 0.10 | -0.03 | 0.04 | -0.06 | -0.30 | 0.01 | -0.16 |
Eigenvalues | 3.08 | 2.38 | 1.83 | 1.47 | 1.33 | 1.2 | 1.09 | 1.02 | 1.02 |
% of Variance | 16.19 | 12.52 | 9.64 | 7.76 | 6.98 | 6.34 | 5.75 | 5.39 | 5.37 |
Cumulative % | 16.19 | 28.71 | 38.35 | 46.11 | 53.09 | 59.43 | 65.18 | 70.58 | 75.94 |
Hierarchical clustering analysis (HCA)
The findings of R-mode groupings analysis were used to forecast physicochemical categories in groundwater data sets, and they are displayed in Fig. 3. Although the results of HCA and PCA are not exactly matched. However, there are some similarities within the current study. The parameters belonging to similar groups are to be expected to have originated from the same resource. The HCA shows two main groups of analyzed parameters. The physicochemical indices in cluster 1st (EC, TDS, and Salinity) are primarily governed by natural processes such as mineral dissolution and soil leaching, whereas the cluster 2nd exhibits a combination of natural and human processes. Including dissolution of carbonates and other minerals released from rocks like limestone, dolomite, and quartzite and carrying of trace earth elements and nitrification due to farming, improper disposal of lead lithium batteries, sewage effluents, and contaminant river percolation.
 | Figure 2: Scree plot showing Eigenvalues of PCA.
|
 | Figure 3: The hierarchical clusters of analyzed parameters shown by Dendrogram.
|
 | Figure 4: Map of U S Nagar District Uttarakhand showing WQI values of samples.
|
Demonstrates mixed natural and anthropogenic processes, including dissolution of carbonates and other minerals released from rocks like limestone, dolomite, and quartzite and transport of trace earth elements and nitrification due to agriculture, improper disposal of lead lithium batteries, sewage effluents, and contaminant river percolation.
 | Figure 5: Map of U S Nagar District Uttarakhand showing HPI values of samples.
|
Conclusions
We have done research to undertake the drinking Water quality analyses of the groundwater and the sources of contamination in Udham Singh Nagar district, Uttarakhand. We measured 19 parameters, and the Water quality index, HPI index; PCA / FA, and CA methods were applied. The exposed sediments of the Ganga Alluvium Plain during the late Pleistocene to Holocene represent the alluvial filling of sediments derived from the Himalayas and northern Indian Craton 42. The cations which were over the limit in groundwater samples are presented in chronological order Fe > Pb > Ni > Mg > Mn > Zn > Cu, and significant anions were over the limit F¯ > Cl¯, rest was under the limit. The study reveals that the results of HPI and WQI of groundwater in Uttarakhand are good to moderate for drinking purposes. The primary sources of Lead, Iron, Nickel and other heavy metals in this area are natural sources, Himalayan rocks with carbonated limestone, dolomite, quartzite, gneiss, meta-sedimentary rocks, which were eroded by rivers, springs and water table (below the surface) and then water was transported by rivers and underground seepages. The second source is anthropogenic activities like paints, automobile parts, batteries, sewage and industrial waste. This is because Udham Singh Nagar is a vast industrial district of Uttarakhand state. Thus, the wastage of industries is drained openly into water steams and other potable water sources. From the above results, the highly heavy metal-contaminated groundwater sample used for drinking is deteriorating. We conclude that regular monitoring of the hydro-chemical characteristics of the groundwater and using proper filtration treatment techniques will be helpful for sustainable water management so that we can avoid heavy metal contamination from groundwater in high-alert areas. It will be helpful for many hazardous diseases in that area.
Acknowledgments
The authors acknowledge the support provided by the Supervisor, NMHS project scientists and technical staff, our team during the study and Saurabh Gupta's support during the AAS analysis.
Conflict of Interest
The author(s) declare no conflict of interest.
Funding Sources
There is funding or financial support provided by the National Mission on Himalayan Studies (NMHS) project, project Id; NMHS/2018-19/SG65/20 for this particular research work.
References
- Singh K.P., Malik A., Mohan D., Sinha S. Multivariate statistical techniques for the evaluation of spatial and temporal variations in water quality of Gomti River, India, A case study. Water Research. 2004; 38: 3980–3992.
CrossRef - Singh S., Singh C., Kumar K., Gupta R., Mukherjee S. Spatial-temporal monitoring of groundwater using multivariate statistical techniques in Bareilly district of Uttar Pradesh, India. Journal of Hydrology and Hydromechanics. 2009; 1: 45–54.
CrossRef - Vega M., Pardo R., Barrado E., Deban L. Assessment of seasonal and polluting effects on the quality of river water by exploratory data analysis. Water Research Volume. 1998; 32: 3581–3592.
CrossRef - Kumar M., Ramanathan A. L., Ranjan S., Singh V. B., Kumar N., Yadav S. K., Rao M. S., Ritch, Bhattacharya P. Groundwater evolution and its utility in upper Ganges-Yamuna Alluvial plain of Northern India, India: Evidence from solute chemistry and stable isotopes. Groundwater for Sustainable Development. 2018; 7: 400–409.
CrossRef - Jain C. K., Bandhopadhyay A., Bhadra A. Assessment of groundwater quality for drinking purpose, district Nainital, Uttarakhand, India. Environmental Monitoring and Assessment. 2010; 166: 663–676.
CrossRef - Khanam Z., Singh S. Groundwater Quality Assessment near Polluted Canal Area in Kichha Town, Uttarakhand, India. International Journal of Recent Scientific Research. 2014; 5: 362-368.
- Singh S., Gautam P. K., Sarkar T., Taloor A. K. Characterization of the groundwater quality in Udham Singh Nagar of Kumaun Himalaya, Uttarakhand. Environmental Earth Sciences, 2022; 81(19).
CrossRef - CGWB Aquifer Mapping and Ground Water Management Plan Udham Singh Nagar District, Uttarakhand. Central Groundwater Board, Ministry of Water Resources, River Development and Ganga Rejuvenation Government of India. (2016).
- APHA Standard methods for the examination of water and wastewater, 20th edn. American Public Health Association, Washington, DC (2005).
- BIS (1991 / 1993 / 2003 / 2010/2017) IS 10500 -2012: Amendments: 1993, 2003, 2010 & 2017. Drinking Water Bureau of Indian Standards.
- WHO Guideline for drinking water quality, 4th edn. World Health Organization, Geneva, p 564. ISBN 978 92 4 154815 1, (2011).
- Hameed A., Abid H. S., Maulood B. K. Application of Water Quality Index for assessment of Dokan Lake Ecosystem, Kurdistan Region, Iraq. Journal of Water Resource and Protection. 2010; 2(9):792-798.
CrossRef - Sharma P., Meher P. K., Kumar A., Gautam Y. P., Mishra K. P. Changes in water quality index of Ganges river at different locations in Allahabad. Sustainability of Water Quality and Ecology. 2014; 3: 67-76.
CrossRef - Pathak B., Upadhyay R., Bakshi S., Bisht H., Kotlia B. S. Assessment of water quality of Nainital lake and surrounding springs using Water Quality Index (WQI) and Heavy Metal Pollution Index (HPI). Earth Science India. 2021; 14(1), pp. 28-40.
- Yadav A. K., Khan P., Sharma S. K. Water quality index assessment of groundwater in Todaraisingh Tehsil of Rajasthan State, India- A greener approach. Journal of Chemistry. 2010; 7(1): 428-432.
CrossRef - Ramakrishnaiah C. R., Sadashivaiah C., Ranganna G. Assessment of water quality index for the groundwater in Tumkur Taluk, Karnataka state, India. Journal of Chemistry 2009; 6(2): 523-530.
CrossRef - Horton R. K. An index number system for rating water quality. Journal of the Water Pollution Control Federation. 1965; 3: 300-305.
- Mohan S.V., Nithila P., Reddy S. J. Estimation of heavy metal in drinking water and development of heavy metal in drinking water and development of heavy metal pollution index. Journal of Environmental Science and Health. Part A: Environmental Science and Engineering and Toxicology. 1996; 31(2):283-289.
CrossRef - Prasad B., Bose J. M. Evaluation of the heavy metal pollution index for surface and spring water near a limestone mining area of the lower Himalayas. Environmental Geology. 2001; 41:183-188.
CrossRef - Nkansah K., Dawson-Andoh B., Slahor J. Rapid characterization of biomass using near infrared spectroscopy coupled with multivariate data analysis: part 1 yellow-poplar (Liriodendron tulipifera L.). Bioresour Technol. 2010; 101(2):4570–4576.
CrossRef - Chabukdhara M., Nema A. K. Assessment of heavy metal contamination in Hindon River sediments: a chemometric and geochemical approach. Chemosphere. 2012; 87: 945–953.
CrossRef - Helena B., Pardo R., Vega M., Barrado E., Fernandez J. M., Fernandez L. Temporal evolution of groundwater composition in an alluvial aquifer (Pisuerga River, Spain) by principal component analysis. Water Research. 2000; 34(3): 807–816.
CrossRef - Wunderlin D.A., Diaz M., Ame M. M. V., Pesce S. F., Hued A. C., Bistoni M. Pattern recognition techniques for the evaluation of spatial and temporal variations in water quality. A case study: Suquia River basin (Cordoba-Artgentina). Water Research. 2001; 35(12):2881–2894.
CrossRef - Heberger K., Milczewska K., Voelkel A. Principal Component analysis of polymer-solvent and filler-solvent interactions by inverse gas chromatography Colloids and Surfaces A: Physicochemical and Engineering Aspects. 2005; 260(1-3):29–37.
CrossRef - Sarbu C., Pop H. F. Principal component analysis versus fuzzy principal component analysis. A case study: the quality of Danube water (1985-1996). Talanta. 2005; 65(5):1215–1220.
CrossRef - Liu C. W., Lin K. H., Kuo Y. M. Application of factor analysis in the assessment of groundwater quality in a black foot disease area in Taiwan. Science of the Total Environment. 2003; 313(1-3):77–89.
CrossRef - Wagh V. M., Panaskar D. B., Mukate S. V., Gaikwad S. K., Muley A. A., Varade A. M. Health risk assessment of heavy metal contamination in groundwater of Kadava River Basin, Nashik, India. Modeling Earth Systems and Environment. 2018; 4(3): 969–980.
CrossRef - Rajappa B., Manjappa S., Puttaiah E.T. Monitoring of heavy metal concentration in groundwater of Hakinaka Taluk, India. Contemporary Engineering Sciences. 2010; 3(4): 183–190.
CrossRef - USCDC (United States Centre for Disease Control), Iron Overload and Hemochromalosis. Centre for Disease control. (2011).
- Duda-Chodak A, Blaszczyk U. The Impact of Nickel on Human Health. J. Elementol., 2008; 13(4): 685-696.
- Lenntech WT Chemical Properties, Health and Environmental Effects of Copper. Lenntech Water Treatment and Purification Holding BV, (2009).
- Ahmed J. B., Moumouni A., Musa S. S. Influence of abattoir wastes on groundwater quality in Keffi, North Central Nigeria. Journal of Environmental Science, Toxicology and Food Technology. 2016; 10: 35-42.
CrossRef - Watts D. L. The nutritional relationships of manganese. Journal of Orthomolecular Medicine. 1990; 5(4): 219–222.
- Homoncik S. C., MacDonald A. M., Heal K. V., Dochartaigh, B.´E.´O., Ngwenya, B.T. Manganese concentrations in Scottish groundwater. Science of the Total Environment. 2010; 408(12): 2467–2473.
CrossRef - Naseem S., Rafique T., Bashir E., Bhanger M. I., Laghari A., Usmani T. H. Lithological influences on the occurrence of high-fluoride groundwater in Nagar Parkar area, Thar Desert, Pakistan. Chemosphere, 2010; 78: 1313–1321.
CrossRef - Reddy A., Reddy D., Rao P., Prasad K. M. Hydrogeochemical characterization of fluoride-rich groundwater of Wailpalli watershed, Nalgonda District, Andhra Pradesh, India. Environmental Monitoring and Assessment, 2010; 171: 561–577.
CrossRef - Phan K., Sthiannopkao S., Kim K. W., Wong M. H., Sao V., Hashim J. H., Yasin M. S. M., Aljunid S. M. Health risk assessment of inorganic arsenic intake of Cambodia residents through groundwater drinking pathway. Water Research, 2010; 44(19): 5777–5788.
CrossRef - WHO Guideline for drinking water quality, 3rd edn. World Health Organization, Geneva, p 515. ISBN 92-4-154638-7, (2004).
- Gaur S., Singh N., Saxsena S. Status of Lead present in ground drinking water samples of Uttarakhand (Garhwal Region) in India. Asian journal of biomedical and pharmaceutical science. 2011; 1: 32-38.
- Bhuiyan M. A. H., Islam M. A., Dampare S. B., Parvez L., Suzukia S. Evaluation of hazardous metal pollution in irrigation and drinking water systems in the vicinity of a coal mine area of northwestern Bangladesh, Journal of Hazardous Materials. 2010; 179: 1065–1077.
CrossRef - Kim J. O., Mueller C. W. Introduction to factor analysis: what it is and how to do it. Quantitative Applications in the Social Sciences Series. Sage University Press, Newbury Park.07-013 Sage Publication. The international professional publisher Newbury Park London 1978;
- Singh I. B. Geological evolution of Ganga Plain – an overview. Journal of the Paleontological Society of India. 1996; 41: 99–137.


