Pesticide Application in Trinidadian Food Supply Chain: Food Safety and Sustainability Implications
G Kathiravan1
*
 and Brent Norris Georges2
1
Department of Animal Husbandry Statistics and Computer Applications,
Madras Veterinary College, Tamil Nadu Veterinary and Animal Sciences University,
Chennai,
Tamil Nadu
India
2
Department. of Agricultural Economics and Extension,
Faculty of Food and Agriculture, The University of the West Indies,
St. Augustine Campus,
Trinidad
http://dx.doi.org/10.12944/CWE.18.3.08
Copy the following to cite this article:
Kathiravan G, Georges B. N. Pesticide Application in Trinidadian Food Supply Chain: Food Safety and Sustainability Implications. Curr World Environ 2023;18(3). DOI:http://dx.doi.org/10.12944/CWE.18.3.08
Copy the following to cite this URL:
Kathiravan G, Georges B. N. Pesticide Application in Trinidadian Food Supply Chain: Food Safety and Sustainability Implications. Curr World Environ 2023;18(3).
Download article (pdf) Citation Manager Publish History

Introduction
Crop protection mechanisms, including the use of pesticides, are vital for safeguarding crops from organisms that affect their growth and development. Such mechanisms were advocated and profusely used during the era of green revolution to feed the growing population with limited arable land. This trend continues even today as a large portion of agricultural land being lost to commercial and residential development.
In agricultural practises, pesticides are frequently used to mitigate or avoid damage caused by pests, which eventually improves crop quality and yield—a consideration that is frequently important to customers.1,2 Globally, more than 1000 pesticides are used in agriculture, legally or illegally, for crop and soil treatment.3 It is worth noting that certain older, off-patent pesticides, such as DDT and lindane, have the ability to persist in soil and water for extended durations.4 It is imperative to note that about 24.5 million square kilometres, or 64% of agricultural land worldwide, is vulnerable to pesticide contamination from several active ingredients, with 31% of that area being at high risk.5
The benefits of pesticide use are accompanied by potentially harmful effects on human and environment. The hazardous effects of pesticides have exposed farmers to significant risks. Approximately 385 million unintentional acute pesticide poisoning incidences reported globally every year, resulting in approximately 11,000 fatalities. With an estimated worldwide farming population of around 860 million, this implies that approximately 44% of farmers experience pesticide poisoning annually.6 The potential toxicity and health hazards of pesticides were reported by many. Research by Ntow et al, and Gill and Garg have highlighted the short-term consequences of pesticide exposure,7,8 while numerous scholars have reported the long-term effects such as thyroid dysfunction, decreased sperm counts, congenital abnormalities, cancer, reproductive and immune system dysfunctions, hormonal issues, dermatitis and behavioural disorders.9–16
Those farmers involved directly in mixing and spraying pesticides are posed with health risks as they mishandle these chemicals.17–20 Further, short-term and long-term impacts of these harmful chemicals cause serious environmental degradation. The consumers too are at risk of pesticide exposure through residues on food commodities and drinking water sources.17–19 In addition, misuse of outdated pesticide containers for the storage of food and water, ill-maintained or inappropriate spraying equipment, improper storage procedures, and inaccurate application techniques can all harm people and the environment.21–23
Indiscriminate pesticide usage has led to a generalised of contamination of food commodities and the food supply chain, posing significant health hazards to consumers.24 Yen et al have reported that the farmers in Trinidad consistently used higher levels of pesticides to produce fruits and vegetables, locally.25 Also, farmers were found to apply pesticides beyond recommended levels by 40% and 100% on Cabbage and Tomato production, respectively.26 Although pesticides are effective in controlling pests and diseases, researchers were concerned over the presence of pesticide residues on the foods consumed.19,27,28
Food security encompasses the provision of an ample, secure, and wholesome food supply that caters to individuals' dietary requirements and desires.29 The widespread utilization of chemical fertilizers and pesticides is a necessity for feeding the ever-increasing global population, but their excessive use has emerged as a concerning factor affecting the quality and nutritional safety of our food supply.30
Besides the challenges posed by natural calamities such as droughts and floods, the farmers encounter damages due to pests and diseases to an estimated 45% of global fruit and vegetable production.4,31 Caribbean islands, with limited domestic production capacity and frequent hurricanes, floods, and droughts, face additional risks. Examining factors related to pesticide application can help develop a targeted approach to ensure secure food sources for developing populations. While the theory of planned behavior32 has made valuable contributions to pesticide use research,33–38 it is important to complement this approach with a holistic understanding of the broader context in which behaviors occur. By incorporating a more comprehensive perspective, researchers and policymakers can develop strategies that effectively address the complex challenges associated with pesticide use while considering the diverse factors that influence decision-making and behavior in this domain.
This study was carried to identify the determinants of pesticide applications in the food supply chain of Trinidad. By examining these factors, an all-inclusive approach can be developed to ensure food safety and sustainability. The results of this study would aid in evolving strategies for mitigating pesticides' risks, and promoting sustainable agriculture in Trinidad and regions similar.
Materials and Methods
The research was carried out in Trinidad, a Caribbean Island northeast of Venezuela, covering an area of 4,825 sq. km. Agricultural activity accounted for 16.71% of land usage, approximately 81,750 hectares, with a contribution of 1.02% to the GDP in 2004.39 Most farm plots were around 0.5 hectares in size and relied on rain-fed irrigation with an average annual rainfall of 2010.9 mm (CSO, Trinidad, 2004). Data was collected from 174 farmers in Trinidad, randomly selected from eight municipal counties. Data collection was conducted using a well-organized and pre-evaluated interview schedule.
The study employed the Ordered Probit Model to analyse determinants influencing pesticide utilization frequency among Trinidadian farmers. This model was chosen to overcome limitations of the linear probability model, which assumes constant fractional effects and fixed probabilities.40 The Ordered Probit analysis takes into consideration the ranked characteristics of response variables, representing farmers' preferences for pesticide application frequency. It treats the underlying response as a continuous latent variable with a normally distributed random error. In contrast, neither Probit not Multinomial Logit Models take into account the ordinal nature of the data, which in turn, necessitate the estimation of a greater number of parameters, and may exhibit undesirable characteristics such as the presence of the independence of irrelevant alternatives41 or the lack of a likelihood function in closed-form.42
Utility function or preference ordering of individual farmers was represented by their application ratings (R) on a scale of 0 to 3 (0-Never, 1-Rarely, 2-Sometimes, 3-Usually). These ratings were arrived at through a single-element vector (X) containing the socio-economic and demographic attributes of the survey participants (Table-1).
The STATA-14® programme was utilised to pursue the ordered probit model that was employed in this study. The model specification employed is as follows:
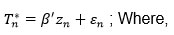
Tn* = unobservable and continuous measure of the respondent's preference,
Zn = an explanatory variable vector that characterises the respondent,
B = an estimate-relevant vector of parameters,
n = a stochastic disturbance term assumed to be distributed normally.
Tn* was derived from the model as below:
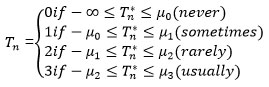
Where the represent the thresholds to be estimated.
Table 1: Descriptions of variables within the Ordered Probit (OP) model
Independent variable | Classification | Description | Predictor in model |
Gendera | Male; Female | 1 - If male; 0 – otherwise | X1 |
Age: 26–40 yearsb Age: 40– 60 yearsb Age > 60 yearsb | < 26; 26 – 40; 41 – 60; > 60 | 1 – If 26 – 40; 0 – otherwise | X2 |
1 – If 41- 60; 0 – otherwise | X3 | ||
1 – If - 60; 0 – otherwise | X4 | ||
Farming Experience: 5 – 10 yearsc Farming Experience: > 10 yearsc | < 5; 5 – 10; >10 | 1 – If 5 -10 years; 0 – otherwise | X5 |
1 – If > 10 years; 0 – otherwise | X6 | ||
Farm Size: 2.1 – 3.0 Acresd Farm Size: 3.1 – 5.0 Acresd Farm Size: > 5.0 Acresd | < 2.0; 2.1-3.0; 3.1-5.0; > 5 | 1 – If 1-2 acres; 0 – otherwise | X7 |
1 – If 3-5 acres; 0 – otherwise | X8 | ||
1 – If > 5 acres; 0 – otherwise | X9 | ||
Education: Secondarye Education: Collegiatee | Primary; Secondary; Collegiate; | 1 – If Secondary; 0 – otherwise | X10 |
1 – If Collegiate; 0 – otherwise | X11 | ||
Encountered Insects Problems | Yes; No | 1 – If yes; 0 – otherwise | X12 |
Encountered Disease Problems | Yes; No | 1 – If yes; 0 – otherwise | X13 |
Encountered Weeds Problems | Yes; No | 1 – If yes; 0 – otherwise | X14 |
Cultivates Solanaceae Crops | Yes; No | 1 – If yes; 0 – otherwise | X15 |
Cultivates Leafy Vegetables | Yes; No | 1 – If yes; 0 – otherwise | X16 |
Cultivates Root Crops | Yes; No | 1 – If yes; 0 – otherwise | X17 |
Cultivates Tree Crops | Yes; No | 1 – If yes; 0 – otherwise | X18 |
Reference categories: a – Female; b – Less than or equal to 26 Years; c – Less than 5 years; d – Less than or equal to 2 acres; e – Primary Education | |||
Dependent Variable: How often do you apply pesticides on your crops (R)? (0-Never; 1-Sometimes; 2-Rarely; 3-Usually) | |||
The likelihoods corresponding to the categorized responses in an Ordered Probit Model are as indicated below:
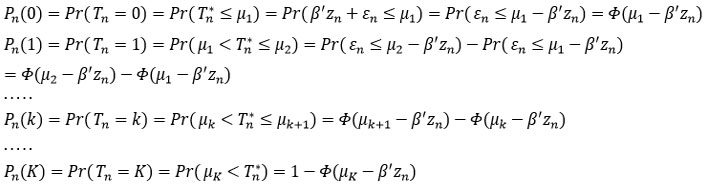
Where n represents respondent, k stands for his option, Pr( Tn = k ) denotes the likelihood of respondent n responding in a style k, and 0 (.) represents the cumulative distribution function for the standard normal distribution. The model's coefficient, B, provides the key insight that positive coefficients suggest a stronger preference as the related variable values increase, whereas negative coefficients suggest the reverse.
Results and Discussion
Results of Ordered Probit Model
The research employed the Ordered Probit (OP) analysis to examine the factors affecting pesticide application frequency. Demographic, socio-economic, and crop-related variables were included, and the outputs are presented in Table-2.
Table 2: Factors Influencing Pesticide Use Frequency: Ordered Probit Model.
Predictor | Regression coefficient | SE | Z value | P value |
| Gendera | 0.0797 | 0.2569 | 0.31 | 0.756 |
| Age: 26–40 yearsb | 0.0499 | 0.5682 | 0.09 | 0.930 |
| Age: 40– 60 yearsb | 0.2711 | 0.5778 | 0.47 | 0.639 |
| Age > 60 yearsb | 0.2133 | 0.6535 | 0.33 | 0.744 |
| Farming Experience: 5 – 10 yearsc | –0.8192* | 0.4196 | –1.95 | 0.051 |
| Farming Experience: > 10 yearsc | –0.9059** | 0.3862 | –2.35 | 0.019 |
| Farm Size: 2.1 – 3.0 Acresd | 0.6122 | 0.4416 | 1.39 | 0.166 |
| Farm Size: 3.1 – 5.0 Acresd | 0.7380** | 0.3603 | 2.05 | 0.041 |
| Farm Size: > 5.0 Acresd | 0.6888** | 0.3486 | 1.98 | 0.048 |
| Education: Secondarye | –0.4464** | 0.2005 | –2.23 | 0.026 |
| Education: Collegiatee | –1.0676*** | 0.3893 | –2.74 | 0.006 |
| Encountered Insects Problems | 0.2322 | 0.2058 | 1.13 | 0.259 |
| Encountered Disease Problems | 0.4591** | 0.1867 | 2.46 | 0.014 |
| Encountered Weeds Problems | –0.0038 | 0.0245 | –0.16 | 0.875 |
| Cultivates Solanaceae Crops | 0.5015** | 0.2049 | 2.45 | 0.014 |
| Cultivates Leafy Vegetables | 0.7404*** | 0.2178 | 3.40 | 0.001 |
| Cultivates Root Crops | –0.1816 | 0.2267 | –0.80 | 0.423 |
| Cultivates Tree Crops | 0.0797 | 0.2569 | 0.31 | 0.756 |
| Log likelihood | –196.2 |
|
|
|
| Number of observations | 174 |
|
|
|
| Model Chi – Square | 57.50 |
|
|
|
| chi2 (p value) | 0.000 |
|
|
|
| Pseudo R2 | 0.1278 |
|
|
|
| Reference categories: a – Female; b – Less than or equal to 26 Years; c – Less than 5 years; d – Less than or equal to 2 acres; e – Primary Education | ||||
| *Significance at 0.10 level; **Significance at 0.05 level; ***Significance at 0.01 level | ||||
| Values in brackets represent SE. | ||||
The model showed a good fit (log likelihood = -196.2) and the chi-square results (X² = 57.50, p = 0.000) indicated a significant relationship between the regressors and regresand. As expected, the Pseudo R2 values were lower in ordered probit models.
The results of OP model exhibited that the gender factor had no significant effect on farmers' choice of pesticide use frequency. This suggests that both male and female farmers have similar likelihoods of falling into the response categories of "Never," "Sometime," "Rarely," or "Usually" to apply pesticides during cultivation.
Similarly, the age categories (years): "26-40 " (p = 0.930), "40-60 " (p = 0.639), and "> 60 " (p = 0.744) have exhibited no significant influence on pesticide use frequency, compared to the reference category (age less than 26 years). The results implied that age may not significantly impact farmers' choice of pesticide application frequency.
While analyzing the effect of farming experience on farmers' response categories for pesticide application frequency, it was found that the farmers with 5-10 years of experience had slightly lower probability towards higher response categories (p = 0.051) and those with more than 10 years of experience had a significant negative probability (p = 0.019). These findings indicated that farming experience influenced response probabilities, with longer experience associated with lower probabilities of higher response categories in Trinidad. These results contradict the findings of Li et al and Pongvinyoo et al43,44 in other regions of the world, yet they imply that the experienced farmers would adopt a more sustainable pest controlling practices such as Integrated Pest Management.
The analysis to examine the influence of farm sizes on response categories of pesticide use frequency showed that those holding 2.1 - 3.0 acres did not have significant (p = 0.166) effect on response probabilities. However, those holding 3.1 - 5.0 acres (p = 0.041) and >5.0 acres (p = 0.048) had significantly favored higher response categories compared to the farmers with 2 acres or less. Aligning previous studies,43–47 this study also showed that larger farm sizes are connected to the higher response categories. The Large farms are skewed towards higher pesticide application frequencies might be due to their resource richness and scale economies.
OP analysis exhibited the significant influence of educational levels on farmers' pesticide application frequencies. Farmers with secondary education showed a significant negative probability (-0.4464, p = 0.026) towards higher response categories compared to those with primary education. Similarly, those with collegiate education displayed an even stronger effect, with a more significantly negative probability (-1.0676, p = 0.006) for higher response categories. These findings emphasized the significant positive association between education and pesticide impacts. Higher education levels enable farmers to make informed decisions on pesticide use, leading to the adoption of safer and sustainable practices. Hence, incorporating education as a key element while making interventions is vital for promoting a responsible pesticide application practices.
The OP analysis found no siginicant (0.2322, p = 0.259) association between the factors, ‘encountered insects problems” and response categories for pesticide use frequency, indicating that insect problems may not significantly influence farmers’ choice of pesticide use frequency. Similarly, the OP coefficient for “encountered weeds problems" was also not-significant (-0.0038, p = 0.875), indicated a negligible effect. However, the OP coefficient for the farmers “encountered disease problems" in their crops was statistically significant (0.4591, p = 0.014), indicated that the farmers who encountered crop diseases chosen to apply pesticides more frequently. The findings exhibited the importance of addressing the challenges of diseases and warrants for strategies to promote effective disease management, to minimize pesticide use in agricultural production.
The results of OP analysis for farmers’ cultivating different crop varieties showed a significance (0.5015, p = 0.014) for those “cultivating solanaceae crops, indicating their propensity towards higher pesticide application frequencies. Correspondingly, the farmers “cultivating leafy vegetables" exhibited strong significant positive probabilities (0.7404, p = 0.001), indicated their potential inclination for frequent pesticide use. Contrastingly, both farmers “cultivating root crops" (-0.1816, p = 0.423) and those “cultivating tree crops” had a negligible effect, on pesticide use frequency. In summary, cultivating Solanaceae crops and leafy vegetables is associated with higher pesticide application, while cultivating root crops and tree crops have minimal impact on pesticide use frequency.
Marginal Effects of Ordered Probit Model
The Ordered Probit model's nonlinearity prevents direct insights into estimated variables. To improve interpretability, researchers calculated marginal effects and predicted probabilities based on the model's results. Table 3 presents these findings, offering a comprehensive overview of marginal effects and predicted probabilities.
The analysis found no significant gender effects on pesticide application probabilities across different categories. The coefficient for the "Never" category suggested a small negative effect for males, but it was not statistically significant. Additionally, no significant gender effects were observed for the probabilities of "Sometime," "Rarely," and "Usually" pesticide application. Thus, gender alone does not have a substantial impact on pesticide application probabilities in these categories.
Age groups (26-40, 40-60, and >60) did not significantly affect pesticide application probabilities across categories compared to farmers aged <26 years. The coefficients for these age groups showed no significant association with pesticide application (frequency) probabilities. Therefore, age alone does not significantly influence farmers' pesticide use behavior. Contrastingly, the farmers with 5-10 years of experience had a different pesticide application behavior vis-à-vis those with less than 5 years of experience. They had a significantly higher likelihood (0.3156, SE = 0.1481) of never applying pesticides, suggesting a shift towards alternative farming practices such as integrated pest management strategies. However, when examining probabilities for "Sometime", "Rarely", and "Usually", farmers with 5-10 years of experience exhibited significantly lower probabilities. This suggests they are less likely to use pesticides occasionally, rarely, or regularly compared to farmers with less than 5 years of experience. The results vividly demonstrated that the experienced farmers might apply pesticides judiciously, on need basis. The findings indicated that the experience enabled the farmers to gain more knowledge, which culminated them adapting sustainable pest management practices.
Table 3: Marginal Effects and Predicted Probabilities of Ordered Probit (OP) Model
Predictor | Pr (Never=0) | Pr (Sometime=1) | Pr (Rarely=2) | Pr (Usually=3) |
| Gendera | –.0314 (.1019) | .0026 (.0099) | .0125 (.0410) | .0164 (.0512) |
| Age: 26–40 yearsb | –.0194 (.2233) | .0012 (.0128) | .0076 (.0874) | .0106 (.1233 ) |
| Age: 40– 60 yearsb | –.1064 (.2276) | .0081 (.0203) | .0421 (.0903) | .0562 (.1182) |
| Age > 60 yearsb | –.0818 (.248) | .0016 (.0084) | .0308 (.0880) | .0494 (.1674) |
| Farming Experience: 5 – 10 yearsc | .3156** (.1481) | –.0606 (.0476) | –.1295** (.0637) | –.1255*** (.047) |
| Farming Experience: > 10 yearsc | .3257*** (.1204) | .1858 (.0285) | –.1039*** (.033) | –.2403** (.1212) |
| Farm Size: 2.1 – 3.0 Acresd | –.2218 (.1401) | –.0158 (.0351) | .0716** (.0333) | .1660 (.1446) |
| Farm Size: 3.1 – 5.0 Acresd | –.2778** (.1276) | .002 (.0157) | .9999** (.0438) | .1760* (.0966) |
| Farm Size: > 5.0 Acresd | –.2648** (.1303) | .0139 (.0142) | .1005** (.0499) | .1504* (.0809) |
| Education: Secondarye | .1739** (.0767) | –.0098 (.0096) | –.0672** (.0315) | –.0968** (.0454) |
| Education: Collegiatee | .3916*** (.1153) | –.0992* (.0529) | –.1603*** (.0508) | –.1321*** (.0312) |
| Encountered Insects Problems | –.0918 (.0814) | .0081 (.0103) | .0367 (.0336) | .0469 (.0398) |
| Encountered Disease Problems | –.1785** (.0712) | .0093 (.0097) | .0688** (.0292) | .1005** (.0432) |
| Encountered Weeds Problems | .0015 (.0097) | –.0001 (.0006) | –.0006 (.0038) | –.0008 (.0052) |
| Cultivates Solanaceae Crops | –.1974** (.0798) | .0198 (.0149) | .0788** (.0347) | .9871** (.0389) |
| Cultivates Leafy Vegetables | –.2727*** (.0724) | –.0095 (.0179) | .0924*** (.0272) | .1899*** (.0660) |
| Cultivates Root Crops | .0718 (.0901) | –.0065 (.0109) | –.0288 (.0369) | –.0365 (.0435) |
| Cultivates Tree Crops | .0031 (.154) | .0002 (.0097) | .0012 (.0605) | .0017 (.0837) |
| Predicted probability | .4373 | .2197 | .2124 | .1306 |
| Reference categories: a – Female; b – Less than or equal to 26 Years; c – Less than 5 years; d – Less than or equal to 2 acres; e – Primary Education | ||||
| *Significance at 0.10 level **Significance at 0.05 level ***Significance at 0.01 level | ||||
| Values in brackets represent SE. | ||||
Pesticide use behavior varied with farm holding sizes. Smaller farms (2.1-3.0 acres) had more likelihood of using pesticides rarely, but not regularly. However, farm sizes with more than 3.0 acres had exhibited a tendency to apply pesticides usually, while clearly showing a negative probability for using 'never'. The results implied that the large farms had sufficient resources to procure and apply pesticides regularly to avoid pest pressure, leading to greater reliance on pesticides.
The marginal effects of OP analysis showed that the education had significant impact farmers' pesticide use behavior. Compared to those farmers had primary education alone, those had higher levels of education (both secondary and collegiate) had exhibited a tendency to never apply pesticides, while significantly avoiding the regular use of pesticides. The results of the study exhibited the imperativeness of education in the process of implementing sustainable farming practices.48,49 This aligns with previous research findings that emphasized the importance of education in promoting safe pesticide use.50–53
The analysis of OP marginal probabilities reiterated that insect and weed problems had no significant effects on pesticide application frequencies, while, encountering disease problems had a significant negative tendency for never applying pesticides (-0.1785, SE = 0.0712). Farmers facing diseases were less likely to abstain from pesticide use. Farmers dealing with diseases were more inclined to apply pesticides on higher order categories. These findings showed that the disease problems were pressing the farmers to use pesticides on regular basis. Insect problems do not significantly affect pesticide application, while disease issues had a notable influence.
Cultivating Solanaceae crops had shown a significant negative tendency on never applying pesticides (-0.1974, SE = 0.0798), and more significantly positive attitude on occasional, rare, and regular use of pesticides indicated that the farmers faced frequent disease threats in their Solanaceae crops. Similarly, cultivating leafy vegetables had a significant negative effect on never applying pesticides (-0.2727, SE = 0.0724), indicating farmers in this category were less likely to abstain from pesticide use. Also, the significant positive probabilities on occasional, rare, and regular pesticide application frequencies suggested a higher inclination for pesticide use among leafy vegetable farmers. However, cultivating root crops or tree crops did not have statistically significant effects on pesticide application probabilities. This suggested that cultivating root crops or tree crops alone did not strongly influence pesticide application behavior. Therefore, Solanaceae and leafy vegetable cultivations were associated with higher pesticide use, while cultivating root crops or tree crops had a limited impact. The results implied that the type of crop cultivated should be taken into account, while planning for any intervention to promote sustainable agricultural practices.
Conclusion
The Ordered Probit Model has provided insight into the factors that influence farmers' decisions regarding the use of pesticides in the Trinidadian food supply chain. Gender and age did not have a significant effect on the frequency of pesticide use, emphasizing the need for more comprehensive and diversified approaches to ensure food security and sustainability. However, farm size and experience did have an impact, as larger farms and more experienced farmers demonstrated distinct pesticide application behaviours. Also, education, particularly at secondary and college levels, was found to be a major factor in reducing pesticide application frequency, which is in line with sustainability objectives. Furthermore, crop-specific trends, such as an increased use of pesticides with Solanaceae or leafy vegetables, highlight the need for tailored interventions to promote food safety and sustainably. Although the impact of insect and weed issues was minimal, however, the management of disease-related issues remains an important factor in reducing pesticide use. The overall conclusion of the study is that multi-disciplinary interventions that take into account the size of the farm, experience, training, and crop types should be aimed at to encourage the sustainable application of pesticides in agriculture, thus promoting food safety and the long-term sustainability of the Trinidadian food supply chain.
Acknowledgements
Authors would like to acknowledge Dr. Isabelle Grandison, Lecturer, The UWI, Trinidad and International Development Research Centre (IDRC), Canada for their support during data collection.
Conflict of Interest
The author(s) don’t have any conflict of interest in article of research “Pesticide Application in Trinidadian Food Supply Chain: Food Safety and Sustainability Implications”
Funding Sources
The author(s) received no financial support for the research, authorship, and/or publication of this article.
References
- Oerke EC, Dehne HW. Safeguarding production—losses in major crops and the role of crop protection. Crop Prot. 2004;23(4):275-285. doi:10.1016/j.cropro.2003.10.001
- Cooper J, Dobson H. The benefits of pesticides to mankind and the environment. Crop Prot. 2007;26(9):1337-1348. doi:10.1016/j.cropro.2007.03.022
- WHO. Pesticide residues in food. Published 2022. Accessed October 26, 2023. https://www.who.int/news-room/fact-sheets/detail/pesticide-residues-in-food
- Shipitalo MJ, Malone RW, Owens LB. Impact of Glyphosate?Tolerant Soybean and Glufosinate?Tolerant Corn Production on Herbicide Losses in Surface Runoff. J Environ Qual. 2008;37(2):401-408. doi:10.2134/jeq2006.0540
- Tang FHM, Lenzen M, McBratney A, Maggi F. Risk of pesticide pollution at the global scale. Nat Geosci. 2021;14(4):206-210. doi:10.1038/s41561-021-00712-5
- Boedeker W, Watts M, Clausing P, Marquez E. The global distribution of acute unintentional pesticide poisoning: estimations based on a systematic review. BMC Public Health. 2020;20(1):1875. doi:10.1186/s12889-020-09939-0
- Ntow WJ, Gijzen HJ, Kelderman P, Drechsel P. Farmer perceptions and pesticide use practices in vegetable production in Ghana. Pest Manag Sci. 2006;62(4):356-365. doi:10.1002/ps.1178
- Gill HK, Garg H. Pesticides: Environmental Impacts and Management Strategies. In: Pesticides - Toxic Aspects. InTech; 2014. doi:10.5772/57399
- Mesnage R, Clair E, Spiroux de Vendomois J, Seralini GE. Two cases of birth defects overlapping Stratton-Parker syndrome after multiple pesticide exposure. Occup Environ Med. 2010;67(5):359-359. doi:10.1136/oem.2009.052969
- Tanner CM, Kamel F, Ross GW, et al. Rotenone, Paraquat, and Parkinson’s Disease. Environ Health Perspect. 2011;119(6):866-872. doi:10.1289/ehp.1002839
- Cocco P, Satta G, Dubois S, et al. Lymphoma risk and occupational exposure to pesticides: results of the Epilymph study. Occup Environ Med. 2013;70(2):91-98. doi:10.1136/oemed-2012-100845
- Bonner MR, Alavanja MCR. Pesticides, human health, and food security. Food Energy Secur. 2017;6(3):89-93. doi:10.1002/fes3.112
- Kim KH, Kabir E, Jahan SA. Exposure to pesticides and the associated human health effects. Sci Total Environ. 2017;575:525-535. doi:10.1016/j.scitotenv.2016.09.009
- Akter M, Fan L, Rahman MM, Geissen V, Ritsema CJ. Vegetable farmers’ behaviour and knowledge related to pesticide use and related health problems: A case study from Bangladesh. J Clean Prod. 2018;200:122-133. doi:10.1016/j.jclepro.2018.07.130
- Jørs E, Neupane D, London L. Pesticide Poisonings in Low- and Middle-Income Countries. Environ Health Insights. 2018;12:117863021775087. doi:10.1177/1178630217750876
- Karunarathne A, Gunnell D, Konradsen F, Eddleston M. How many premature deaths from pesticide suicide have occurred since the agricultural Green Revolution? Clin Toxicol. 2020;58(4):227-232. doi:10.1080/15563650.2019.1662433
- van der Werf HMG. Assessing the impact of pesticides on the environment. Agric Ecosyst Environ. 1996;60(2-3):81-96. doi:10.1016/S0167-8809(96)01096-1
- Wilson C, Tisdell C. Why farmers continue to use pesticides despite environmental, health and sustainability costs. Ecol Econ. 2001;39(3):449-462. doi:10.1016/S0921-8009(01)00238-5
- Maroni M, Fanetti AC, Metruccio F. Risk assessment and management of occupational exposure to pesticides in agriculture. Med Lav. 2006;97(2):430-437.
- Saeedi Saravi SS, Shokrzadeh M. Role of Pesticides in Human Life in the Modern Age: A Review. In: Pesticides in the Modern World - Risks and Benefits. InTech; 2011. doi:10.5772/18827
- Ecobichon DJ. Pesticide use in developing countries. Toxicology. 2001;160(1-3):27-33. doi:10.1016/S0300-483X(00)00452-2
- Asogwa EU, Dongo LN. Problems associated with pesticide usage and application in Nigerian cocoa production: A review. African J Biotechnol. 2009;8(25):7263-7270.
- Damalas CA, Eleftherohorinos IG. Pesticide Exposure, Safety Issues, and Risk Assessment Indicators. Int J Environ Res Public Health. 2011;8(5):1402-1419. doi:10.3390/ijerph8051402
- Gupta P. Pesticide exposure—Indian scene. Toxicology. 2004;198(1-3):83-90. doi:10.1016/j.tox.2004.01.021
- Yen IC, Bekele I, Kalloo C. Use patterns and residual levels of organophosphate pesticides on vegetables in Trinidad, West Indies. J AOAC Int. 1999;82(4):991-995.
- Kathiravan G, Duraisamy S, Chowdhury A, Ganpat W. Determinants of Willingness-to-Pay A Premium Price for Integrated Pest Management Produced Fruits and Vegetables in Trinidad. Agro Ekon. 2020;31(1). doi:10.22146/ae.58213
- Narenderan ST, Meyyanathan SN, Babu B. Review of pesticide residue analysis in fruits and vegetables. Pre-treatment, extraction and detection techniques. Food Res Int. 2020;133:109141. doi:10.1016/j.foodres.2020.109141
- Wahab S, Muzammil K, Nasir N, et al. Advancement and New Trends in Analysis of Pesticide Residues in Food: A Comprehensive Review. Plants. 2022;11(9):1106. doi:10.3390/plants11091106
- Dilley M, Boudreau TE. Coming to terms with vulnerability: a critique of the food security definition. Food Policy. 2001;26(3):229-247. doi:10.1016/S0306-9192(00)00046-4
- Aktar W, Sengupta D, Chowdhury A. Impact of pesticides use in agriculture: their benefits and hazards. Interdiscip Toxicol. 2009;2(1):1-12. doi:10.2478/v10102-009-0001-7
- Bhanti M, Taneja A. Contamination of vegetables of different seasons with organophosphorous pesticides and related health risk assessment in northern India. Chemosphere. 2007;69(1):63-68. doi:10.1016/j.chemosphere.2007.04.071
- Ajzen I. The theory of planned behavior. Organ Behav Hum Decis Process. 1991;50(2):179-211. doi:10.1016/0749-5978(91)90020-T
- Bond J, Kriesemer S, Emborg J, Chadha M. Understanding farmers’ pesticide use in Jharkhand India. Ext farming Syst J. 2009;5:53-62.
- Rezaei R, Safa L, Damalas CA, Ganjkhanloo MM. Drivers of farmers’ intention to use integrated pest management: Integrating theory of planned behavior and norm activation model. J Environ Manage. 2019;236:328-339. doi:10.1016/j.jenvman.2019.01.097
- Bagheri A, Emami N, Damalas CA. Farmers’ behavior towards safe pesticide handling: An analysis with the theory of planned behavior. Sci Total Environ. 2021;751:141709. doi:10.1016/j.scitotenv.2020.141709
- Tinh L, Que ND, Hien NH, Le DT, Manh Trung VH. Combining the Theory of Planned Behavior, The Expected Utility Theory, and Diffusion of Innovation Theory to Analyze Factors Affecting Farmers’ Intention to Use Pesticides: The Case Study of Quang Nam Province in Vietnam. Int J Agric Technol. 2021;1(1):1-7. doi:10.33425/2770-2928.1007
- Sarma PK. Farmer behavior towards pesticide use for reduction production risk: A Theory of Planned Behavior. Clean Circ Bioeconomy. 2022;1:100002. doi:10.1016/j.clcb.2021.100002
- Damalas CA, Koutroubas SD, Abdollahzadeh G. Herbicide use in conventional cereal production in northern Greece: An appraisal through the theory of planned behavior. Pest Manag Sci. 2022;78(11):4668-4678. doi:10.1002/ps.7087
- Navarro Villa P. Share of value added by the agricultural sector to the gross domestic product (GDP) in Trinidad and Tobago from 2011 to 2020. Published 2023. Accessed October 26, 2023. https://www.statista.com/statistics/1078958/trinidad-tobago-agriculture-share-gdp/
- Priyadharsini S, Kathiravan G, Thirunavukkarasu M, Ganpat W, Saravanakumar D. Ordered Probit Analysis of Consumers Preferences for Milk and Meat Quality Attributes in the Emerging Cities of Southern India. Expert J Mark. 2017;5(2):37-43.
- Moshe Ben-Akiva, Lerman SR. Discrete Choice Analysis: Theory and Application to Travel Demand. The MIT Press; 2018.
- Greene WH. Econometric Analysis. Eigth. Pearson; 2017. doi:10.1007/978-3-030-56239-7_5
- Li J, Lammerts van Bueren ET, Jiggins J, Leeuwis C. Farmers’ adoption of maize (Zea mays L.) hybrids and the persistence of landraces in Southwest China: implications for policy and breeding. Genet Resour Crop Evol. 2012;59(6):1147-1160. doi:10.1007/s10722-011-9750-1
- Pongvinyoo P, Yamao M, Hosono K. Cost Efficiency of Thai National GAP (QGAP) and Mangosteen Farmers’ Understanding in Chanthaburi Province. Am J Rural Dev. 2015;3(2):15-23. doi:10.12691/ajrd-3-2-1
- Salameh PR, Baldi I, Brochard P, Saleh BA. Pesticides in Lebanon: a knowledge, attitude, and practice study. Environ Res. 2004;94(1):1-6. doi:10.1016/S0013-9351(03)00092-6
- Damalas CA, Theodorou MG, Georgiou EB. Attitudes towards pesticide labelling among Greek tobacco farmers. Int J Pest Manag. 2006;52(4):269-274. doi:10.1080/09670870600792101
- Rama Rao CA, Srinivasa Rao M, Naraiah P, Malathi B, Reddy YVR, Malathi B. An economic analysis of adoption of integrated pest management in groundnut. Indian J Agric Econ. 2008;63(1):97-107.
- Luo L, Qiao D, Zhang R, Luo C, Fu X, Liu Y. Research on the Influence of Education of Farmers’ Cooperatives on the Adoption of Green Prevention and Control Technologies by Members: Evidence from Rural China. Int J Environ Res Public Health. 2022;19(10):6255. doi:10.3390/ijerph19106255
- Lelamo S, Ashenafi T, Ejeso A, Soboksa NE, Negassa B, Aregu MB. Pesticide Use Practice and Associated Factors Among Rural Community of Malga District, Sidama Regional State, South Ethiopia. Environ Health Insights. 2023;17:117863022311572. doi:10.1177/11786302231157226
- Hurtig AK, Sebastián MS, Soto A, Shingre A, Zambrano D, Guerrero W. Pesticide Use among Farmers in the Amazon Basin of Ecuador. Arch Environ Heal An Int J. 2003;58(4):223-228. doi:10.3200/AEOH.58.4.223-228
- Yang X, Wang F, Meng L, et al. Farmer and retailer knowledge and awareness of the risks from pesticide use: A case study in the Wei River catchment, China. Sci Total Environ. 2014;497-498:172-179. doi:10.1016/j.scitotenv.2014.07.118
- Aldosari F, Mubushar M, Baig MB. Assessment of farmers knowledge on pesticides and trainings on pesticide waste management in Central Punjab – Pakistan. J Exp Biol Agric Sci. 2018;6(1):168-175. doi:10.18006/2018.6(1).168.175
- Sumudumali RGI, Jayawardana JMCK, Piyathilake IDUH, et al. What drives the pesticide user practices among farmers in tropical regions? A case study in Sri Lanka. Environ Monit Assess. 2021;193(12):860. doi:10.1007/s10661-021-09611-z


