Physico-Chemical Characteristics of the River Kulik of the Uttar Dinajpur District of West Bengal, India
Jayanta Majumder
 and Debashri Mondal
*
and Debashri Mondal
*
1
Department of Zoology,
Raiganj University, Raiganj,
Uttar Dinajpur,
India
http://dx.doi.org/10.12944/CWE.18.3.29
Copy the following to cite this article:
Majumder J, Mondal D. Physico-Chemical Characteristics of the River Kulik of the Uttar Dinajpur District of West Bengal, India. Curr World Environ 2023;18(3). DOI:http://dx.doi.org/10.12944/CWE.18.3.29
Copy the following to cite this URL:
Majumder J, Mondal D. Physico-Chemical Characteristics of the River Kulik of the Uttar Dinajpur District of West Bengal, India. Curr World Environ 2023;18(3).
Download article (pdf) Citation Manager Publish History

Introduction
Water is considered one of the most important of all the natural resources present on earth. It is essential for most ecological systems, all living organisms, food production, human health, and economic development.1 Water is one of the principal natural resources for the survival of mankind and is abundant in the ecosystem. 2 Nature contains water in a variety of forms, including lakes, rivers, oceans, clouds, rain, and fog. Nevertheless, in nature, chemically pure water does not remain for very long. Presently, our planet is highly polluted due to industrialization, increased human population, indiscriminate use of fertilizers in agricultural fields, and different anthropogenic activities. 3 Farmers focus on cost-effective water, nutrients, and organic matter sources, neglecting harmful effects like chemical contamination and health issues in agriculture.
The river Kulik is a Bangladesh-India inter-border river that flows through Uttar Dinajpur, West Bengal, India. Kulik which is a short and narrow stream, comes from a marsh in Raipur, Baliadangi upazila, Thakurgaon district, Bangladesh. The Kulik acts as the India-Bangladesh border for a short distance from Haripur upazila before crossing into India. It enters the Uttar Dinajpur district of West Bengal from the south and weaves its way southwest through the lively city of Raiganj to join the Nagar, where fishing is done on a regular basis. 4 On the banks of the river Kulik, different crops like paddy, mustard, jute, and wheat are cultivated throughout the year, depending totally on the irrigation water of the river Kulik. Even the water of the river Kulik is consumed by the tribal inhabitants of Sherpur. Although the river is the heart of Uttar Dinajpur District, West Bengal; it’s water becomes gradually polluted day by day due to different anthropogenic activities like bathing of both humans and cattle, washing linens and utensils, and disposing of different solid wastes in the water of the river.
The physicochemical properties of the water of the Mouri river in Khulna, Bangladesh, were studied by Kamal et al. 5 Pal et al. and Pal and Talukdar examined the hydro-ecological changes related to damming across the rivers Tangon, Ganga-Padma, and Atreyee in India and Bangladesh. 6,7 Different water quality parameters of the river Tangon were also investigated in Bangladesh by Roy et al.
In India, many workers studied the physico-chemical properties of different water bodies. 9,10,11,12 In West Bengal, Acharjee and Barat conducted research on the spatiotemporal dynamics of physical and chemical elements in the river Relli in the Darjeeling Himalaya. 13 The identity crisis in habitat caused by the squeezing of the riparian wetland in the Tangon river basin in the Barind region of India was studied by Chakraborty. 14 In the Radhikapur village of the Uttar Dinajpur district, the water quality parameters of the Tangon River were studied by Mondal and Sarkar.15
Although the river Kulik is very important for the local inhabitants of the Uttar Dinajpur district of West Bengal, till date no information has been available on the physico-chemical characteristics of the river Kulik as well as the present pollution status of the river.
Consequently, to understand the present status of pollution in the river, the primary objective of current research was aimed to investigate various physico-chemical characteristics of the river Kulik at the chosen locations in the district of Uttar Dinajpur, West Bengal, India.
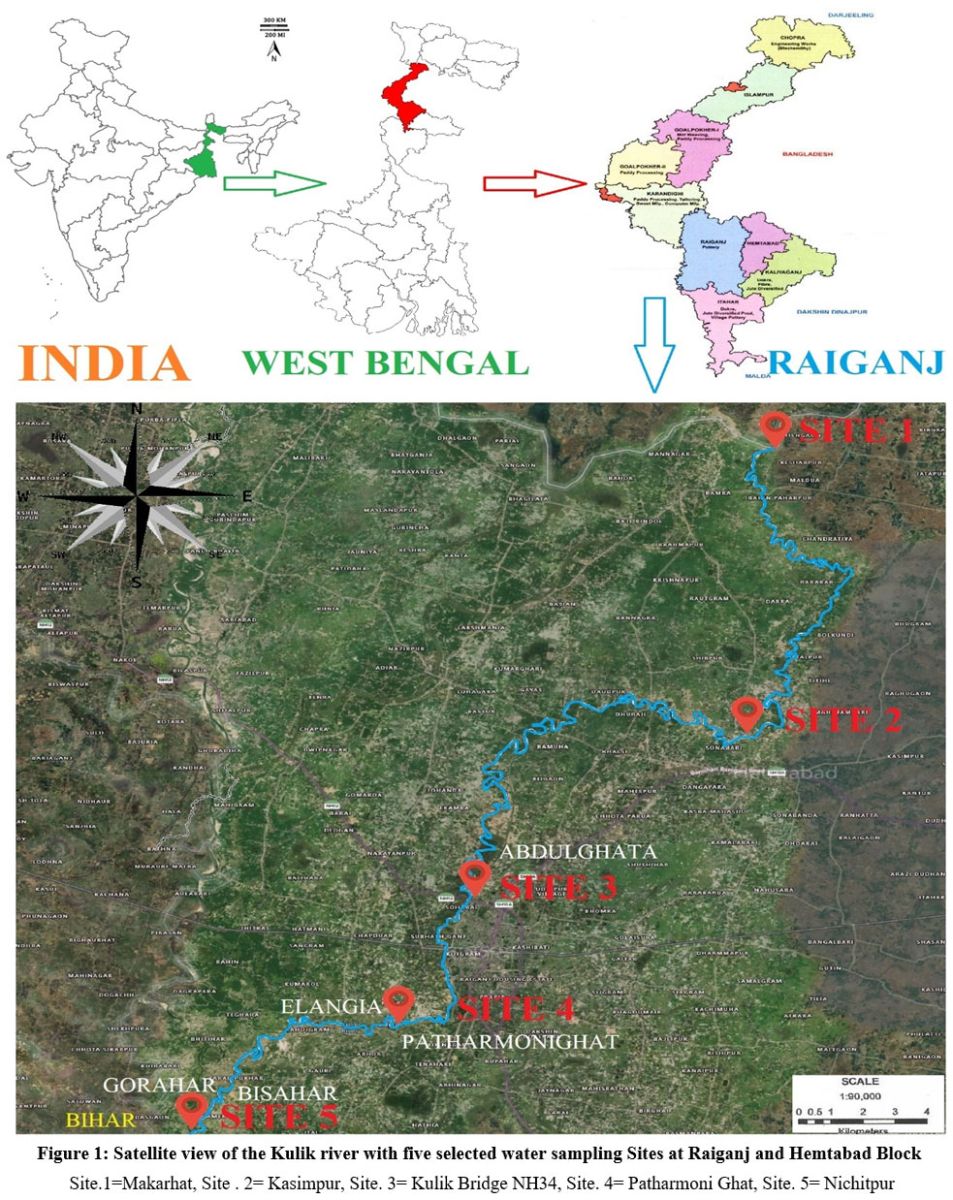
Study Area
For the present investigation, five sampling sites were chosen based on the length of the river and the point and non-point sources of pollution to study the ichthyofauna diversity of the Kulik river in Uttar Dinajpur district, West Bengal (Table 1).
Table 1: Brief descriptions of the five sampling sites of the river Kulik
Sites | Location | Brief Description |
Site 1 (MAKARHAT) | Lat 25.810152
| This site is located in Makarhat, which is on the border of Bangladesh and India. At this site, the Kulik River of Bangladesh enters India (Fig. 1). The water level is quite low at this site. One military camp is present near the site to control the mobility of people from both countries. The human population is lower at this site. Only some agricultural fields and different plants are present near the site. Fishing is done at this site. |
Site 2 (KASIMPUR) | Lat 25.690178
| This site is situated below the Kasimpur bridge of Bindole Thakurbari Road, which is the connector between Raiganj and Hemtabad blocks. This road extends up to the Bangladesh border (Fig. 1). Some tribal people reside near the site. Local people used to capture fish at this site. They use the water of the Kulik for different purposes, like cleaning utensils, clothes, washing pets and animals, and bathing. |
Site 3 (KULIK BRIDGE NH34) | Lat 25.620319 Long 88.115684 | This site is located under the Kulik Bridge, which is a part of the National Highway (NH34). It is very near the Kulik Wildlife Sanctuary. The river Kulik is connected to the sanctuary by a system of man-made canals. The water of the river flows into the sanctuary during monsoons, providing a variety of food for the birds, especially the Asian Openbill Stork, which eats mostly apple snails from the river Kulik. (Fig. 1). Under the bridge, many festivals and village fairs are celebrated by the villagers. Agricultural fields are also present, where seasonal crops are cultivated. Boating is one of the main attractions of this site. During the winter, this site is used for picnic purposes. Fishing and bathing are also done at this site. |
Site 4 (PATHARMONI GHAT) | Lat 25.595078 Long 88.114579 | This site is situated about 250 meters away from the bypass of NH 34. Through this road, Bihar is connected with Raiganj. Most of the fish of the Kulik River are collected from this site. There are plenty of fish available at this site, and fishing is done here regularly due to the presence of the river buck. The water at this site is used mainly for domestic purposes, especially for bathing pet animals. |
Site 5 (NICHITPUR) | Lat 25.558380 Long 88.041977 | This site is located in Nichitpur, which is also a link between Bengal and Bihar. This is the outlet of the Kulik River where it meets the river Nagar (Fig. 1). This site is very important for the villagers of the border area of Raiganj and Bihar. Fishing is the main profession of the villagers. |
 | Figure 1: Satellite view of the Kulik river with five selected water sampling Sites at Raiganj and Hemtabad Block.
|
Methodology
Over the course of two years, from November 2019 to October 2021, various physico-chemical parameters of the river Kulik in the Uttar Dinajpur district were investigated. Every month, between the hours of 6 and 10 a.m., water samples were taken from the five designated sampling locations along the river. The air and water temperatures, pH, and transparency were recorded in the field with the help of an ACETEQ digital Celsius thermometer (Model KT-908) with an external sensing probe. The hydrogen Ion concentrations (pH) of water were determined with the help of a portable pH meter (Model-HI96107, HANNA Instrument, Italy). A Secchi disc was used to gauge the transparency and depth of the water following Boyd. 16 The BOD samples were placed in the BOD incubator and incubated for five days at 20°C [O-CIS-6(D)] in the laboratory of Department of Zoology, Raiganj University. For the other physico-chemical factors like DO, Free CO2, Total Alkalinity (TA), Total Hardness (TH), Total Chloride (TC), water samples were collected and brought to the laboratory in plastic bottles (1500 mL) and analysed as early as possible following APHA. 17The values were compared with the standard values of WHO and CPCB.18, 19
Statistical Analysis Correlation and ANOVA was also done with the help of Microsoft Excel [Microsoft 365 (16.0.15601.20148)].
Results
In Figs. 2 to 15, the monthly fluctuations of several physico-chemical parameters of water at Sites 1, 2, 3, 4, and 5 throughout the course of the entire study period are shown.
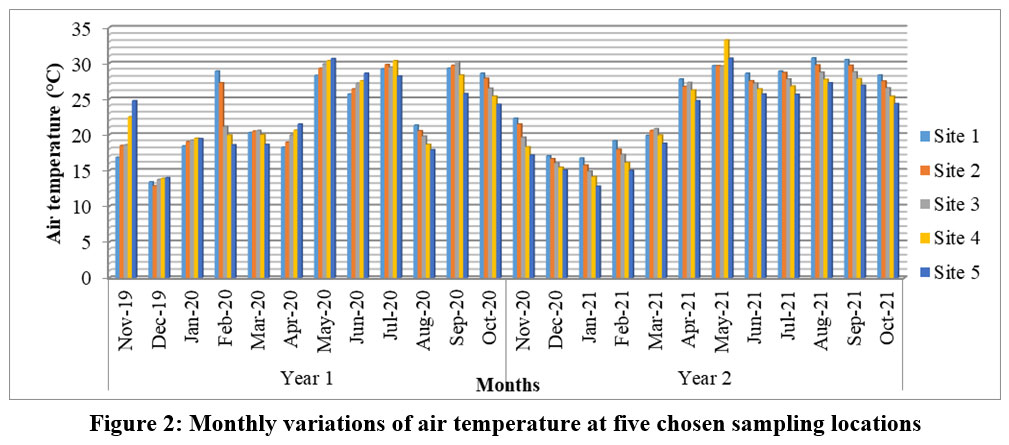 | Figure 2: Monthly variations of air temperature at five chosen sampling locations.
|
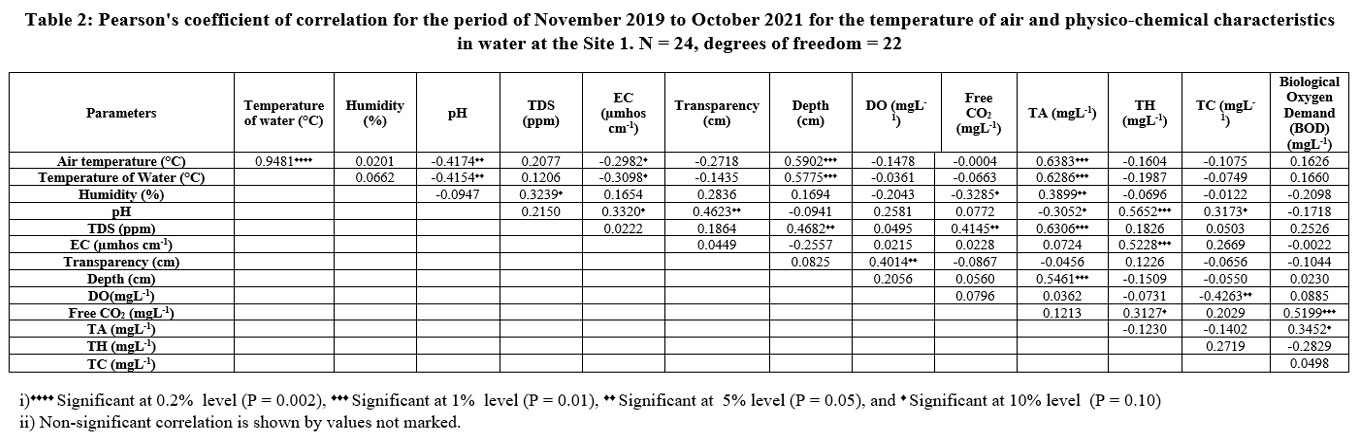
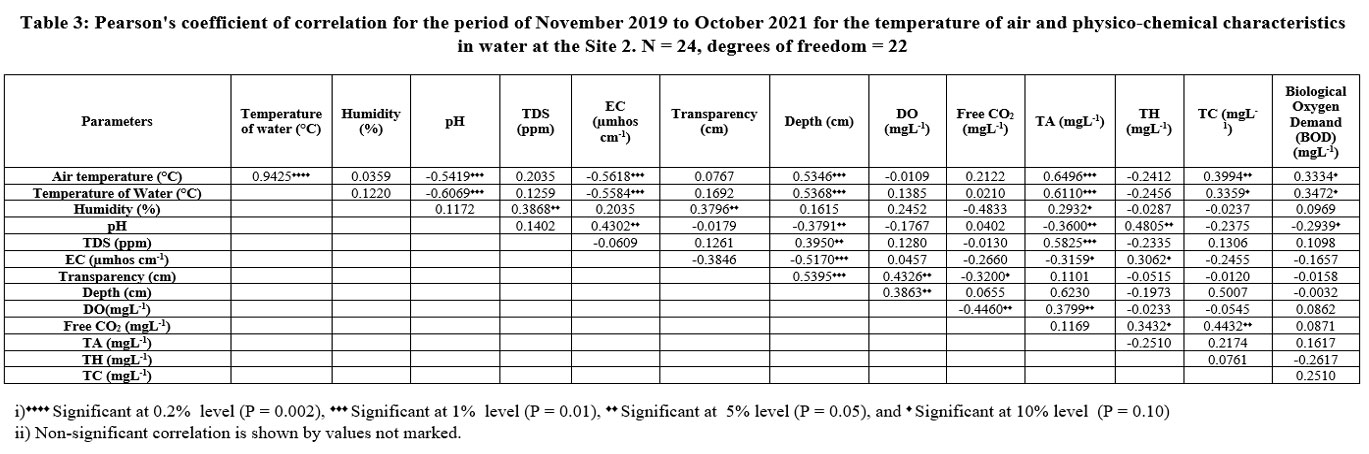
Site 5 reported the lowest temperature of air (12.80°C) in the month of January 2021, while Site 4 recorded the highest (33.25°C) in the month of May 2021. (Fig. 2). The relationship between air and water temperatures was consistently strong and favourable across all sites r = 0.9481 (Site 1), r = 0.9425 (Site. 2), r=0.9578 (Site. 3), r=0.9632 (Site. 4) and r=0.9774 (Site. 5) (Table 2 to Table 6). ANOVA analysis showed that the variation in Air temperature was significant in the case of seasons at the 1% level (P<0.01).
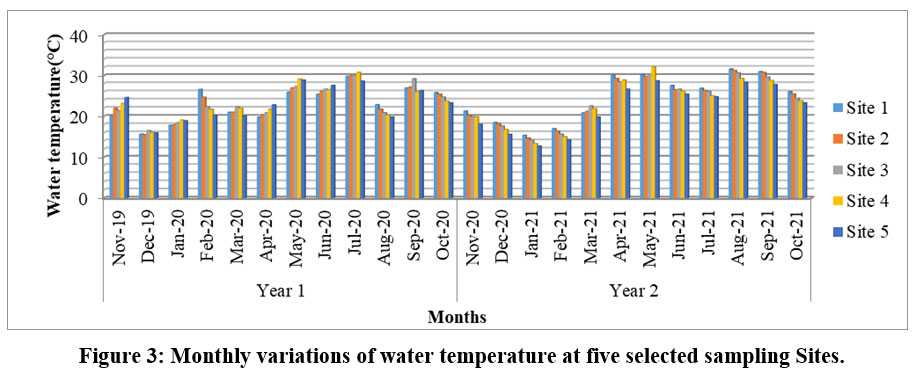
 | Figure 3: Monthly variations of water temperature at five selected sampling Sites.
|
The months of May 2021 and January 2021, respectively, showed the highest (32.10°C) and lowest (12.0°C) recorded water temperatures (Fig. 3) from Site 4. At three sites, water temperature significantly correlated negatively with pH and positively with depth, r = -0.4154 (Site 1), r = -0.6069 (Site 2), r = -0.5311 (Site 4) (Tables 2, 3 and 5). ANOVA analysis showed that the variation in Water temperature was significant in the case of sites at the 5% significance level (P<0.05) and seasons at the level of 1% (P<0.01).
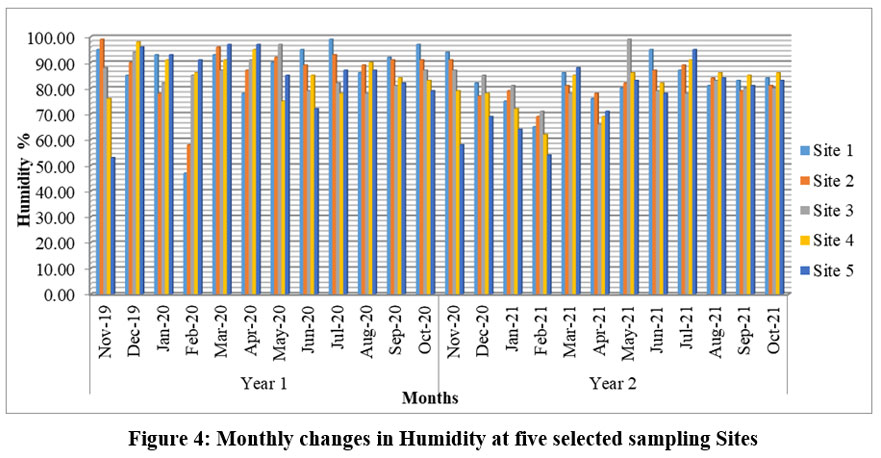
 | Figure 4: Monthly changes in Humidity at five selected sampling Sites.
|
The lowest humidity (47%) was found at Site 1 in the month of February 2020, while the highest (99%) was found there in the months of July 2020, November 2019 at Site 2, and May 2021 at Site 3. (Fig. 4). At sites 1 and 2, humidity and TDS had a positive and substantial connection, where r = 0.3239 (Site 1) and r = 0.3868 (Site 2) (Tables 2 and 3). ANOVA analysis showed that the variation in Humidity was significant in the case of seasons at the 5% level (P<0.05).
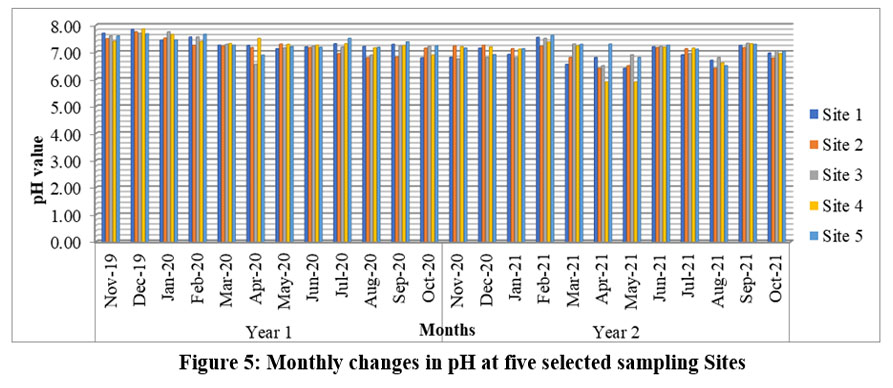 | Figure 5: Monthly changes in pH at five selected sampling Sites.
|
One of the key parameters in determining the hydrogen ion concentration in an aqueous solution is pH. The pH range in the current investigation was between 5.90 and 7.86, indicating that the water was either slightly acidic or slightly alkaline. Site 4 recorded the highest pH (7.86) values in the month of December 2019 and the lowest pH (5.90) values in the months of April and May 2021 (Fig. 5). It may be due to the excess rainfall at that time. It was significantly positively correlated with the sites' overall hardness, r = 0.5652 (Site. 1), r = 0.4805 (Site. 2), r =0.6554 (Site. 3), r =0.4511 (Site. 4), and r =0.4853 (Site 5). (Table 2. to 6) ANOVA analysis showed that the variation in pH was significant in the case of seasons at a 1% level (P<0.01).
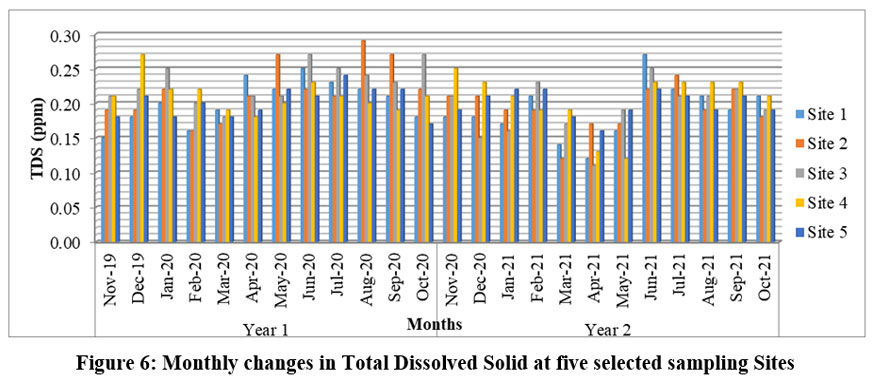
 | Figure 6: Monthly changes in Total Dissolved Solid at five selected sampling Sites
|
The lowest Total Dissolved Solid concentration (0.11 ppm) was identified at Site 3 in the month of April 2021, and the highest concentration (0.29 ppm) was discovered at Site 2 in the month of August 2020 (Fig. 6). A strong and favorable association was found between total alkalinity and TDS at the Site. 1 (r=0.5825), Site. 2 (r=0.6306), Site. 5 (r=0.4345) (Tables 2, 3 and 6).
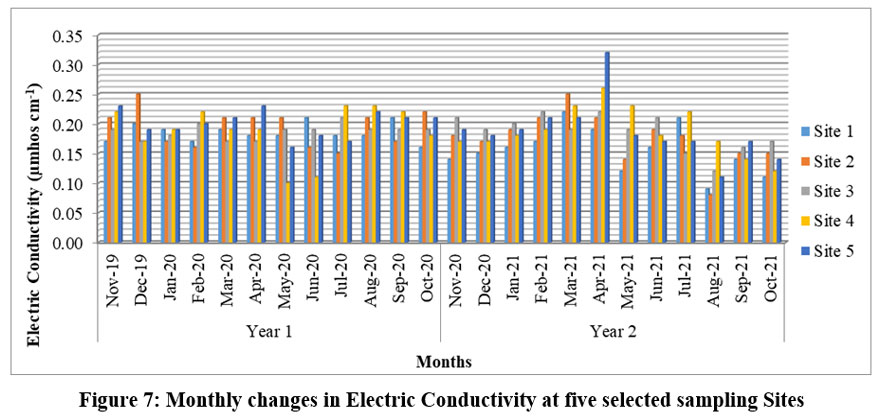 | Figure 7: Monthly changes in Electric Conductivity at five selected sampling Sites
|
The highest conductivity (0.32 mhos cm-1) was recorded at Site 5 throughout the study period, primarily in the month of April 2021. At Site 5, Electrical Conductivity (EC) was found to be at its highest during the summer (Fig. 7). EC was found to be lowest in the month of August, 2021 at Site 2. ANOVA analysis showed that the variation in Electric Conductivity was significant in the case of seasons at the 1% level (P<0.01).
 | Figure 8: Monthly variation in Transparency at five selected sampling Sites
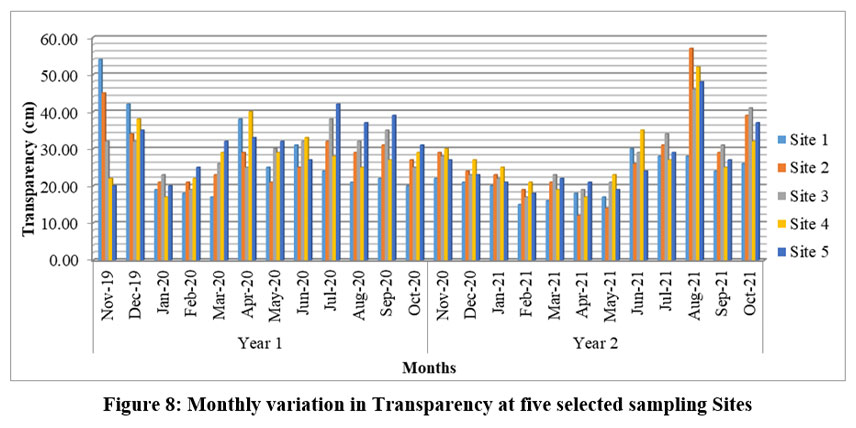
|
The transparency of water depends on the amount of inorganic or organic particles present in the water. Throughout the duration of the investigation, the transparency of the river's water ranged from 12 cm to 57 cm. The transparency of water was highest in the month of August 2021 (57.00 cm) at Site 2 and lowest in the month of April 2021 (12.00cm) at the same Site (Fig. 8). ANOVA analysis showed that the variation in Transparency was significant in the case of seasons at the 5% level (P<0.05).
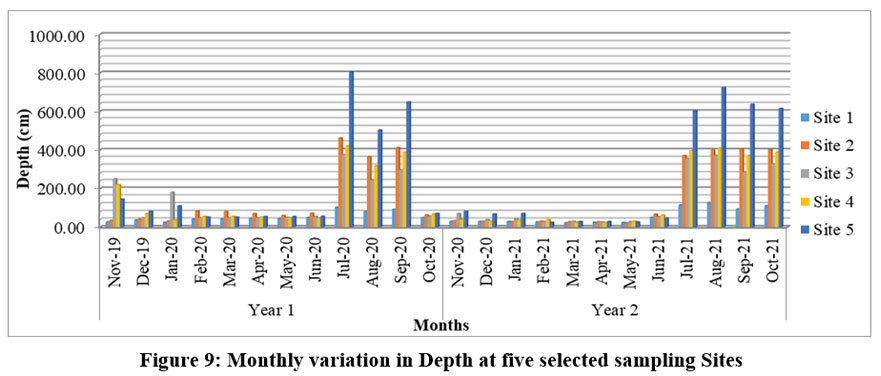
 | Figure 9: Monthly variation in Depth at five selected sampling Sites
|
Depth is the dimension of the river channel. It is a basic physical characteristic of the river and an indicator of the stream's dynamics, related to the substrate and riverbed morphology. The highest depth (805.00 cm) of the river was recorded in the month of July, 2020, from Site 5, and the lowest depth (21.00cm) of the river was recorded in the month of May, 2021, from Site 2 (Fig. 9). At all the study sites, depth significantly correlated positively with total alkalinity. ANOVA analysis showed that the variation in Depth of the river Kulik was significant in the case of seasons at 1% level (P<0.01).
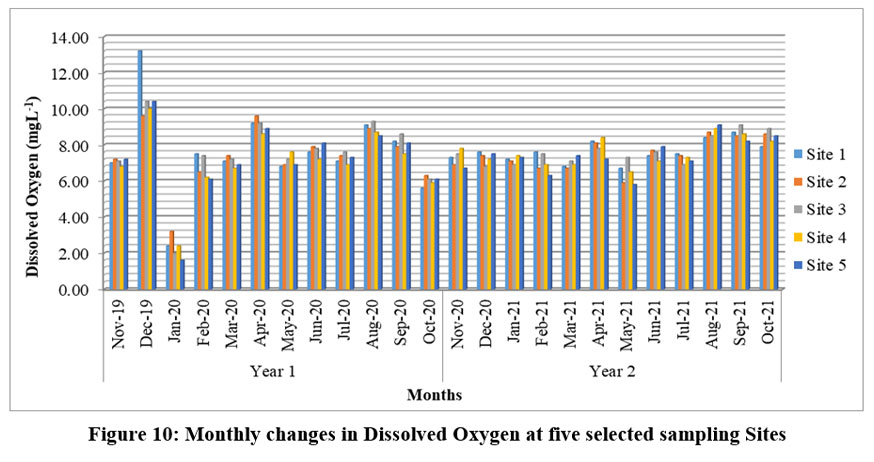
 | Figure 10: Monthly changes in Dissolved Oxygen at five selected sampling Sites
|
Throughout the entire study period, Site 1 reported the highest DO (13.20mgL-1) in the month of December 2019. The lowest value of dissolved oxygen was observed (1.60mgL-1) at Site 5 (Fig. 10). At Sites 3 and 5, DO significantly correlated positively with both chloride and BOD (Table 4 and 6). ANOVA analysis showed that the variation in DO of the river Kulik was significant in the case of seasons at the 1% level (P<0.01).
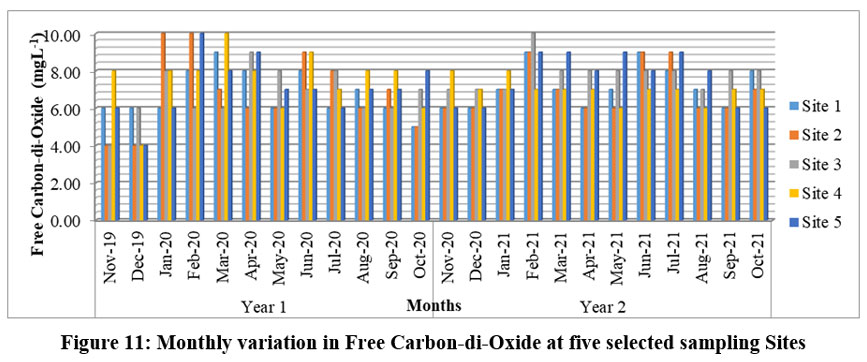
 | Figure 11: Monthly variation in Free Carbon-di-Oxide at five selected sampling Sites.
|
The highest monthly free CO2 readings of the study were found at Site 2 (10.00 mgL-1) in the months of January and February 2020; at Site 3 in the month of February 2021; at Site 4 in the month of March 2020; The lowest (4.00mgL-1) was found at Site 2 between November and December of 2019, at Site 3 in the month of November, 2019, and at Site 4 and Site 5 in the month of December, 2019 (Fig. 11). Free CO2 showed a positive correlation with chloride and BOD (Table 2. to 6). ANOVA analysis showed that the variation in Free CO2 of the river Kulik was significant in the case of seasons at 5% level (P<0.05).
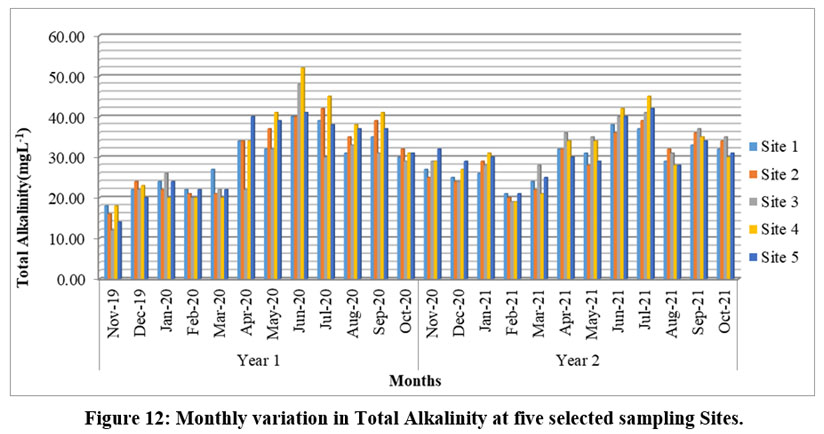
 | Figure 12: Monthly variation in Total Alkalinity at five selected sampling Sites.
|
The maximum level of total alkalinity (52.00mgL-1) was observed in the month of June, 2020 at Site 4, while the lowest level (12.00mgL-1) was recorded in the month of November, 2019 at Site 3 (Fig. 12). During the study, Total Alkalinity had a significant positive correlation with BOD at sites 1 and Site 5 (Table 2 and 6). ANOVA analysis showed that the variation in Total Alkalinity of the river Kulik was significant in the case of seasons at 1% level (P<0.01).
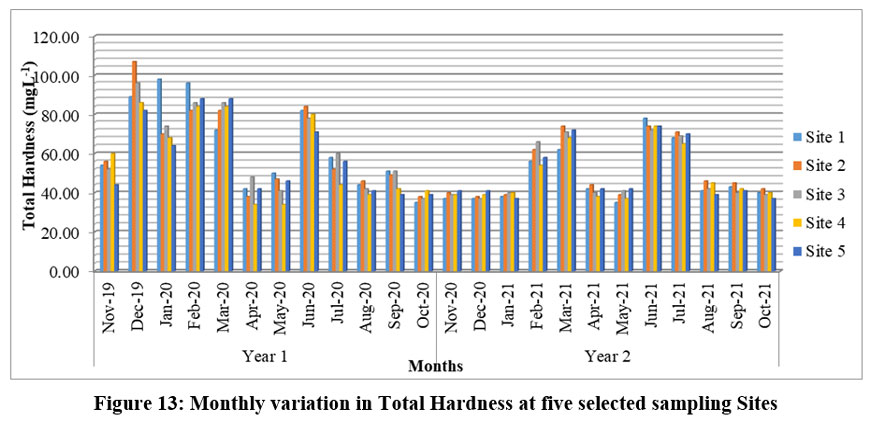
 | Figure 13: Monthly variation in Total Hardness at five selected sampling Sites.
|
Throughout the entire study period, Site 2 recorded the highest total hardness (107.00mgL-1) in the month of December 2019, while Site 4 recorded the lowest total hardness (34.00mgL-1) in the months of April and May 2020 (Fig. 13). The total hardness had a significant negative correlation with BOD (r = -0.3141) at Site 3 (Table 4). ANOVA analysis showed that the variation in Total Hardness of the river Kulik was significant in the case of seasons at the 1% level (P<0.01).
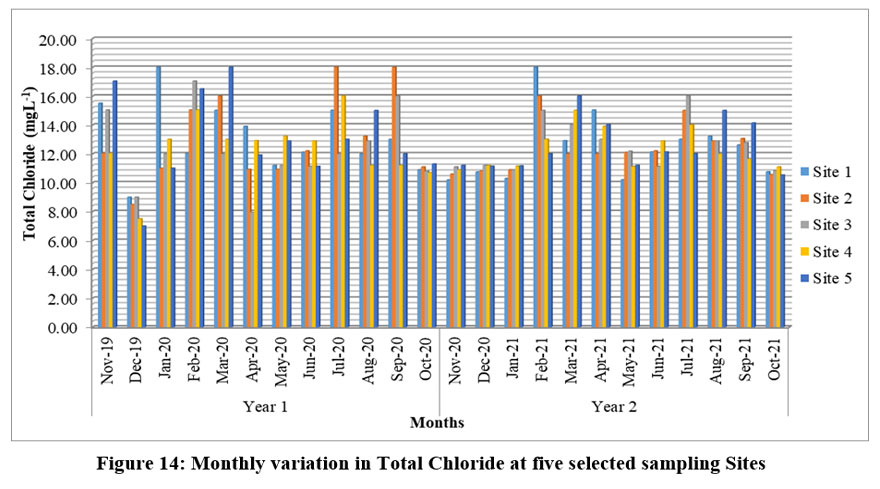
 | Figure 14: Monthly variation in Total Chloride at five selected sampling Sites.
|
Throughout the entire study period, Site 2 recorded the highest total hardness (107.00mgL-1) in the month of December 2019, while Site 4 recorded the lowest total hardness (34.00mgL-1) in the months of April and May 2020 (Fig. 14). The total hardness had a significant negative correlation with BOD (r = -0.3141) at Site 3 (Table 4). ANOVA analysis showed that the variation in Total Hardness of the river Kulik was significant in the case of seasons at the 1% level (P<0.01).
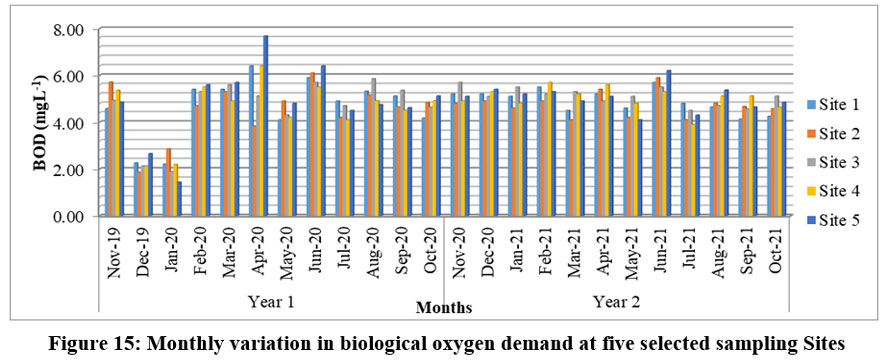
 | Figure 15: Monthly variation in biological oxygen demand at five selected sampling Sites.
|
In January 2020, the BOD value of Site-5 showed the lowest level ever (1.44 mgL-1). The highest BOD (7.68 mgL-1) was found in the month of April 2020 at Site 5 (Fig. 15). ANOVA analysis showed that the variation in BOD of the river Kulik was significant in the case of seasons at the 1% level (P<0.01).
 | Table 2: Pearson's coefficient of correlation for the period of November 2019 to October 2021 for the temperature of air and physico-chemical characteristics in water at the Site 1. N = 24, degrees of freedom = 22
|
 | Table 3: Pearson's coefficient of correlation for the period of November 2019 to October 2021 for the temperature of air and physico-chemical characteristics in water at the Site 2. N = 24, degrees of freedom = 22
|
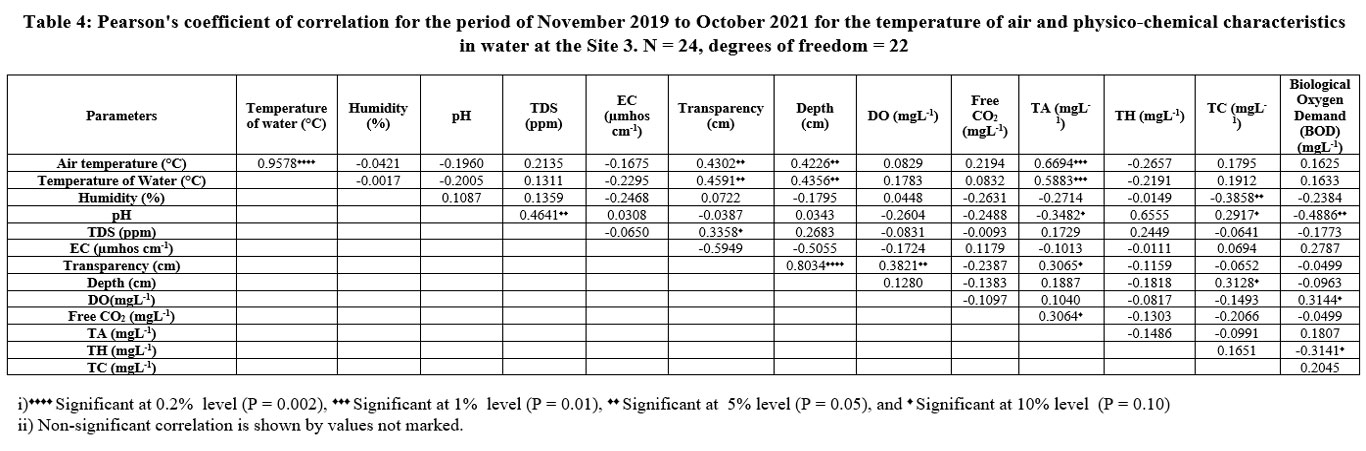 | Table 4: Pearson's coefficient of correlation for the period of November 2019 to October 2021 for the temperature of air and physico-chemical characteristics in water at the Site 3. N = 24, degrees of freedom = 22
|
 | Table 5: Pearson's coefficient of correlation for the period of November 2019 to October 2021 for the temperature of air and physico-chemical characteristics in water at the Site 4. N = 24, degrees of freedom = 22.
|
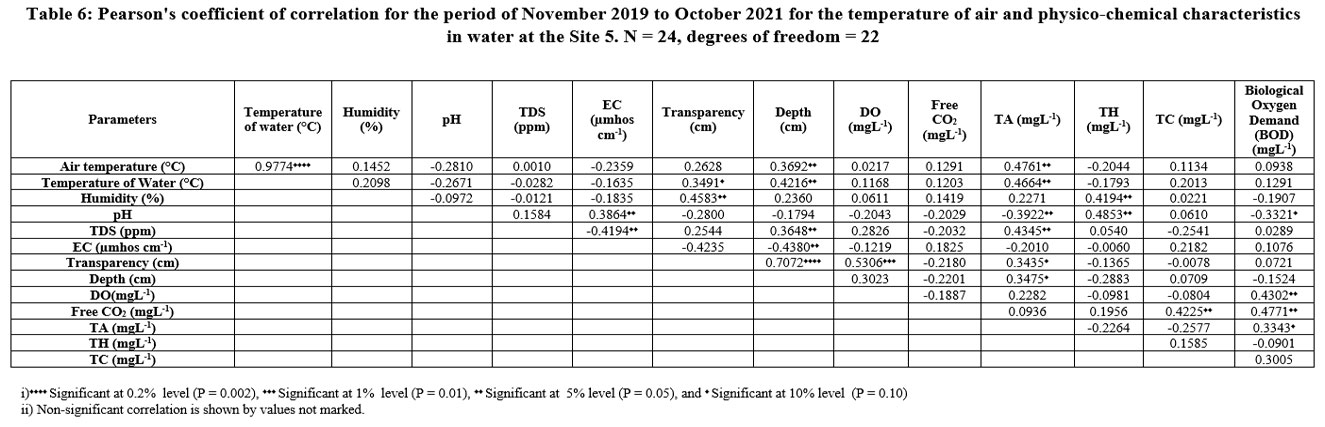 | Table 6: Pearson's coefficient of correlation for the period of November 2019 to October 2021 for the temperature of air and physico-chemical characteristics in water at the Site 5. N = 24, degrees of freedom = 22.
|
Discussion
Water quality is generally defined as the chemical, physical, and biological properties of water based on the criteria of its utilization. Temperature fluctuations play an important role in climate variability, necessitating the need to continue tracking temperature patterns even in places where a temperature pattern has been identified by Oyewole. 20 Water temperature is significant for its influence on chemical and biological processes in organisms. 21 Water temperature is one of the most crucial environmental elements impacting aquatic ecosystems and physico-chemical parameters, according to Bellos and Sawidis. 22 Ahipathy and Puttaiah noted that the season, location, sample duration, and temperature of effluents entering the stream all play a significant role in the variation in the temperature of the river. 23Both the minimum air and water temperatures were found during the winter, and the maximum was recorded during the summer months (Figs. 2.1 and 2.2). At each location, there was a sizable positive association between air and water temperatures: r= 0.9481 (Site. 1), r= 0.9425 (Site. 2), r=0.9578 (Site. 3), r=0.9632 (Site. 4), and r=0.9774 (Site. 5). The air temperature and water temperature were positively and significantly correlated at each location (Tables 2, 3, 4, 5, and 6). Similar findings were recorded by Mondal et al. in the Mirik Lake of the Darjeeling Hills. 24At all locations, water temperature had a negative correlation with pH (Tables 2, 3, 4, 5 and 6), like Mondal. 25
The pH values of the present study varied from 5.90 to 7.86, indicating a slightly acidic to slightly alkaline nature of the water (Fig. 2.4). The pH showed a significant negative correlation with BOD at Sites 2, 3, 4, and 5. Tajmunnaher et al. also observed a negative correlation between pH and BOD in the Kushiyara river, Sylhet, Bangladesh. 26 During the summer, the pH value was found to be higher, which corroborates the findings of Krishnaram et al. 27 The pH showed a positive correlation with electrical conductivity (Tables 2, 3, 4, 5, and 6), like Gupta et al.28
Total Dissolved solids are a nutrient that regulates the biological and physical quality of water. 29 A rise in TDS indicates contamination by extraneous sources, which has a negative impact on the quality of natural water. 30 TDS and total alkalinity displayed a strong and positive association at Site. 1 (r = 0.6306), Site. 2 (r=0.5825), and Site. 5 (r=0.4345) (Table 6). Similar observations were recorded by Kothari et al. at different water bodies in Uttarakhand. 31
The highest conductivity reading recorded at Site 5 in the summer months (Fig. 2.6) might be attributed to human influence. Tripathi et al. also found higher values of conductivity in the summer months. 32 In the current research, the EC of water exhibited a strong positive correlation with total hardness (Tables 2 and 3) and chloride (Table 2.4) An analogous observation was also recorded by Kumar et al. in the middle of the Gangetic Plain. 33.At every site, transparency and DO showed a substantial positive association throughout the whole study period (Tables 2, 3, 4, 5 and 6). A similar observation was also recorded by Zhenghu et al. at Shahu Lake in China. 34. At every study site, depth significantly positively correlated with total alkalinity. Similar findings were recorded in the river Kushiyara of Bangladesh by Tajmunnaher and Chowdhury. 26
As a result, oxygen availability is considered a key component in hydrobiology, impacting organism function, community organization, and local diversity. 35 According to Ansari and Raja, fluctuations in DO levels were caused by the solubility of oxygen in water, the intensity of light, and photosynthesis. 36 According to Banerjee, an annual DO concentration of around 5.00 mgL-1 was determined to be appropriate for fish culture. 37 The highest DO (13.20 mgL-1) was recorded from Site 1 in the month of December, 2019. Alam et al. also observed the highest DO values in December in the case of Hilnabeel, Bangladesh. 38 The quantity of oxygen in the river Kulik is determined by the area of water-air contact, water circulation, and the amounts generated and consumed within each site. The lowest values of DO at Site 5 (1.60 mgL-1) were much lower than the drinking (Fig. 2.9) and bathing water standards set by the CPCB and the drinking water standards set by the WHO. 19, 18 At Sites 3 and 5, DO significantly correlated positively with both chloride and BOD (Fig. 2.9). Similar findings were made by Bose and Gorai at Dhanbad and Pillai et al. in the coastal waters of the South-West coast of India. 39,40
Carbon dioxide is present in water as dissolved gas. For aquaculture, the limits of free carbon dioxide are 1–10 mgL-1, according to Boyd and Tucker. 19 Free CO2 showed a positive correlation with the chloride and BOD of water in the present investigation. Similar observations were recorded by Huq at Kumari Beel, Bangladesh. 41
Total alkalinity limitations for aquaculture are 50–300 mgL-1.16 The total alkalinity values of the present study (12.00 mgL-1 to 52.00 mgL-1) were within the limit (Fig. 2.11). The lowest alkalinity (12.00 mgL-1) was recorded during the winter months (Fig. 2.11), which may be due to the ‘dilution effect'. 42 Alkalinity and BOD had a strong positive association in the current study. Sharma and Jindal also found similar observations in the river Sultej of Ludhiana. 43
According to Boyd and Tucker, TH levels of 50–200 mgL-1 are appropriate for aquaculture. 16 Over the course of the investigation, the highest total hardness value (107.00 mgL-1) recorded at Site 2 in the month of December 2019 might be linked to a combination of elements such as the minimal water level of the river, the higher temperature, and the salts of calcium and magnesium added by soap and detergents utilized for laundry and bathing. The lowest value (34.00 mgL-1) of the total hardness was recorded in the months of April and May 2020 (Fig. 2.9), which could be attributed to lesser human activities during the Lockdown period due to the COVID-19 pandemic situation. The total hardness had a significant negative correlation with BOD (r = -0.3141) at Site 3. Similar findings were recorded by Risner at the Albama and Dog River Watersheds. 44
Chloride concentration indicates the level of pollution. 45 Higher chloride concentrations are linked to higher levels of pollution. 46, 47 Chloride is expelled as nitrogenous chemicals in water bodies. 48 The most significant source of chloride in naturally occurring freshwater is the outflow of household sewage, and a high chloride concentration indicates sewage contamination. 49 Chloride had a significant positive correlation with BOD (r = 0.3012) in Site 4 (Table 5) and (r = 0.3005) at Site 5 (Table 6). A similar type of positive correlation was recorded by Tripathi et al. from the river Ganga at Holy Place Shringverpur, Allahabad, and by Bhandari and Nayal at the Kosi river, Uttarakhand. 32, 50
The highest BOD (7.68 mgL-1) was found in the month of April, 2020 at Site 5 (Fig. 2.12), which was much greater than the drinking and bathing water standards set by CPCB. 19 The higher BOD values may be associated with organic pollution caused by sewage contamination through incoming drains. According to Wahid et al., a BOD value greater than 7.00 mgL-1 is indicative of pollution. 51 BOD levels between 2.00 mgL-1 and 4.00 mgL-1 are acceptable, while levels above 5.00 mgL-1 indicate serious pollution. 52
Conclusion
The present investigation revealed the current physico-chemical status of the water in the river Kulik of the Uttar Dinajpur District. Although the values of different parameters of water quality such as pH, chloride, TA, and TH of all five sampling sites in the Uttar Dinajpur district are within the recommended limits (drinking water standard) set by WHO, most of the time the dissolved oxygen values of Site 5 were lower than the drinking and bathing water standards set by CPCB and the drinking water Standard set by WHO. The highest BOD was recorded from Site 5, which was much greater than the drinking and bathing water standards set by CPCB. From the overall study, it can be concluded that Sites 3, 4, and 5 were more polluted than the other sites. The higher pollution levels at these sites may be due to higher levels of anthropogenic activities and poor maintenance of the water. Nonetheless, it is imperative to explore more chemical compounds to find out the overall water quality of the river Kulik. To control the discharge of garbage from homes and agricultural fields next to the river, public awareness is crucial. In order to protect the water quality of the river, sand lifting from the river should be reduced. This research can be helpful in developing strategies for ecological management, conservation, and restoration.
Acknowledgement
The authors express their sincere thanks to the Vice Chancellor, Raiganj University, Uttar Dinajpur – 733134 for providing the opportunities to perform the research work in the Department of Zoology.
Conflict of Interest
The author(s) declares no conflict of interest.
Funding Sources
The author(s) received no financial support for the research, authorship, and/or publication of this article.
References
- Postel, S. L. Daily, G.C. and Ehrlich P.R. Human appropriation of renewable fresh water. Science. 1996; 271: 785-788.
CrossRef - Gautam, H.R. and Kumar, R. Better Groundwater Management Can Usher in India into Second Green Revolution. Journal of Rural Development. 2010; 58(7): 3-5.
- BasavarajaSimpi, S. M., Hiremath, K. N. S. Murthy, K. N. Chandrashekarappa, Anil N. Patel, E. T. Puttiah. Analysis of Water Quality Using Physico-Chemical Parameters Hosahalli Tank in Shimoga District, Karnataka, India. Global Journal of Science Frontier Research. 2011; 1(3):31-34.
- Nishat, B., Chakraborty, S. K., Hasan, M.E. and Rahman, A.J.M.Z. Rivers Beyond Borders: India Bangladesh Trans-boundary River Atlas. Ecosystems for Life: A Bangladesh-India Initiative. Int. Uni. Conser. Nat., Dhaka, Bangladesh. 2014; 51 - 52.
- Kamal, D., Khan, A.N., Rahman, M.A. and Ahamed, F. Study on the Physico Chemical Properties of Water of Mouri River, Khulna, Bangladesh. Pakistan Journal of Biological Sciences. 2007; 10: 710-717.
CrossRef - Pal, J., Pal, M., Roy, K. P. and M. A. Water Quality Index for assessment of Rudrasagar Lake Ecosystem, India. International Journal of Engineering Research Applications. 2016; 6(1): 98-101.
- Pal, S. and Talukdar, S. Impact of missing flow on active inundation areas and transformation of parafluvial wetlands in Punarbhaba–Tangon river basin of Indo-Bangladesh. Geocarto International. 2019; 34(10): 1055-1074.
CrossRef - Roy, F., K. C. and Ferdoushi, Z. Some aspects of water quality of the Tangon River in Bangladesh. 2020; 15(4): 59-66.
- Moundiotiya, C., Sisodia, R., Kulshreshtha, M. and Bhatia, A.L. A case study of the Jamwa Ramgarh wetland with special reference to physico-chemical properties of water and its environs. Journal of Environmental Hydrology. 2004; 12(24): 1-7.
- Kumar, S.S., Puttaiah, E.T., Manjappa, S., Naik, S.P. and Vijay, K. Water quality assessment of river Tunga, Karnataka. Environment and Ecology. 2006; 24(1): 23-26.
- Bhuiyan, J.R. and Gupta, S. (2007). A comparative hydrobiological study of a few ponds of Barak Valley, Assam and their role as sustainable water resources. Journal of Environmental Biology. 2007; 28(4): 799-802.
- Patel, J.N. and Patel, N.K. Study of physico-chemical properties of water in Amirgadh Taluka of Banaskantha District of North Gujarat, India. Life sciences Leaflets. 2012; 9: 82-90.
- Acharjee, M.L. and Barat, S. Spatio-temporal Dynamics of Physico-Chemical Factors of River Relli in Darjeeling Himalaya, West Bengal, India. North Bengal University Journal of Animal Sciences. 2011; 5:24-33.
- Chakraborty, R., Talukdar, S. and Pal, S. Habitat identify crisis caused by the riparian wetland squeeze in Tangon River Basin, Barind Region, India. 2018; 26: 507-516.
CrossRef - Mondal, D. and Sarkar, M. Investigations on water quality parameters and ichthyofaunal diversity of the river Tangon at Radhikapur, Uttar Dinajpur, West Bengal, India. Uttar Pradesh Journal of Zoology. 2021; 42(10): 75-89.
- Boyd, C.E. and Tucker, C.S. Pond aquaculture water quality management Kluwen Academic Publishers, Boston, MA USA. 1998.
CrossRef - APHA. Standard methods for the examination of water and wastewater. 23rd ed, American public Health Correlation, American Water Works Correlation and Water Environmental Federation, Washington, USA. 2017.
- WHO. WHO handbook on indoor radon: A Public health perspective, Geneva, World Health Organization. 2013.
- Water Quality Standards in India CPCB. (Source IS 2296:1992). 2012.
- Oyewole, Cl. Climate change: Mitigating effect change by Evolving Sustainable Agriculture. International Journal of Science. 2015; 4: 6.
- Jayalakshmi, V., Lakshmi, N. and Singaracharya, M. A. Assessment of physico-chemical parameters of water and waste waters in and around Vijayawada. International Journal of Research in Pharmaceutical and Biomedical Sciences. 2011; 2(3): 1040-1046.
- Bellos, D, and Sawidis, T. Chemical pollution Monitoring of River (Thesealia, Greece). Journal Environment Management. 2005; 76(4): 282-292.
CrossRef - Ahipathy, M.V. and Puttaiah, E.T. Ecological characteristics of Vrishabhavathy River in Bangalore (India). Environmental Geology. 2006; 49:1217–1222. DOI: https://doi.org/10.1007/s00254-005-0166-0
CrossRef - Mondal, D., Pal J., Ghosh, K. T and Biswas, K. A. Abiotic characteristics of Mirik Lake water in the Hills of Darjeeling, West Bengal, India. Advances in Applied Science Research. 2012; 3(3): 1335-1345.
- Mondal, D. Hydrobiological Study of the Mirik Lake of the Darjeeling Hills. Lambert Academic Publishing, Germany. 2020. ISBN. 978-620-2-52488-9.
- Tajmunnaher, and Chowdhury, M.A.I. Correlation Study for Assessment of Water Quality and its Parameters of Kushiyara River, Sylhet, Bangladesh. International Journal of New Technology and Research. 2017; 3(12): 01-06.
- Krishnaram, H., Mohan, M., Ramchandra, Vishalkashi, Y. Limnological studies on Kolaramma lake Kolar, Karnataka. Environmental Ecology. 2007; 52(2): 364-367.
- Gupta, D. P., Sunita and J. P. Saharan. Physiochemical Analysis of Ground Water of Selected Area of Kaithal City (Haryana) India. Researcher. 2009; 1(2): 1-5.
- Medudhula, T., Samatha, C. and Sammaiah, C. Analysis of water quality using physico-chemical parameters in lower manair reservoir of Karimnagar district, Andhra Pradesh. International Journal of Environmental Science. 2012; 3(1): 22-25.
- Kataria, H.C., Qureshi, H.A., Iqbal, S.A. and Shandilya, A.K. Assessment of water quality of Kolar Reservoir in Bhopal (M.P). Pollution Research. 1996; 15: 191-193.
- Kothari, V., Vij, S., Sharma, S.K. and Gupta, N. Correlation of various water quality parameters and water quality index of districts of Uttarakhand. Environmental and Sustainability Indicators. 2021; 9: 1-8.
CrossRef - Tripathi, I. P., Dwivedi, A., Kumar, P., Suresh, M, and Gautam, S. S. Physico-chemical parameters and Correlation Coefficients of Ground Waters of Shahdol District. Asian Academic Research Journal of Multidisciplinary. 2014; 1: 178-200.
- Kumar, P., Kumar, M., Ramanathan, A.L, and Tsujimura, M. Tracing the factors responsible for arsenic enrichment in groundwater of the middle Gangetic Plain, India: a source identification perspective. Environmental Geochemistry and Health. 2010; 32(2): 129–146.
CrossRef - Zhenghu, M., Lei, W., Xiaoyu, L., Xiangning, Q., Juan, Y., Xini, Z. and Yaqing L. The oasis regional small and medium lake water transparency monitoring research and impact factor analysis based on field data combined with high resolution GF-1 satellite data. Journal of Freshwater Ecology. 2021; 36(1): 77-96. DOI: https://doi.org/10.1080/02705060.2021.1883753
CrossRef - Wetzel, R.G. Limnology: lake and river ecosystem. Academic Press, New York. 2001.
- Ansari, S. and Raja, W. Zooplankton diversity in freshwater bodies of Aligarh region, U.P. Limnology Souvenir World Lake Conf. Jaipur. NSL. 2007; 170-175.
- Banerjee., S.M. Water quality and soil conditions of fishponds in some states at India in relation to fish production. Indian Journal of Fisheries. 1967; 14:115-155.
- Alam, Dr. MD, T., Hussain, MD., Hasan, MD., Haque, MD., Das, S, and Mazumder, S. Water quality parameters and their correlation matrix: A case study in two important wetland Beels of Bangladesh. 2015; 30(3):223-254.
- Bose, S. K. and Gorai, A. C. Seasonal fluctuations of plankton in relation to physico-chemical parameters of a freshwater Tank of Dhanbad, India. Journal of Freshwater Biology. 1993; 5: 133–140.
- Pillai, V. N. Variations in dissolved oxygen content of coastal waters along the south west coast of India in space and time. Indian Journal of Marine Science. 1993; 22: 279-282.
- Huq., M.E. A complication of environmental causes of Bangladesh Administered by the Department of environment, BEMP. 2002; 60-63.
- Bishop, J.E. Limnology of small Malayan River, Sungai Gomback. Dr. W. Junk Publishers, The Hague. 1973.
CrossRef - Sharma, C. and Jindal, R. Studies on water quality of Sutlej River around Ludhiana with reference to physicochemical parameters. Environmental Monitoring and Assessment. 2011; 174: 417-425.
CrossRef - Risner, T. R. Relationship between Hardness levels in Eslava Creek and Rainfall amounts in mobile. 2007.
- Sinha, M. P. Effect of waste disposal on water quality of river Damodar in Bihar. Physicochemical characteristics. In Ecology and Pollution in Indian rivers (Ed. R.K. Trivedi). 1988; 216-246.
- Umavathi, S., Longakumar, K. and Subhashini, S. Studies on the nutrient content of Sulur pond in Coimbator, Tamil Nadu. Journal of Ecology and Environmental Conservation. 2007; 13(5): 501-504.
- Vijayvergia, R.P. and Y.D. Tiagi. Bioindicators of environmental: a case study of certain plant species in eutrophicated Lake Udaisagar and nearby polluted sites, Udaipur (Rajasthan). Indian Journal of Environmental Science. 2007; 11: 111-114.
- Basu, M., Roy, N. and A. Barik. Seasonal abundance of net zooplankton correlation with physico-chemical parameters in a freshwater ecosystem. International Journal of Lakes and rivers. 2010; 3:67-77.
- Ekubo, A. A. and J. F. N. Abowei. Review of some water quality management principles in culture fisheries. Research Journal of Applied Sciences, Engineering and Technology. 2011; 3: 1342-1357.
- Bhandari, S. N, and Nayal, K. Correlation study on Physico-Chemical parameters and quality assessment of Kosi River water, Uttarakhand. CODEN ECJHAO. Journal of Chemistry. 2008; 5(2): 342-346.
CrossRef - Wahid, S. M., Babel, M. S, and Bhuiyan, A. R. Hydrologic monitoring and analysis in the Sundarbans mangrove ecosystem. Journal of Hydrology. 2005; 332: 381-395.
CrossRef - Clerk, R.B. Marine Pollution. Fifth Edition, Oxford. 1986; 256.


