Statistical Analysis of Thirty-Year Rainfall Variability in Udaipur District, Rajasthan, India
Shalu Vyas
*
 , Porush Kumar
, Kuldeep Kamboj
and Anil K. Mathur
, Porush Kumar
, Kuldeep Kamboj
and Anil K. Mathur
1
Civil Engineering Department,
University Department,
Rajasthan Technical University,
Kota,
Rajasthan
India
http://dx.doi.org/10.12944/CWE.18.3.14
Copy the following to cite this article:
Vyas S, Kumar P, Kamboj K, Mathur A. K. Statistical Analysis of Thirty-Year Rainfall Variability in Udaipur District, Rajasthan, India. Curr World Environ 2023;18(3). DOI:http://dx.doi.org/10.12944/CWE.18.3.14
Copy the following to cite this URL:
Vyas S, Kumar P, Kamboj K, Mathur A. K. Statistical Analysis of Thirty-Year Rainfall Variability in Udaipur District, Rajasthan, India. Curr World Environ 2023;18(3).
Download article (pdf) Citation Manager Publish History

Introduction
Climate variability refers to long-term variations in meteorological factors such as rainfall, humidity, temperature, wind speed, evaporation, and others1,2. Global warming is the most critical environmental concern as it is responsible for global climate change and leads to variations in long-term rainfall patterns that affect water availability worldwide3,4. There are four principal greenhouse gases (GHGs) in the environment, namely, carbon dioxide, water vapour, methane, and nitrous oxide, that contribute to the problem of climate change5. Rainfall’s spatial and seasonal distribution changes affect overflow frequency, soil moisture and groundwater reserves, and droughts and floods6.
Global warming increases the earth’s surface temperature, increasing the intensity and duration of drought7. An increase in the moisture holding capacity of the air also causes heavy rainfall8. Heavy rainfall results include devastating calamities, like landslides and floods, which lead to loss of life, property, and livestock9,10. Global climate change increases the risks of famine and water scarcity, affecting the agricultural sector and causing the rapid melting of glaciers11,12.
Changes in the amount, intensity, and frequency of rainfall occur yearly and over decades, affecting the environment and society13. Even a change in the phase of precipitation in one year can ruin the agricultural conditions of the country and its associated economy. It is also a significant threat to the country’s food security14. Variation in rainfall patterns directly or indirectly affects regional water sources that are rainfed or recharged3. The yield of crops, especially in rainfed areas, depends on the rainfall patterns4.
India is an agriculture-based economy that is mainly dependent on monsoon rainfall. About 60 percent of India's total population depends on agriculture for livelihood, which contributes 14 percent to the country's GDP. The Indian Summer Monsoon (ISM) variability affects agricultural food production, industry, and hydropower generation, causing severe pressure on the national economy. In many parts of India, the lack of monsoon rainfall leads to drought conditions, for which the Government of India spends large sums of money on the affected areas to provide relief.
The present study focuses on the rainfall variability of Udaipur district, Rajasthan (India). The annual average rainfall of the Udaipur district is always less than the annual average rainfall of India, so it is crucial to analyse the rainfall trends to get information on agricultural activity, drought conditions, and agricultural productivity in the region. The rainfall pattern for 30 years (1991–2020) has been used to characterise for Udaipur district, Rajasthan, India.
Study Area And Research Methodology
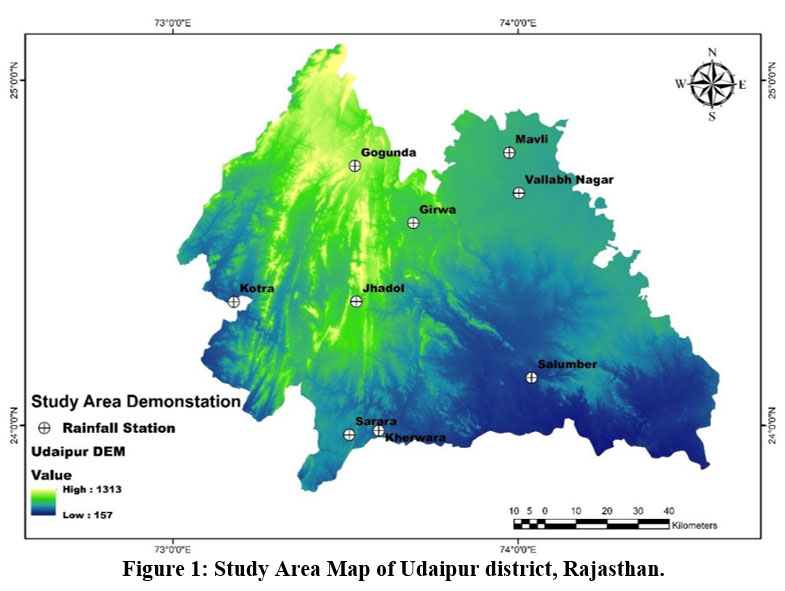
Udaipur district is a part of the Mewar region, situated in southern Rajasthan, and Udaipur city is world famous as the “City of Lakes”15. Udaipur district is located on the southern slopes of the Aravalli range, on the border with Gujarat state, at a distance of 403 km from the state capital Jaipur. Udaipur comes under a semi-arid climate, which occurs in most months of the year16. The total number of population of the Udaipur district is 3,445,34217. The longitudinal and latitudinal extent of the district is 73° 42’ and 24° 45’, respectively, and the district’s total area is 13430 sq. km18,19. The rainfall data is collected for 30 years from 9 raingauge stations situated in the Udaipur district, and these monitoring stations are shown in Figure 1 along with the study area. The geographical coordinates of all rain gauge stations are shown in Table 1.
 | Figure 1: Study Area Map of Udaipur district, Rajasthan.
|
It shares borders with the Rajsamand, Dungarpur, Pali, Banswara, Bhilwara, Chittorgarh, and Sirohi districts of Rajasthan, India 20. In addition, various essential minerals such as copper, lead, phosphate, mica, zinc and silver, calcite, barites, talc (soapstone), wollastonite, limestone, and marble are found in the Udaipur district 21.
Table 1: Rain Gauge Stations of Udaipur district with their latitude and longitude.
S. No. | Station Name | Latitude | Longitude |
1 | Gogunda | 24° 45’ N | 73° 32’ E |
2 | Jhadol | 24° 24’ N | 73° 28’ E |
3 | Kherwada | 23° 59’ N | 73° 36’ E |
4 | Salumber | 24° 08’ N | 73° 02’ E |
5 | Mavli | 24° 47’ N | 73° 59’ E |
6 | Girwa | 24° 35’ N | 73° 42’ E |
7 | Vallabh Nagar | 24° 52’ N | 74° 00’ E |
8 | Sarara | 24° 11’ N | 73° 55’ E |
9 | Kotra | 24° 22’ N | 73° 10’ E |
The periodical breakdown is the winter season (January, February, November, and December), the summer season (March, April, May, and June), and the rainy season (July, August, September, and October). Rainfall trend analysis has been done by linear regression and Mann-Kendall trend test. The equations of trend analysis and precipitation indices are as follows:
Trend Analysis of Rainfall
The trend of rainfall is mainly analysed by linear regression and Mann-Kendall trend test.
Linear Regression Trend Test
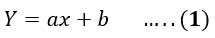
This test defines the linear relationship between rainfall and time as well as predicts the increase or decrease in rainfall values with time. The equation for regression is shown below22,23:
Where, a = slope and b = intercept.
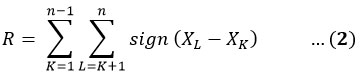
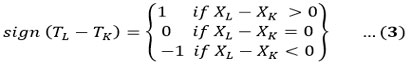
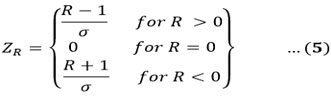
Mann–Kendall Trend Test
The test is conducted between the null hypothesis and alternative hypothesis. There is no trend for the null hypothesis in the rainfall-time data series, on the contrary, there is a trend for the alternative hypothesis. The Mann-Kendall test is calculated by the following equations24,25:
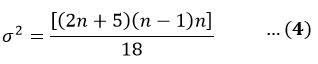
The variance (?2 ) is calculated by the following formula26:
The standard test is represented by this equation26:
Precipitation Indices
The various precipitation indices such as CV, NAR, SRA, WI, PCI, and rainfall dependability have been calculated using the following equations.
Normal Annual Rainfall (NAR)
It is defined as the average annual rainfall for 30 consecutive years. In this study, the rainfall series are classified as monthly, seasonal, and annual rainfall. The NAR is calculated every 10 years to get an idea of its trend. The NAR is obtained by using the following equation27:
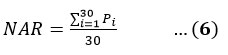
Where, Pi = Rainfall value in the ith year.
Precipitation Concentration Index (PCI)
PCI defined as the non-uniformity, and uniformity of rainfall over a region for a period of time. Increasing values of PCI indicate increasing non-uniformity of rainfall and decreasing values indicate increasing uniformity of rainfall. PCI is calculated by the following equation28:
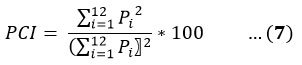
Where, Pi = Rainfall in the ith month.
Standardised Rainfall Anomaly (SRA)
Standardised rainfall anomalies are used to express the probability of drought in any region. The lowest and highest SRA values indicate the maximum and minimum probability of drought respectively. The value of SRA is determined through this formula29,30:
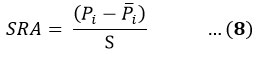
Where S represents the standard deviation and Pi represents the rainfall value in the ith year. The different categories of SRA and PCI, according to their range, are tabulated in Table 2.
Table 2: The SRA and PCI values with their categories.
S.N. | SRA Value | Drought Severity | PCI Value | Rainfall Category |
1 | < - 1.65 | Extreme | < 10 | Uniform Precipitation Distribution |
2 | - 1.65 to ? 1.28 | Severe | 11 - 15 | Moderate Precipitation Concentration |
3 | - 1.28 to ? 0.84 | Moderate | 16 - 20 | Irregular distribution |
4 | > - 0.84 | No Drought | >20 | Strongly irregular distribution |
Wetness Index (Wi)
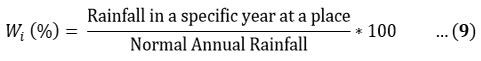
The wetness index is calculated as the percentage ratio of rainfall at a place in a year to the normal annual rainfall:
The wetting index can determine the rainfall deficiency;
Rainfall Deficiency (%)= (100-Wetness index)
Rainfall deficiency (%) is categorised into three categories such as > 60% (Disastrous), 45 - 60% (Serious), and 30 - 45% (Large)24.
Coefficient of variation (CV)
The CV values measure the distribution of rainfall over a particular area. It determines an average’s reliability and provides a foundation for controlling rainfall variability. It is determined by the formula given below31:
Here, CV less than 20 shows less variability, 20-30 denotes moderate variability, and greater than 30 exhibits high variability.
Dependable rainfall
It can be calculated by arranging rainfall-time series data in descending order and determining the rank. In this study, dependable rainfall has been calculated for 50%, 75%, and 90%. It is calculated by below formula 24:
Data Observation
The rainfall data were collected for nine (9) rain gauge stations from the WRD, Rajasthan. The data were further processed on M.S. Excel software to perform trends and other statistical tests for the Udaipur district. The monthly average rainfall for the Udaipur district from 1991 to 2020 is mentioned in Table 3.
Table 3: Monthwise Annual Average Rainfall (mm) recorded in Udaipur District, Rajasthan.
| Year | Jan | Feb | Mar | Apr | May | Jun | Jul | Aug | Sep | Oct | Nov | Dec |
| 1991 | 0.0 | 0.1 | 0.0 | 6.2 | 0.0 | 17.6 | 420.0 | 94.2 | 23.8 | 0.0 | 5.1 | 0.0 |
| 1992 | 0.9 | 0.0 | 1.1 | 0.0 | 12.6 | 32.4 | 347.9 | 193.1 | 139.3 | 8.2 | 6.3 | 0.0 |
| 1993 | 0.0 | 6.8 | 0.9 | 2.6 | 0.8 | 82.4 | 356.9 | 47.6 | 82.0 | 11.1 | 0.4 | 0.0 |
| 1994 | 9.3 | 0.0 | 0.0 | 5.4 | 2.2 | 172.2 | 230.7 | 324.0 | 184.9 | 0.4 | 0.0 | 0.0 |
| 1995 | 31.2 | 0.0 | 0.0 | 0.0 | 0.8 | 16.4 | 249.9 | 71.9 | 57.8 | 8.9 | 0.0 | 5.6 |
| 1996 | 3.1 | 0.0 | 0.1 | 10.1 | 4.1 | 73.6 | 200.3 | 182.6 | 121.4 | 14.0 | 0.0 | 0.0 |
| 1997 | 0.0 | 0.0 | 0.0 | 11.4 | 19.6 | 87.7 | 141.3 | 209.4 | 129.7 | 19.2 | 8.0 | 0.0 |
| 1998 | 0.0 | 0.0 | 1.1 | 11.7 | 1.3 | 81.1 | 123.0 | 146.4 | 213.1 | 88.9 | 0.0 | 0.0 |
| 1999 | 0.0 | 11.3 | 0.0 | 0.0 | 24.2 | 98.6 | 141.3 | 38.8 | 82.9 | 11.7 | 0.0 | 0.0 |
| 2000 | 0.0 | 0.0 | 0.0 | 0.6 | 32.6 | 38.8 | 204.4 | 72.7 | 30.9 | 0.0 | 0.0 | 0.0 |
| 2001 | 0.0 | 0.0 | 0.0 | 3.8 | 14.4 | 145.2 | 275.8 | 166.3 | 10.8 | 11.0 | 0.0 | 0.0 |
| 2002 | 0.0 | 7.8 | 0.0 | 3.0 | 1.8 | 105.9 | 37.8 | 178.4 | 61.2 | 7.3 | 2.3 | 1.2 |
| 2003 | 0.0 | 27.7 | 0.0 | 0.0 | 0.0 | 61.8 | 258.4 | 183.0 | 92.1 | 1.9 | 0.0 | 0.0 |
| 2004 | 0.0 | 0.3 | 0.0 | 0.0 | 6.9 | 65.3 | 114.3 | 265.4 | 64.7 | 26.3 | 0.0 | 0.6 |
| 2005 | 0.0 | 0.0 | 0.0 | 9.0 | 21.7 | 74.6 | 230.0 | 226.0 | 235.1 | 0.0 | 0.0 | 0.0 |
| 2006 | 0.0 | 0.0 | 6.3 | 0.0 | 2.3 | 134.2 | 267.6 | 739.4 | 102.6 | 0.1 | 1.1 | 0.0 |
| 2007 | 0.0 | 7.0 | 0.0 | 0.2 | 6.2 | 38.1 | 302.4 | 230.2 | 42.0 | 0.0 | 0.8 | 0.0 |
| 2008 | 0.0 | 0.0 | 1.6 | 5.2 | 20.2 | 94.6 | 207.0 | 179.0 | 127.4 | 9.7 | 7.9 | 0.3 |
| 2009 | 0.0 | 0.0 | 4.9 | 0.0 | 0.0 | 80.4 | 311.3 | 159.1 | 22.6 | 5.3 | 3.0 | 0.0 |
| 2010 | 0.2 | 0.0 | 0.0 | 0.0 | 0.0 | 47.6 | 271.1 | 358.4 | 101.0 | 2.8 | 84.7 | 6.2 |
| 2011 | 0.0 | 0.0 | 0.0 | 0.0 | 3.3 | 36.9 | 243.4 | 380.6 | 168.3 | 0.0 | 0.3 | 0.0 |
| 2012 | 0.0 | 0.0 | 1.2 | 1.7 | 17.0 | 38.6 | 167.1 | 249.7 | 242.6 | 0.0 | 0.0 | 0.0 |
| 2013 | 0.0 | 4.4 | 0.7 | 12.3 | 1.3 | 114.3 | 310.8 | 178.0 | 158.6 | 62.1 | 0.0 | 0.0 |
| 2014 | 18.7 | 2.7 | 0.0 | 15.1 | 24.3 | 3.6 | 283.7 | 175.2 | 236.1 | 2.7 | 1.7 | 0.0 |
| 2015 | 8.2 | 0.0 | 27.9 | 17.6 | 0.0 | 134.0 | 388.2 | 91.9 | 31.4 | 0.0 | 0.0 | 0.0 |
| 2016 | 0.0 | 0.0 | 1.4 | 0.0 | 3.9 | 66.2 | 375.4 | 386.8 | 33.1 | 60.1 | 0.0 | 0.0 |
| 2017 | 1.3 | 0.0 | 0.2 | 0.3 | 7.7 | 94.6 | 516.3 | 161.8 | 60.8 | 0.0 | 0.0 | 1.7 |
| 2018 | 0.0 | 0.0 | 0.0 | 0.0 | 1.8 | 126.9 | 202.4 | 154.4 | 94.7 | 0.0 | 0.0 | 0.0 |
| 2019 | 0.4 | 0.3 | 0.0 | 8.1 | 12.3 | 140.0 | 134.9 | 472.0 | 209.9 | 81.4 | 3.9 | 0.4 |
| 2020 | 0.0 | 0.0 | 19.8 | 3.9 | 11.7 | 71.2 | 123.7 | 419.6 | 120.2 | 6.7 | 0.0 | 0.3 |
| Avg | 2.4 | 2.3 | 2.2 | 4.3 | 8.5 | 79.2 | 247.9 | 224.5 | 109.4 | 14.7 | 4.2 | 0.5 |
| Max | 31.2 | 27.7 | 27.9 | 17.6 | 32.6 | 172.2 | 516.3 | 739.4 | 242.6 | 88.9 | 84.7 | 6.2 |
| Min | 0.0 | 0.0 | 0.0 | 0.0 | 0.0 | 3.6 | 37.8 | 38.8 | 10.8 | 0.0 | 0.0 | 0.0 |
| SD | 6.7 | 5.6 | 6.1 | 5.3 | 9.3 | 42.4 | 104.6 | 147.2 | 70.1 | 24.6 | 15.4 | 1.5 |
Result And Discussion
Statistical analysis of rainfall variability was determined by the linear regression, and Mann-Kendall trend test. The annual total, annual average, monsoon, and monsoon percentage of rainfall with standard deviation have been calculated from 1991 to 2020, as shown in Table 4. Total rainfall is calculated by summing the monthly rainfall for each year. The 30 year annual average value of precipitation was 700.10 mm (1991-2020), while as per previous studies, averages were 631.21 mm (1957-2016), 630.20 mm (1973-2011), and 558.72 mm (1975-2013). The maximum standard deviation value was 216.58 (1991-2020), while as per previous studies, Maximum were 203.85 (1975-2013), 197 (1957-2016), and 191.25 (1973-2011).The values of the monsoon rainfall and monsoon percentage have been calculated to identify the reason for the uniformity of rainfall. The highest values of the annual total, annual average, and monsoon rainfall are observed at 1253.67 mm, 104.47 mm, and 1109.67 mm, respectively, in 2006, while the lowest values of the total, annual average, and monsoon average of rainfall were observed 379.89 mm in 2000, 31.66 mm in 2000 and 274.67 mm in 1999, respectively. The maximum value of monsoon percentage was 95.13 % in 2011, while the minimum was 67.19 % in 1999.
The standard deviation is also calculated to show the variation in the mean values of precipitation. The analysis of these parameters indicates a significant variation in rainfall concentration.
Table 4: Calculated annual rainfall, monsoon rainfall, monthly average precipitation and monsoon percentage for Udaipur district from 1991 to 2020.
| Year | Annual rainfall (mm) | Monthly average rainfall (mm) | Monsoon rainfall (mm) | Monsoon percentage (%) |
| 1991 | 567.00 | 47.25 | 538.00 | 94.89 |
| 1992 | 741.89 | 61.82 | 688.56 | 92.81 |
| 1993 | 591.44 | 49.29 | 497.56 | 84.13 |
| 1994 | 929.17 | 77.43 | 740.00 | 79.64 |
| 1995 | 442.44 | 36.87 | 388.44 | 87.80 |
| 1996 | 609.33 | 50.78 | 518.33 | 85.07 |
| 1997 | 626.33 | 52.19 | 499.67 | 79.78 |
| 1998 | 666.67 | 55.56 | 571.44 | 85.72 |
| 1999 | 408.78 | 34.06 | 274.67 | 67.19 |
| 2000 | 379.89 | 31.66 | 308.00 | 81.08 |
| 2001 | 627.33 | 52.28 | 463.89 | 73.95 |
| 2002 | 406.78 | 33.90 | 284.78 | 70.01 |
| 2003 | 624.89 | 52.07 | 535.44 | 85.69 |
| 2004 | 543.89 | 45.32 | 470.78 | 86.56 |
| 2005 | 796.44 | 66.37 | 691.11 | 86.77 |
| 2006 | 1253.67 | 104.47 | 1109.67 | 88.51 |
| 2007 | 627.00 | 52.25 | 574.67 | 91.65 |
| 2008 | 652.89 | 54.41 | 523.11 | 80.12 |
| 2009 | 586.67 | 48.89 | 498.33 | 84.94 |
| 2010 | 872.00 | 72.67 | 733.33 | 84.10 |
| 2011 | 832.89 | 69.41 | 792.33 | 95.13 |
| 2012 | 717.78 | 59.81 | 659.33 | 91.86 |
| 2013 | 842.56 | 70.21 | 709.44 | 84.20 |
| 2014 | 763.67 | 63.64 | 697.67 | 91.36 |
| 2015 | 699.22 | 58.27 | 511.56 | 73.16 |
| 2016 | 926.89 | 77.24 | 855.39 | 92.29 |
| 2017 | 844.61 | 70.38 | 738.83 | 87.48 |
| 2018 | 580.22 | 48.35 | 451.56 | 77.82 |
| 2019 | 1063.78 | 88.65 | 898.22 | 84.44 |
| 2020 | 777.00 | 64.75 | 670.11 | 86.24 |
The rainfall variability for the Udaipur district through average annual rainfall for the months of January to December has been calculated by linear regression trend analysis using three decades of data from 1991 to 2020.
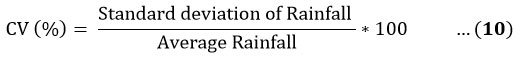
The linear regression trend analysis for thirty-year data of average rainfall in January, February, November, and December exhibit slopes of -0.096, -0.0827, -0.1068, and -0.0021, respectively, as shown in Figure 2. All four months (January, February, November, and December) are the months of the winter season, where no rainfall takes place, with some exceptional cases of Mawath (winter rain occurred in the Northwest of India due to cyclones arising from the Mediterranean Sea). Observations show that there was almost negligible rainfall occurred in January, February, November, and December.
 | Figure 2: Linear Regression trend analysis of the rainfall recorded during the months from January to December for the years 1991 to 2020.
|
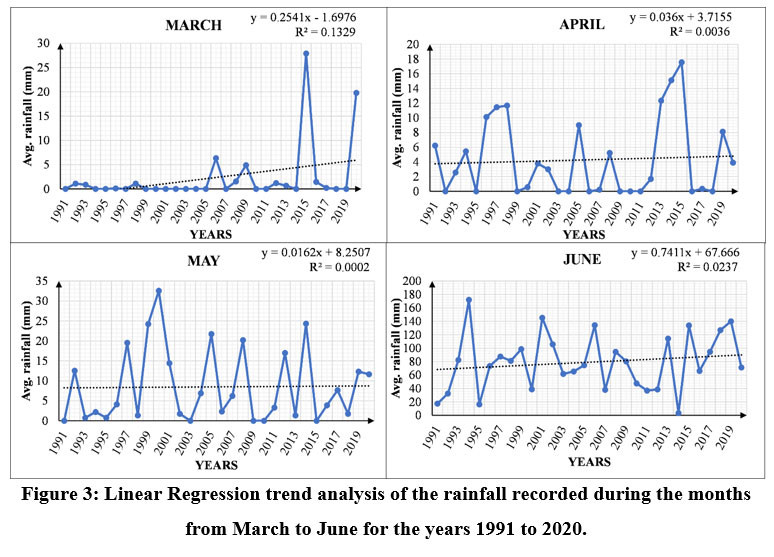 | Figure 3: Linear Regression trend analysis of the rainfall recorded during the months from March to June for the years 1991 to 2020.
|
The trend shows the positive slope in the months of March (0.2541), April (0.036), May (0.0162), and June (0.7411), representing the steadily increasing average rainfall in these months, as shown in Figure 3. All four months fall under the summer season category, where low rainfall occurs, but sometimes light rain (premonsoon rainfall) occurs along with dust storms. The observations show high variation in rainfall amount, and the amount of rainfall continuously increases over time.
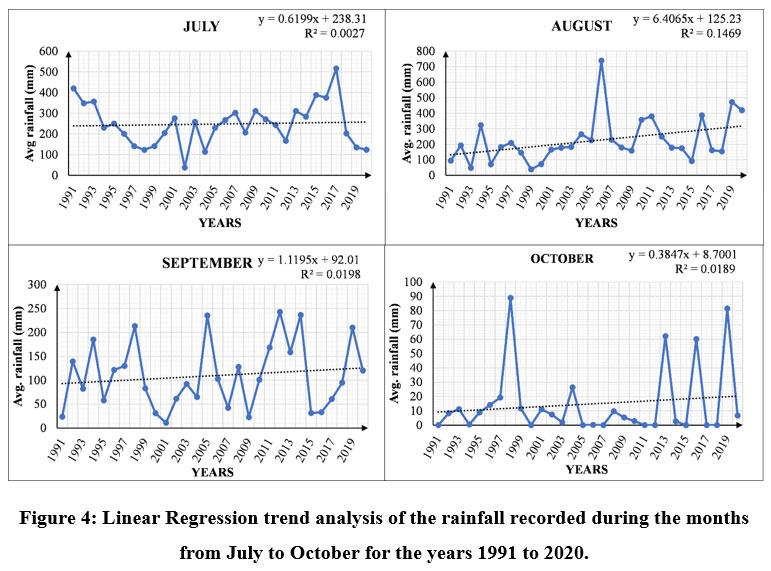 | Figure 4: Linear Regression trend analysis of the rainfall recorded during the months from July to October for the years 1991 to 2020.
|
The linear regression trend shows a positive slope in the months of July, August, September, and October which are 0.6199, 6.4065, 1.1195, and 0.3847 respectively. The highest average rainfall observed in the months of July, August, September, and October are 516.28 mm (2017), and 739.44 mm (2006), 242.56 mm (2012), and 88.89 mm (1998), respectively, while the minimum rainfall is 37.78 mm (2002) and 38.78 mm (1999), 10.78 mm (2001) and 0.00 respectively, as shown in Figure 4. The high variation in rainfall occurs from July to October due to the southwest monsoon (Winds blowing from the southwest direction (from the Arabian Sea) bring moisture with them, which it rains). The observations suggest that high rainfall occurred in these months of the rainy season.
Table 5: Monthly average rainfall for seasonal and annual basis for the Udaipur district from 1991 to 2020.
| Year | Winter (mm) | Summer (mm) | Rainy (mm) | Annual (mm) |
| 1991 | 1.31 | 5.94 | 134.50 | 47.25 |
| 1992 | 1.81 | 11.53 | 172.14 | 61.82 |
| 1993 | 1.80 | 21.67 | 124.39 | 49.29 |
| 1994 | 2.33 | 44.96 | 185.00 | 77.43 |
| 1995 | 9.19 | 4.31 | 97.11 | 36.87 |
| 1996 | 0.78 | 21.97 | 129.58 | 50.78 |
| 1997 | 2.00 | 29.67 | 124.92 | 52.19 |
| 1998 | 0.00 | 23.81 | 142.86 | 55.56 |
| 1999 | 2.83 | 30.69 | 68.67 | 34.06 |
| 2000 | 0.00 | 17.97 | 77.00 | 31.66 |
| 2001 | 0.00 | 40.86 | 115.97 | 52.28 |
| 2002 | 2.83 | 27.67 | 71.19 | 33.90 |
| 2003 | 6.92 | 15.44 | 133.86 | 52.07 |
| 2004 | 0.22 | 18.06 | 117.69 | 45.32 |
| 2005 | 0.00 | 26.33 | 172.78 | 66.37 |
| 2006 | 0.28 | 35.72 | 277.42 | 104.47 |
| 2007 | 1.94 | 11.14 | 143.67 | 52.25 |
| 2008 | 2.06 | 30.39 | 130.78 | 54.41 |
| 2009 | 0.75 | 21.33 | 124.58 | 48.89 |
| 2010 | 22.78 | 11.89 | 183.33 | 72.67 |
| 2011 | 0.08 | 10.06 | 198.08 | 69.41 |
| 2012 | 0.00 | 14.61 | 164.83 | 59.81 |
| 2013 | 1.11 | 32.17 | 177.36 | 70.21 |
| 2014 | 5.75 | 10.75 | 174.42 | 63.64 |
| 2015 | 2.06 | 44.86 | 127.89 | 58.27 |
| 2016 | 0.00 | 17.88 | 213.85 | 77.24 |
| 2017 | 0.75 | 25.69 | 184.71 | 70.38 |
| 2018 | 0.00 | 32.17 | 112.89 | 48.35 |
| 2019 | 1.28 | 40.11 | 224.56 | 88.65 |
| 2020 | 0.08 | 26.64 | 167.53 | 64.75 |
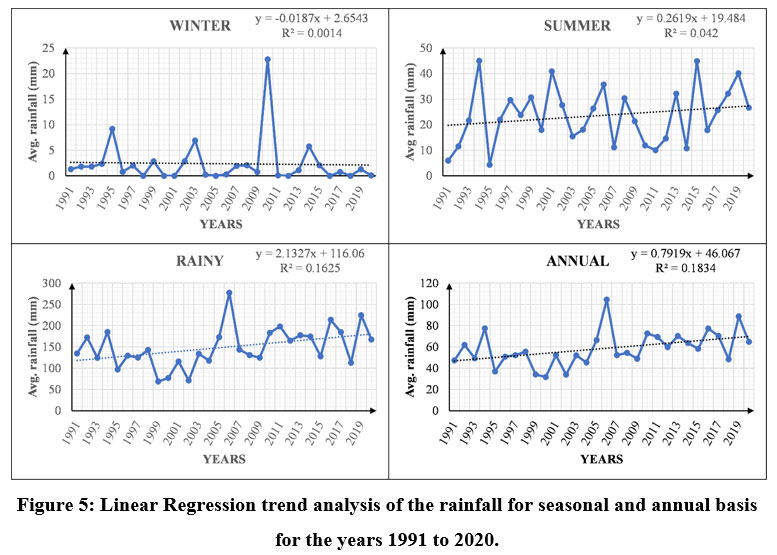
 | Figure 5: Linear Regression trend analysis of the rainfall for seasonal and annual basis for the years 1991 to 2020.
|
The linear regression trend analysis of rainfall variability for thirty-year data for seasonal and annual average rainfall for the Udaipur district is shown in Table 5 and Figure 5. The precipitation trend for winter shows a negative slope (-0.0187), which indicates no rainfall except in some exceptional cases of mawath (winter rainfall). The observations suggest that almost negligible rainfall took place in the winter season, with some exceptions in 1995 (9.19 mm), 2003 (6.92 mm), and 2010 (22.78 mm). The trend of linear regression analysis for the summer average rainfall data shows a positive slope (0.2619) that the average rainfall has increased over time during the study period. The low rainfall takes place in summer, but sometimes light rain (premonsoon rainfall) occurs along with dust storms. The observations show that the highest annual rainfall was observed in 1995, with a magnitude of 44.96 mm and in 1995, with a magnitude of 4.31 mm. In the rainy season, the precipitation trend shows a positive slope (2.1327), showing that the mean rainfall has steadily increased over time. The high variation in rainfall occurs in the rainy season due to the southwest monsoon (Winds blowing from the southwest direction (from the Arabian Sea) bring moisture with them, which it rains). The observations show high variation in rainfall amount was found with a magnitude of 277.4 mm of the highest annual rainfall in 2006 and 71.19 mm in 2002 with the lowest annual rainfall.
The trend of average annual rainfall exhibits a positive slope (0.7919), indicating that average rainfall continuously increases with time during the study period. The observations from 30 years of annual data show that the highest mean annual rainfall amount was found to be 104.47 mm in 2006, and the lowest mean annual rainfall in 2002 was 33.90 mm.
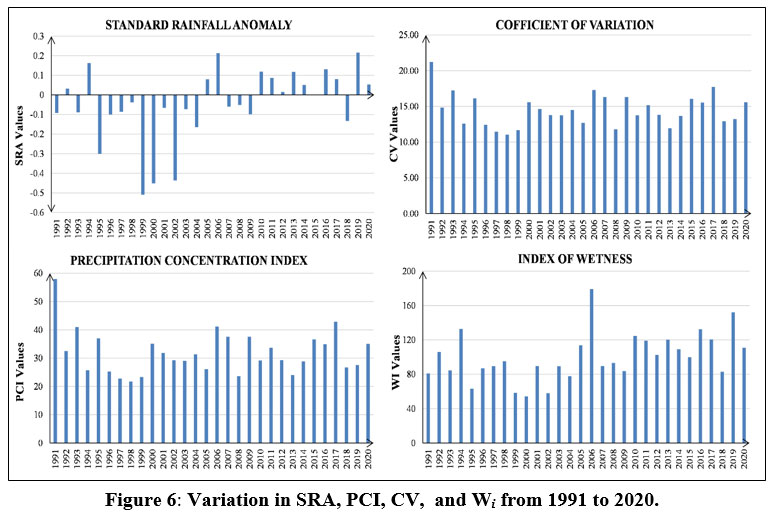
 | Figure 6: Variation in SRA, PCI, CV, and Wi from 1991 to 2020.
|
The precipitation indices such as NAR, PCI, SRA, , CV, and Dependable rainfall are calculated and described in this section.
The variation in the values of SRA, CV, PCI, and Wi is shown in Figure 6. The highest value of PCI indicates non-uniformity of rainfall and the lowest value indicates uniformity. The PCI values from 1991 to 2020 ranged from 21.74 to 57.92, indicating high non-uniformity of rainfall over the study area. The minimum value of SRA was -0.509 observed in 1999, indicating zero probability of drought. The SRA values are greater than -0.84 (No drought category) for each year during the study period; hence, the study area can not fall under the category of drought-prone area.
A wetness index of more than 100 exhibits more excess rainfall than normal annual rainfall in a given year. Wetness index less than 100 were considered for the estimation of deficiency of rainfall in a year during the study period. The deficiency of rainfall took place only four years out of 30 years of the study period, 1995 (36.80), 1999 (41.61), 2000 (45.12), and 2002 (41.89), which fall under the category of significant deficiency. Sufficient rainfal has been recorded for the rest of the study period, implying no rainfall deficiency in the Udaipur district. The highest value of the wetness index was found in the year 2006 ( = 179.07), while the lowest value occurred in 2000 ( = 54.26). Hence, 2006 was the wettest year and 2000 was the driest year during the study period i.e., due to the maximum and minimum rainfall that took place at that time.
The coefficient of variation shows the rainfall variability over a particular year. The percentage CV value for 30 year of precipitation was 20.33% (1991-2020), while percentage CV was recorded as 36.48% (1975-2013), 31.10% (1957-2016), and 30.35% (1973-2011) as per previous studies. The overall CV values vary from 11.04 to 21.23, indicating less rainfall variability over the Udaipur district. The overall CV and PCI values show a high non-uniformity and less rainfall variability. The average, maximum, and minimum values of precipitation indices and rainfall, are shown in Table 6.
Table 6: Precipitation Indices and average rainfall values.
| Precipitation indices | Average | Max | Min |
| Annual Total Rainfall | 700.10 mm | 1253.67 mm | 379.89 mm |
| PCI | 31.94 | 57.92 | 21.74 |
| Monthly Monsoon Average | 149.12 mm | 277.42 mm | 68.67 mm |
| Monsoon Percentage | 85.20 mm | 95.13 mm | 67.19 mm |
| CV | 14.50 | 21.23 | 11.04 |
| SRA | -0.05 | 0.22 | -0.51 |
| 100.00 | 179.07 | 54.26 |
Table 7: Regression slope and sen’s slope for each month along with monthly rainfall dependability.
| Month | Linear Slope | Sen’s slope | Dependable rainfall | ||
| 50% | 70% | 90% | |||
| Jan | -0.10 | 0.00 | 0.00 | 0.00 | 0.00 |
| Feb | -0.08 | 0.00 | 0.00 | 0.00 | 0.00 |
| Mar | 0.25 | 0.00 | 0.00 | 0.00 | 0.00 |
| Apr | 0.04 | 0.00 | 2.56 | 0.00 | 0.00 |
| May | 0.02 | 0.06 | 4.11 | 1.33 | 0.00 |
| Jun | 0.74 | 1.26 | 80.44 | 43.17 | 32.44 |
| Jul | 0.62 | 0.61 | 249.89 | 183.72 | 123.67 |
| Aug | 6.41 | 5.92 | 182.56 | 156.78 | 72.67 |
| Sept | 1.12 | 1.27 | 101.00 | 59.28 | 30.89 |
| Oct | 0.38 | -0.02 | 6.67 | 0.00 | 0.00 |
| Nov | 0.11 | 0.00 | 0.00 | 0.00 | 0.00 |
| Dec | 0.00 | 0.00 | 0.00 | 0.00 | 0.00 |
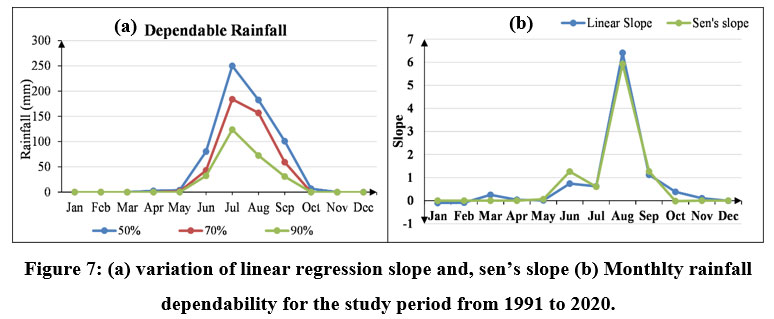 | Figure 7: (a) variation of linear regression slope and, sen’s slope (b) Monthlty rainfall dependability for the study period from 1991 to 2020.
|
The linear regression, and Mann-Kendall trend test for rainfall variability over the Udaipur district follow the same trend from January to December for thirty-year (1991-2020). The values of linear slope and sen’s slope (determined from Mann Kendall trend test) are nearly the same from January to December, which verified that the rainfall trend is correct. Dependence on rainfall is essential for the sustainable use, and conservation of water. Therefore, dependable rainfall (50%, 75%, and 90%) for all months of the year was calculated and shown in Table 7 and Figure 7. The maximum precipitation occurs in the region due to the southwest monsoon (July, August, September, and October), which is necessary to fulfil the water demand required for the rest months.
Conclusion
Rainfall variability in Udaipur district, Rajasthan (India), has been analysed from 1991 to 2020 by linear regression, Mann–Kendall trend, and various rainfall indices. This analysis shows a wide disparity in rainfall distribution. Udaipur district receives about 85.20% of the total annual rainfall through the southwest monsoon during the rainy season. The trend tests shows a positive trend for most months (May to November) for the period of investigation over the past three decades. As a result, it shows an increasing total annual rainfall during the study period.
The PCI values indicate a very high non-uniformity of rainfall, and CV values indicate less rainfall variability over the Udaipur district from 1991 to 2020. The overall CV and PCI values show a high non-uniformity and less rainfall variability. The SRA values are greater than -0.84 (No drought category) for each year during the study period; hence, the study area can not fall under the category of drought-prone area. The highest value of the wetness index was found in the year 2006 ( Wi= 179.07), while the lowest value occurred in 2000 ( Wi = 54.26). Hence, 2006 was the wettest year and 2000 was the driest year during the study period the Udaipur district falls under the category of low rainfall deficiency with some exceptions. The maximum precipitation occurs in the region due to the southwest monsoon (July to October), which is necessary to fulfil the water demand required for the rest of the months. The current study helps ensure the availability of rainwater for the Udaipur district in the future for various demands like agricultural, industrial, and domestic water supply and hydropower generation. A significant trend has been observed in the annual rainfall of Udaipur from June to September during the study period, from which it can be predicted that it may increase in the future. Therefore, the main requirement to reduce the risk of flooding is the proper building and administration of water reservoirs, as well as the use of contemporary rainwater harvesting systems and drainage management.
Acknowledgement
We are grateful to the Water Resources Department, Rajasthan for providing rainfall data for the study.
Conflict of Interest
There is no conflict of interest between the authors.
Funding Sources
Highly obliged to University Departments, RTU, Kota (India), for providing financial support to this study.The reference number of the Reimbursement of APC is - No. F(101)Gr.1/12/DFA/2021/8191-8206
References
- Swain S., Patel P., Nandi S. A Multiple Linear Regression Model for Precipitation Forecasting over Cuttack District, Odisha, India. In: 2nd International Conference for Convergence in Technology (I2CT). ; 2017:355-357. DOI: 10.1109/I2CT.2017.8226150
CrossRef - Deka S. Statistical analysis of long-term rainfall trends in Cherrapunji, Meghalaya, India. Journal of Applied and Natural Science. 2021;13(1):170-177. doi:10.31018/jans.v13i1.2442
CrossRef - Udayashankara T. H., Sadashiva Murthy B. M., Madhukar M. Impact of climate change on rainfall pattern and reservior level. Journal of Water Resource Engineering and Management. 2016;3(1):10-14.
- Pal A. B., Khare D., Mishra P. K., Singh L. Trend Analysis of Rainfall, Temperature and Runoff Data: a Case Study of Rangoon Watershed in Nepal. International Journal of Students’ Research in Technology & Management. 2017;5(3):21-38. doi:10.18510/ijsrtm.2017.535
CrossRef - Tarmizi A. H. A., Rahmat S. N., Karim A. T. A., Tukimat N. N. A. Climate change and its impact on rainfall. International Journal of Integrated Engineering. 2019;11(1):170-177. doi:10.30880/ijie.2019.11.01.020
CrossRef - Amarasinghe A. G. Analysis of Long-Term Rainfall Trends in Sri Lanka Using CHRIPS Estimates. American Journal of Multidisciplinary Research & Development. 2020; 2(11): 34-44. www.ajmrd.com
- Trenberth K. E. Changes in precipitation with climate change. Climate Research. 2011;47(1-2):123-138. doi:10.3354/cr00953
CrossRef - Longobardi A., Villani P. Trend analysis of annual and seasonal rainfall time series in the Mediterranean area. International Journal of Climatology. 2010;30(10):1538-1546. doi:10.1002/joc.2001
CrossRef - Velasco L. C., Aca-Ac J. M., Cajes J. J., Lactuan N. J., Chit S. C. Rainfall Forecasting Using Support Vector Regression Machines. International Journal of Advanced Computer Science and Applications. 2022;13(3):231-237. www.ijacsa.thesai.org
CrossRef - Vivekanandan N. Statistical Analysis of Rainfall Data and Estimation of Peak Flood Discharge for Ungauged Catchments. International Journal of Innovative Research in Computer Science & Technology(IJIRCST). 2016;4(2):34-37. https://ssrn.com/abstract=3535013
- IPCC. Climate Change 2021 The Physical Science Basis Summary for Policymakers Working Group I Contribution to the Sixth Assessment Report of the Intergovernmental Panel on Climate Change.; 2021.
- Geneti T. Z. Review on the Effect of Moisture or Rain Fall on Crop Production. Civil and Environmental Research. 2019;11(2). doi:10.7176/CER
CrossRef - Panda A., Sahu N. Trend analysis of seasonal rainfall and temperature pattern in Kalahandi, Bolangir and Koraput districts of Odisha, India. Atmospheric Science Letters. 2019;20(10). doi:10.1002/asl.932
CrossRef - Swain S., Verma M., Verma M. K. Statistical Trend Analysis of Monthly Rainfall for Raipur District, Chhattisgarh. International Journal of Advanced Engineering Research and Studies. 2015;IV(II):87-89.
- Singh O. P., Singh S. S., Kumar S. Rainfall Profile of Udaipur.
- Kumar P., Kuldeep., Gautam N. An assessment of ambient air quality using AQI and exceedance factor for Udaipur City , Rajasthan ( India ). In: WEENTECH Proceedings in Energy. Vol 7. ; 2021:94-106. doi:10.32438/WPE.102021
CrossRef - District census handbook Kota. -Village and Town Wise Primary Census Abstract (PCA). Directorate of Census Operations, Rajasthan; 2011.
- Bhakar S. R., Iqbal M., Devanda M., Chhajed N., Bansal A. K. Probability Analysis of Rainfall at Kota. Indian Journal of Agricultural Research. 2008;42(3):201-206, 2008.
- Chaplot B. Water Conditions in Udaipur: The City of Lakes. Indian Journal of Regional Science . 2018;1(1). https://www.researchgate.net/publication/328272292
- Rana S., Deoli V., Kashyap P. S. Temporal analysis of rainfall trend for Udaipur district of Rajasthan. Indian Journal of Ecology. 2019;46(2):306-310.
- MSME-Development Institute. Brief Industrial Profile of Udaipur District. http://dcmsme.gov.in/old/dips/DIPR_Udaipur.pdf
- Sanikhani H., Kisi O., Mirabbasi R., Meshram S. G. Trend analysis of rainfall pattern over the Central India during 1901–2010. Arabian Journal of Geosciences. 2018;11(15). doi:10.1007/s12517-018-3800-3
CrossRef - Subash N., Sikka A. K. Trend analysis of rainfall and temperature and its relationship over India. Theoretical and Applied Climatology. 2014;117(3-4):449-462. doi:10.1007/s00704-013-1015-9
CrossRef - Zakwan M., Ara Z. Statistical analysis of rainfall in Bihar. Sustainable Water Resources Management. 2019;5(4):1781-1789. doi:10.1007/s40899-019-00340-3
CrossRef - Saini A., Sahu N., Kumar P., Nayak S., Duan W., Avtar R., Bahera S. Advanced rainfall trend analysis of 117 years over west coast plain and hill agro-climatic region of India. Atmosphere (Basel). 2020;11(11):1-25. doi:10.3390/atmos11111225
CrossRef - Arvind G., Kumar A. P, Karthi G. S, Suribabu C. R. Statistical Analysis of 30 Years Rainfall Data: A Case Study. In: IOP Conference Series: Earth and Environmental Science. Vol 80. Institute of Physics Publishing; 2017. doi:10.1088/1755-1315/80/1/012067
CrossRef - Ezenwaji E. E., Nzoiwu C. P., Chima G. N. Analysis of Precipitation Concentration Index (PCI) for Awka Urban Area, Nigeria. Hydrology: Current Research. 2017;08(04). doi:10.4172/2157-7587.1000287
CrossRef - Ayanlade A., Radeny M., Morton J. F., Muchaba T. Rainfall variability and drought characteristics in two agro-climatic zones: An assessment of climate change challenges in Africa. Science of the Total Environment. 2018;630:728-737. doi:10.1016/j.scitotenv.2018.02.196
CrossRef - Norbu S., Basnet J. B. Seasonal rainfall trend and annual rainfall variability analysis for selected Meteorological stations in Bhutan. https://ssrn.com/abstract=4027295
- Biswas B., Jadhav R. S., Tikone N. Rainfall Distribution and Trend Analysis for Upper Godavari Basin, India, from 100 Years Record (1911–2010). Journal of the Indian Society of Remote Sensing. 2019;47(10):1781-1792. doi:10.1007/s12524-019-01011-8
CrossRef


