Assessment of ground water quality in and around Industrial areas in Aurangabad district of Maharashtra
Sumantrao B. Bikkad1 and Sunil R. Mirgane1 *
http://dx.doi.org/10.12944/CWE.4.1.28
The suitability of water for various domestics and potable uses was studied by analyzing samples from different bore well sampling sites, located in and around industrial areas in Aurangabad. The physico-chemical parameter of above sampling sites indicates that domestically used water is much more polluted. Maximum samples have high EC. TDS. TH. TA. Cl- . Ca++. COD. Values exceeding the permissible limits for drinking purpose. It is observed that the main sources of the pollution are due to industrial waste water, municipal sewage and lack of sanitation.
Copy the following to cite this article:
Bikkad S.B, Mirgane S.R. Assessment of ground water quality in and around Industrial areas in Aurangabad district of Maharashtra. Curr World Environ 2009;4(1):175-178 DOI:http://dx.doi.org/10.12944/CWE.4.1.28
Copy the following to cite this URL:
Bikkad S.B, Mirgane S.R. Assessment of ground water quality in and around Industrial areas in Aurangabad district of Maharashtra. Curr World Environ 2009;4(1):175-178. Available from: http://www.cwejournal.org/?p=929
Download article (pdf)
Citation Manager
Publish History
Introduction
Aurangabad District is located mainly in Godavari Basin and its some part towards North West of Tapi River Basin. This District’s general down level is towards South and East and North West part comes in Purna –Godavari river basin. The Aurangabad district’s North Longitude ( Degree) is 19 and 20 and East Longitude (Degree ) is 74 to 76.
Aurangabad is a success story of MIDCs efforts towards a balanced industrialization of the state. A city with no industrial background is today a thriving hub of industrial activity. Today Aurangabad has a renowned industrial area and is divided into four zones namely Chikalthana, Waluj, Chitegaon & Shendra. The industrialization in Aurangabad started in mid 70’s with companies like Lupin, API, Nirlep & Garware. The major industry sectors in Aurangabad are Automotive, Auto Components, Pharmaceuticals, Breweries, White goods/Appliances. Chikalthana, Waluj, Chitegaon and Shendra industrial zones were selected for the purpose of investigation. Many illiterate workers live near the industries and use bore well water for their domestic activities. So examinations of these water resources for various water quality parameters and ascertain their quality with respect to drinking water is of worth importance.
Material and Methods
Sixteen ground water samples were collected randomly selected from study area in the month of December 2007(winter) with all precautions and preserved as per the recommended procedures.1 For sampling, bore wells, pump were permitted to flow for more than 10 min and required quantity of water was collected in pre-cleaned polythene containers and immediately.2
All chemicals (AR grade or Equivalent grade) and double distilled (DD) water (free from CO2) were used to prepare standard solutions3 and determination of Water Quality Parameters (WQPs). Graduated pipettes and standard measuring flasks used in the present investigation were calibrated at room temperature (30 ± 0.1 0C) before use.
WQPs such as temperature, pH, and electrical conductivity were determined in the field it-self. The other WQPs were determined within 48-72 hour from the time of collection of sample.
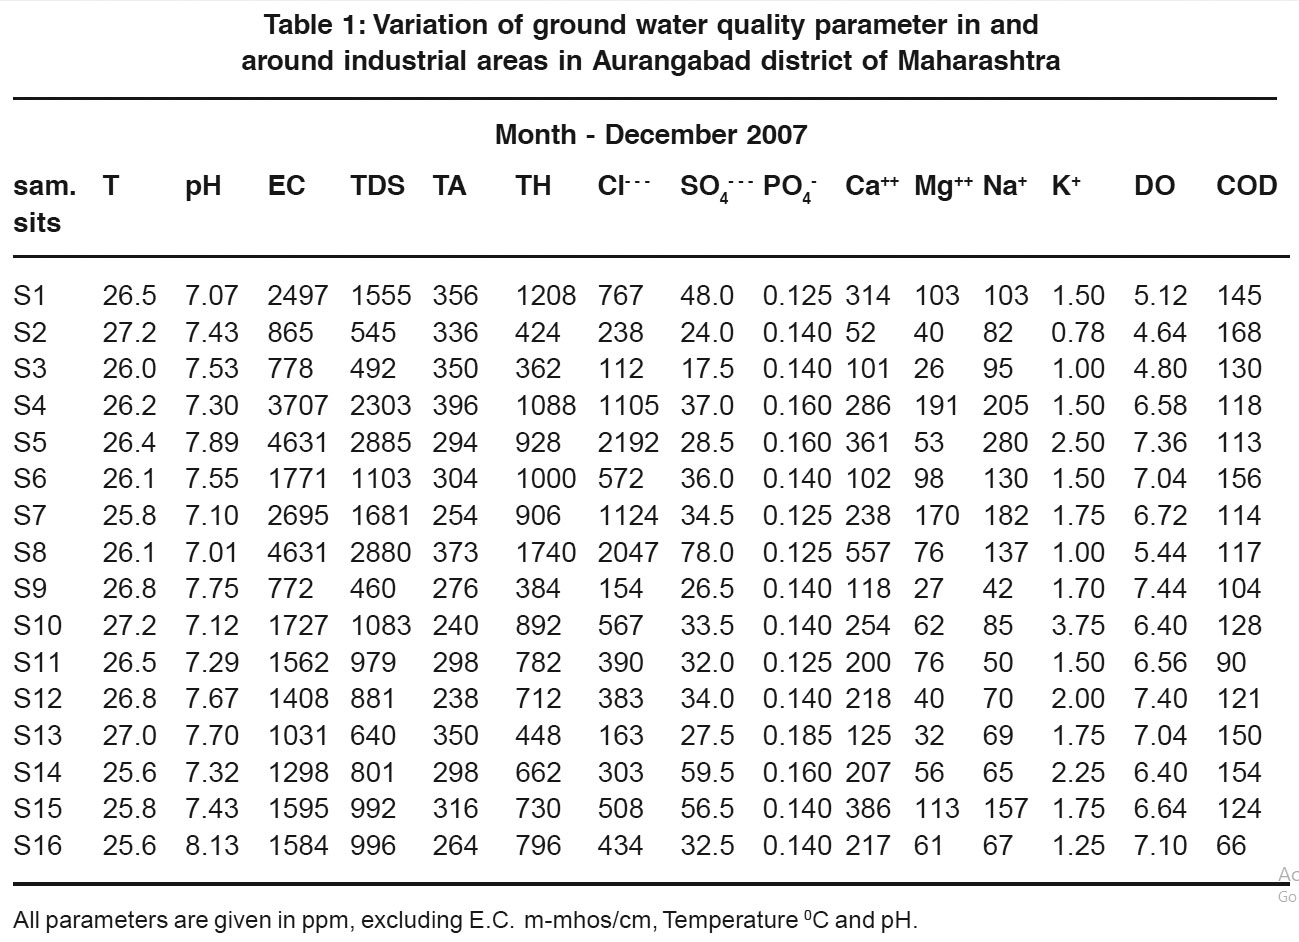 |
Table 1: Variation of ground water quality parameter in and around industrial areas in Aurangabad district of Maharashtra Click here to view table |
Results and Discussion
Values reported in Table 1 are the values of (winter season) December-2007. A rise in temperature of the water leads to the speeding up of the chemical reactions in water, reduces the solubility of gases and amplifies the taste and odors.4 At elevated temperature metabolic activity of the organism increases requiring more oxygen but at the same time the solubility of oxygen decreases thus accentuating the trace.5 In the present study temperature of the ground water vary from 25.6°C to 27.2°C. Chemical and biological reactions are directly dependent upon the pH of water system. The pH of ground water obtained in range from 7.01 to 8.13. In the present work conductivity of ground water samples are in the range from 772.00 to 4631.00 mmhos/cm all the water samples are found to be well above the permissible limit (300 mhos/cm) as per BIS. In the present work, TDS of ground water samples are in the range 488 to 2885 ppm. The observed variation in result may be due to weathering of soil and rock. The water with high solid contents are of inferior palatability and may due to unfavorable physiological reactions in the transient consumers.6 The high TDS levels (7500 ppm) will result in the excessive scaling in water distribution system. The alkalinity values are found to be in the range 240 ppm to 373 ppm. All samples are above permissible limit, 200 ppm, prescribed by BIS7 and ICMR.8 All the water samples in study area are very hard (>180 ppm). Most of the water samples can not be used for drinking purposes even in absence of other source (TH<600) except sample number S2, S3, S9 and S13. High chlorides contents in drinking water may also be the root cause for sodium sensitive hypertension in human being. Pollution through human faces, domestic sewage, bathing are the most important factors which increases the chlorides content.
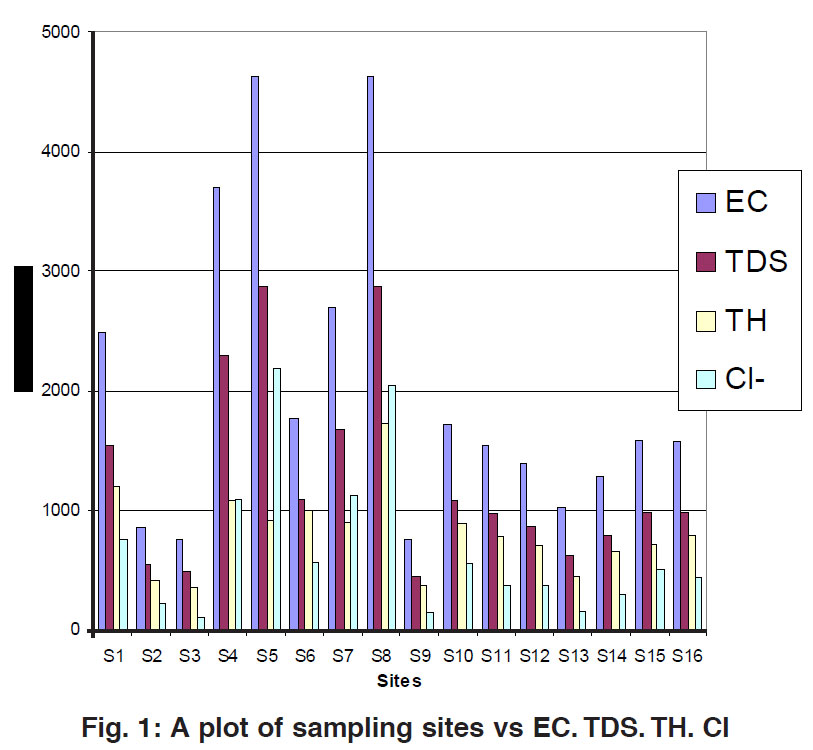 |
Figure 1: A plot of sampling sites vs EC. TDS. TH. Cl ​​​​​​​Click here to view figure |
Chloride contents (Cl-) are found to be ranging from 112.0 to 2047.0 ppm. The sulphate ions are found to be below permissible limit, 200 ppm concentration, in all samples studied. In the present work phosphate ion concentration vary from 0.125 to 0.185 which is well within the limit. Water with calcium content about 25 ppm is classified as calcium rich water. High calcium contents in summer months may be due to rapid oxidation of organic matter in the substrate.
In the present investigation calcium concentration varies from 101.00 to 557.00 ppm. All the water samples studied in the present work are above permissible limit, 75 ppm. In the present work magnesium in ground water varies from 26.0 ppm to 170.0 ppm. All the values are well above permissible limit (20 ppm). Sodium content more than 50 ppm make the water unsuitable for drinking purpose. In the study area all samples are not suitable for drinking purpose except sample no. S9 as BIS9 and WHO.10 Concentration of potassium is less than 50 ppm in all the cases studied indicating that the water is suitable for drinking purpose. Taste for dissolved oxygen is generally not carried out for unpolluted waters. It is applied mainly for determining the D.O. of polluted waters and industrial effluents and constitutes a means of controlling pollution of water courses.11 The taste is an indicator of the purity achieved during treatments such as activated sludge process and oxidation ponds etc. Deficiency of oxygen in receiving waters give rise to odoriferous products of an anaerobic decomposition. During present work dissolved oxygen ranges from 4.64 ppm to 7.44 ppm. Chemical oxygen demand, as the name implies is the oxygen requirement of a sample for oxidation of organic and inorganic matter. As the oxidisable inorganic matter is usually negligible in comparison with the quality of organic matter. COD is generally considered as the oxygen equivalent of the amount of organic matter oxidisable by the Potassium dichromate.
In the present work COD values vary from 60 ppm to 168 ppm. Higher values of COD are observed in some of the cases indicating high organic pollution.
Conclusion
Bore well water samples under investigation are generally used for domestic purpose and only some time for drinking purpose. But looking at the results obtained it can be concluded that bore well water is contaminated and should not be used for drinking purpose without pretreatment.
Acknowledgements
The author takes this opportunity to thanks Dr. R. S. Agrawal Principal, Dr. S. M. Deshpande Head P. G. Dept. of chemistry J.E.S. college, Jalna. for providing laboratory facility.
Sampling Site
S1 Public Bore well, near Mosque, Powerloom Area, Chikalthana, MIDC, Aurangabad.
S2 Bore well in Deogiri Chemical compound, Chikalthana MIDC, Aurangabad.
S3 Public Bore well near Skoda India Ltd., Shendra V-Star Industrial Area, Aurangabad.
S4 Public Bore well near ‘Buddha Vihar’, Shendra Village, Aurangabad.
S5 Public Bore well near Sterlite Industry Hanuman temple, MIDC, Waluj, Aurangabad.
S6 Public Bore well near ‘Tathe Grocery Shop’, Main Road, Ranjangaon, MIDC, Waluj, Aurangabad.
S7 Public Bore well near Bus Stand, Ranjangaon, MIDC, Waluj, Aurangabad.
S8 Public Bore well in Z.P. School, Ranjangaon, MIDC, Waluj, Aurangabad.
S9 Public Bore well in Ambedkar Nagar, Jogeshwari, MIDC, Waluj, Aurangabad.
S10 Public Bore well near village panchayat, Jogeshwari, MIDC, Waluj, Aurangabad.
S11 Public Bore well near New Year Tyre Industry, Ghanegaon, MIDC, Waluj, Aurangabad.
S12 Public Bore well infront of Bus stand, Sajapur, MIDC, Waluj, Aurangabad.
S13 Public Bore well in Chhatrapati Colony, Wadgaon, MIDC, Waluj, Aurangabad.
S14 Public Bore well near village panchayat, Pandharpur, MIDC, Waluj, Aurangabad.
S15 Public Dug well in slum area of Pandharpur, MIDC, Waluj, Aurangabad.
S16 Public Bore well near Bus stand, Chitegaon, MIDC, Aurangabad.
References
1. Standard methods of water and waste water analysis,13th edn.American Public Health Association,Washington,D.C.(1971)
2. Manivasakam N Physico-chemical examination of water and sewage and industrial effluents.Pragati prakashan, Meeret. (India) (1996)
3. A.I.Vogel,Text Book of Quantitative Inorganic Analysis. 2nd, Longman and Green Co., London, 191 (1985).
4. Trevadi R.K. and Goel P.K.,Chemical and biological methods for water pollution studies,environmental publication, Karad. (India) (1986).
5. D. Kelein, River Pollution Chemical Analysis, Butter Worth Scientific Publication, London, U.K. (1959)
6. Nirmal Kumar, H. Bhatt I, R.N. Kumar and M. Patel, J. Indian, Environ. Protec. (2003) 23(11): 1248-1253.
7. BIS, Standards for Water for Drinking and Other Purposes, Beauru of Indian Standards, India, (1983)
8. CMR ‘Manual of Standards of Quality for Drinking Water Supplies’, Spl. Rep. S.No. 44, ICMR, New Delhi (India), (1975).
9. BIS, Bureau of Indian standards Specifications for drinking water, IS, 10500, New Delhi, India, (1991).
10. (WHO) World Health Organization, Guidelines for Drinking Water Quality, Recomendations of WHO; Geneva (1984 and 1996) 1: 1-130
11. M.Z.Hassan and S.P.Pande, J. Indian Water Works Associ. (1993) 16:265.


