Correlation study on physico-chemical parameters and quality assessment of ground water of Thane region, Maharashtra
Mirgane Sunil Ramarao1 * and Bhagure Ganesh Ramdas2
1
Department of Chemistry,
J.E.S.College Jalna,
Maharashtra
India
2
Department of Chemistry,
Dnyanasadhana College,
Thane,
400 604
India
http://dx.doi.org/10.12944/CWE.4.1.12
Thane is the third most industrialized district in the Maharashtra state. The area is characterized by hard water and high salinity hazard due to it’s proximity and hydraulic connection with the sea. Therefore an Attempt has been made to assess the physico-chemical Parameters of ground waters of Thane Region, Maharashtra during Oct. Nov. 2008. Statistical studies have been carried out by calculating correlation coefficient between different pairs of parameters and t-test applied for checking significance. The observed values of physico-chemical parameters of ground water samples were compared with standard values recommended by WHO. It is found that an appreciable significant positive correlation holds for electrical conductivity with Na, Cl- and T.D.S. total hardness with Ca and Mg, pH with C.O.D. T.D.S. with Na, Cl-. Negative correlation was found between electrical conductivity and nitrate, with SO42- and nitrate,Total hardness with C.O.D. All the physico-chemical parameters of ground water of Thane region are within the highest desirable limit or maximum permissible limit set by WHO, except chemical oxygen demand, total hardness and alkalinity values for most the ground water samples
Copy the following to cite this article:
Ramarao M.S, Ramdas B.G. Correlation study on physico-chemical parameters and quality assessment of ground water of Thane region, Maharashtra. Curr World Environ 2009;4(1):89-95 DOI:http://dx.doi.org/10.12944/CWE.4.1.12
Copy the following to cite this URL:
Ramarao M.S, Ramdas B.G. Correlation study on physico-chemical parameters and quality assessment of ground water of Thane region, Maharashtra. Curr World Environ 2009;4(1):89- 95. Available from: http://www.cwejournal.org/?p=897
Download article (pdf) Citation Manager Publish History
Introduction
Water is one of the materials required to sustain life. In India ponds, river water and ground water are used for domestic and agricultural purposes. Ground water is the major source of drinking water in both urban and rural areas. Ground water pollution is not due to natural factors but it has been caused by human actions. The quality of ground water may be described according to their physico chemical and micro biological characteristics. In recent years along with physico chemical characteristics of water an alternative approach based on statistical correlation has been used to develop mathematical relationship for comparision of physico chemical parameters.¹
The present study deals with the study of physico chemical parameters of ground water in Thane region of Maharashtra. The analyzed data were compared with standard values recommended by WHO. Systematic calculation of correlation Coefficient between water quality parameters has been done with the objective of minimizing the complexity and dimensionality of large set of data. The significant correlation has been further verified by using ‘t’ test.
Experimental
All the chemicals used were A. R. Grade and were purchased from S. D. fine chemicals Ltd. PH and electrical conductivity were measured by using PH meter and conductivity meter (Model Equiptronics). Dissolved oxygen, Chemical oxygen demand, total hardness, total alkalinity chloride, sulphate, phosphate nitrates calcium, magnesium, potassium and sodium were determined as per the standard procedure of APHA AWWA². Flame photometer [Model Elico CL-178] was used for determination of metal ions Na+and K+.
The statistical analysis has been performed using standard methods.³ Karl Pearson correlation coefficient (r) was calculated and correlation for significance has also been trusted by applying t-test.
22 bore wells and dug wells were selected as sampling stations from Thane Region for sampling of ground water. Each locality of ground water was sampled once in the month of Oct.-Nov. 2008. The sampling locations, source and corresponding habitats are shown in Table 1
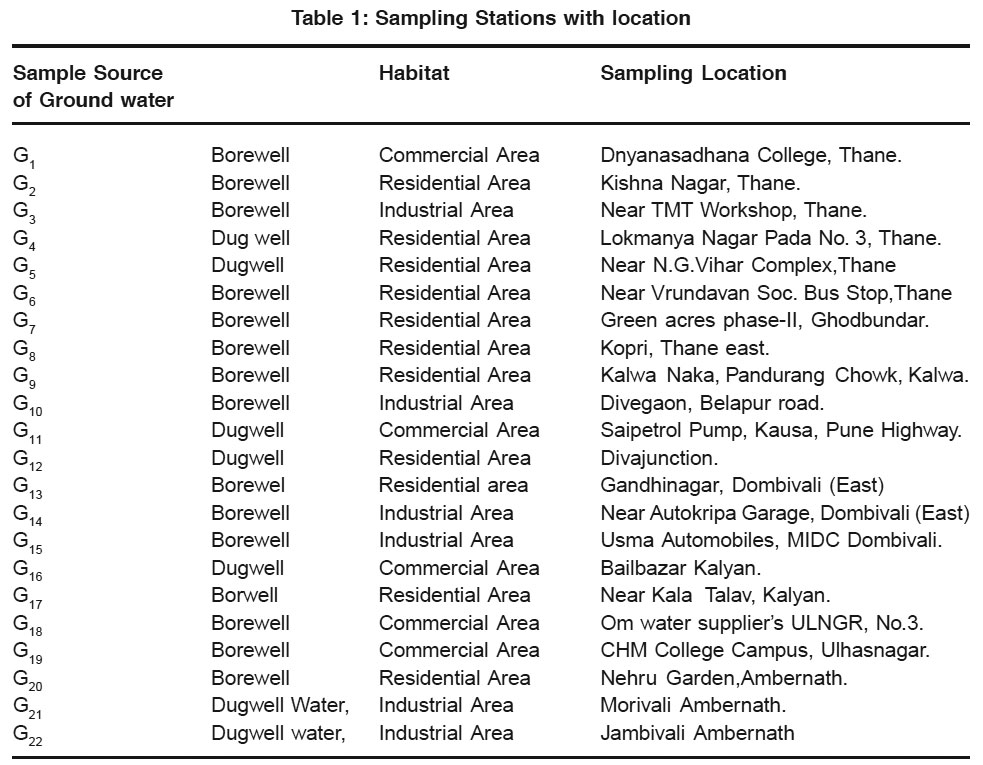 |
Table 1: Sampling Stations with location Click here to view table |
Results and Discussion
The standard and observed values of physico chemical parameters of ground water samples are presented in Table-2 & 3. The observed values of pH ranging from 7.48 to 8.52 shows that ground water samples are slightly alkaline except G14 samples (PH 5.93).
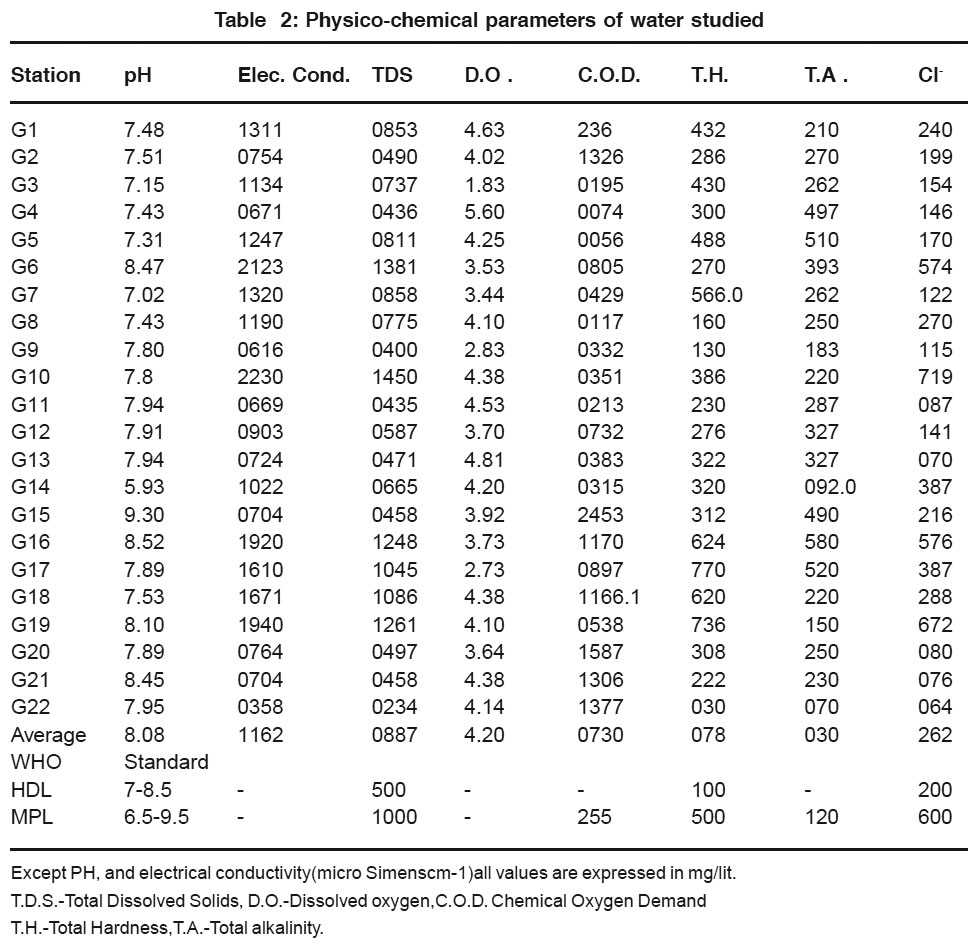 |
Table 2: Physico-chemical parameters of water studied Click here to view table |
Ground water samples G6, G10, G16, G19 contain T.D.S. more than maximum permissible limit set by WHO. Ground water samples except G6, G10, G16, & G17, G19 contain T.D.S are with in the highest desirable limit or maximum permissible limit set by WHO. Where as G6, G10, G16, G17, & G19 shows T.D.S. more than maximum permissible limit. This samples are located in industrial area which shows direct impact on these samples. Since no standard are suggested by WHO for Dissolved oxygen, electrical conductivity, sodium and potassium content for drinking water so no comparison can be made from observed values. The chemical oxygen demands values of water samples G1, G3, G4, G5 & G8 are with in the maximum permissible limit where as remaining ground water samples shows chemical oxygen demand values more than maximum permissible limits. The high values of C.O.D. may be due to contamination of well water and bore well water due to domestic and industrial waste.5
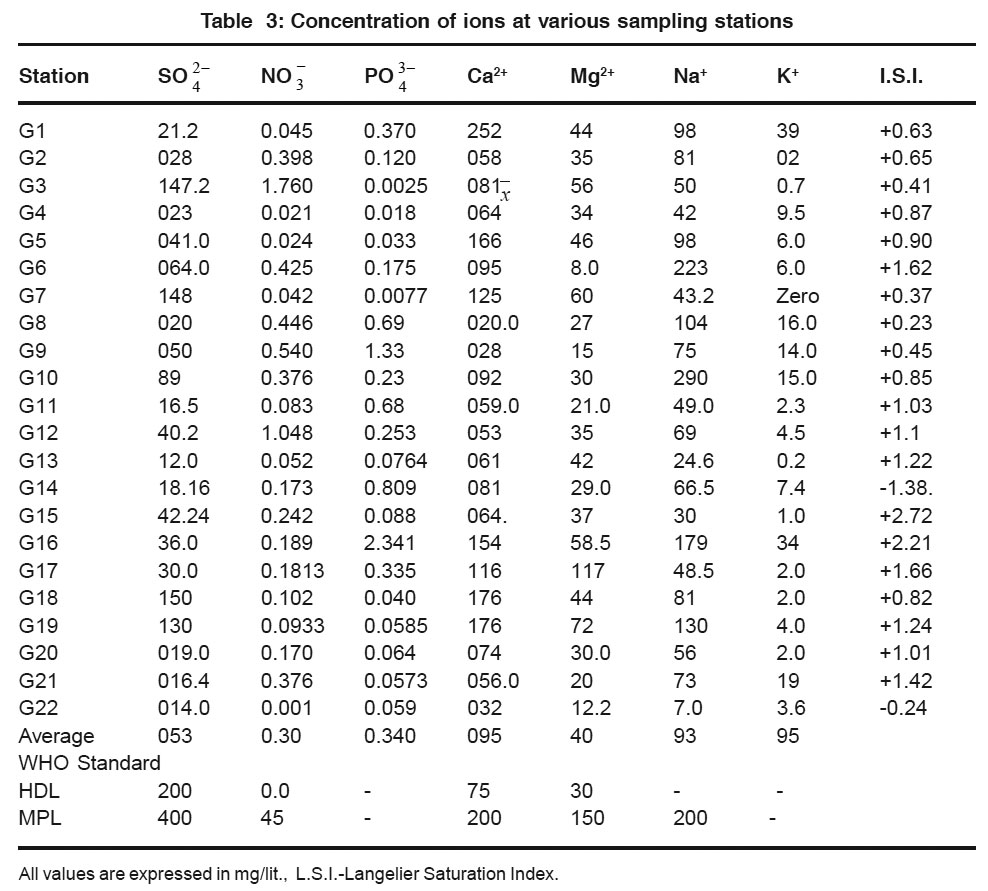 |
Table 3: Concentration of ions at various sampling stations Click here to view table |
Total Hardness (30-770 mg/lt) values of ground water samples are within the maximum permit set by WHO except Sample No. G7, G17, G18, G19. The abnormal value of Total Hardness in there sample is due to discharge of domestic sewage, paper, textile and chemical waste.6 Ground water samples nearby creak G3, G5, G7 shows high value of hardness this may be due to proximity and hydraulic connection to the creak.7
The mean value of alkalinity in the ground water of Thane Region was 300 mg/lit (Table 2) which exceeded the highest derivable limit. The value of alkalinity in water provides an idea of natural salts present in water. The alkalinity in water is due to dissolution of mineral in water from soil. The various ionic species that contribute to the alkalinity includes bicarbonate, hydroxide, phosphate and organic acids. These factors are characteristics of the source of water and processes taking place at any given time.8
Chloride
The ground water samples G6, G10, G14, G16, G17, G18 & G19 contain high value of chloride which is above the maximum permissible limit as set by WHO.High amount of chloride in these water samples may be due to natural processes such as passage of water through natural salt formation in earth or it may be an indication of pollution from industrial or domestic waste.
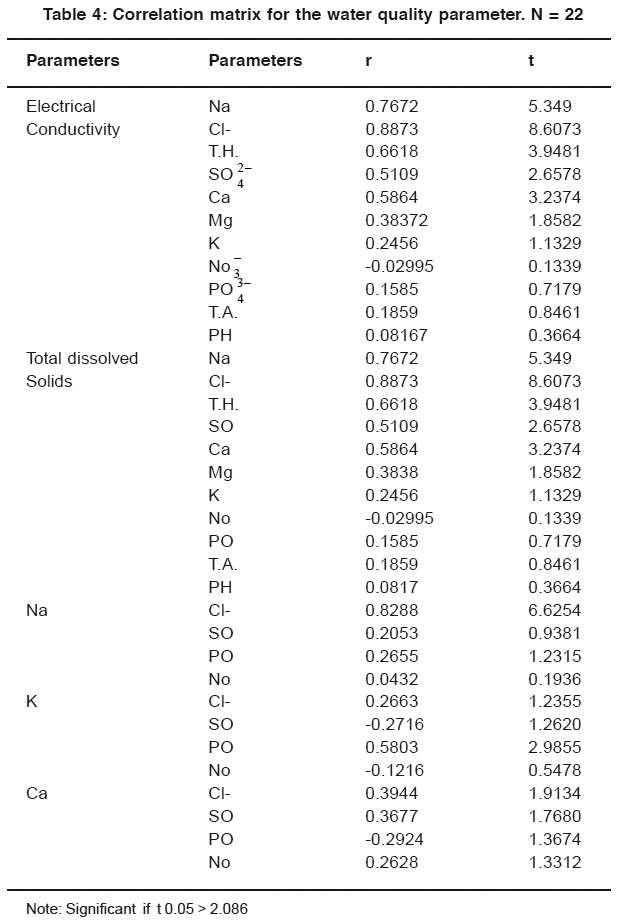 |
Table 4: Correlation matrix for the water quality parameter. N = 22 Click here to view table |
Remaining ground water sample shows chloride values with in the maximum permissible limit as set by WHO. Sulphate (70-148 mg/L) Nitrate (0.021-1.760 mg/L) Phosphate (0.018-2.341 mg/L) Calcium (32-176 mg/lit) and Magnessium (12-60 mg/L). Values of ground water samples are with in the highest desirable limit or maximum permissiable limit set by WHO.
Statistical Analysis
The correlation coefficient ‘r’ was calculated using the equation.

Where x = x - and y = y - y , X and Y represent two different parameters. x = mean value of X = y mean value of Y
The correlation coefficient (r) amongst various water quality parameters are given in Table 4 and 5.The significance of the observed correlation coefficient have been tested by using ‘t’ test. Out of 63 correlations found between two parameters. 17 were found to have significant at 5% level (t > 2.086). The positive correlations were found in 47 cases and negative correlation in 16 cases. The significant positive correlations was found between electrical conductivity and Na (r = 0.7672, t = 5.349), Chloride (r = 0.8873, t = 8.6073), Total Hardness (r = 0.6618, t = 3.9481), Sulphate (r = 0.5109, t = 2.6578), Calcium (r = 0.5864, t = 3.2374), So with the increase or decreases in the values of Sodium, Chloride, Total hardness, Sulphate and Calcium the electrical conductivity increases or decreses. Positive correlation was found between electrical conductivity and Mg (r = 0.38372, t = 1.8582), K (r = 0.2456, t = 1.1329), PO (r = 0.1585, t = 0.7179), Total alkalinity (r = 0.1859, t = 0.8461), PH (r = 0.08167, t = 0.3664). Negative correlation was found between electrical conductivity and NO ion. Total dissolved solids shows significant positive correlation with Na (r = 0.7672, t = 5.349), Cl- (r = 0.8873, t = 8.603), T.H (r = 0.6618, t = 3.941), SO (r = 0.5109, t = 2.6578), Ca (r = 0.5864, t = 3.2374) positive correlation was found between T.D.S. and Mg (r = 0.3838, t = 1.8582), K (r = 0.2456, t = 1.1329), PO (r = 0.1585, t = 0.7179), Total alkalinity (r = t = 0.1859, t = 0.8461), PH (r = 0.08167, t = 0.3664).
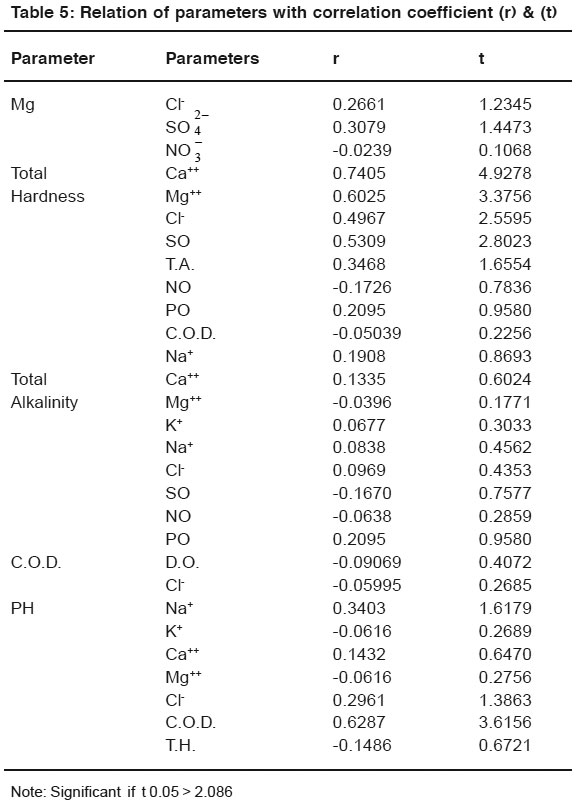 |
Table 5: Relation of parameters with correlation coefficient (r) & (t) Click here to view table |
Sodium shows significant positive correlation with chloride ion (r = 0.8288, t = 6.6254). Positive correlation was found between sodium & SO (r = 0.2053, t = 0.9381), PO (r = 0.2655, t = 1.3215), Na (r = 0.0432, t = 0.1936) Significant positive correlation was found between K and Chloride (r = 0.2663, t = 1.2355), PO (r = 0.5803, t = 2.9855). Negative correlation was found between K and SO (r = -0.2716, t = 1.2620), Na (r = -0.1216, t = 0.5478).
Calcium shows positive correlation with Chloride (r = 0.3944, t = 1.9134) and SO (r = 0.3677, t = 1.7680), PO (r = 0.2628, t = 1.3312). It’s suggested that Chloride is present in the form NaCl in maximum amount, it’s also present in form of KCl, CaCl2 & Cl2.
Phosphate may be present in the form of potassium salt of phosphate. Nagative correlation was found between Ca and Na (r = -0.2934, t = 1.3674) between Mg and Na (r = -0.0239, t = 0.1068). No correlation found between Mg and PO.
Total hardness shows significant positive correlation between Ca (r = 0.7405, t = 4.9278), Mg (r = 0.6025, t = 3.3756) Cl- (r = 0.4967, t =2.5595) and SO (r = 0.5309, t = 2.8023). positive correlation was found between Total Hardness and T.A. (r = 0.3468, t = 1.6554), PO (r = 0.2095, t = 0.9580), Na (r = 0.1908, t = 0.8693). Negative correlation was found between Total hardness and NO (r = -0.1726, t = 0.7836), COD (r = -0.05039, t = 0.2256). As Hardness shows positive correlations with Ca, Mg, Cl-, and SO. Therefore, it is suggested that hardness of water samples is mainly due to presense of CaCl2, CaSO4, MgCl2 and MgSO4.9
Total alkalinity shows positive correlation between Ca (r = 0.1335, t = 0.6024), K (r = 0.0677, t = 0.3033), Phosphate (r = 0.2095, t = 0.9580). Negative correlation were found between Mg (r = - 0.0396, t = 0.1771), SO (r = 0.1670, t = 0.7577), Na (r = -0.0638, t = 0.2859). Chemical oxygen demand shows Negative correlation between D.O. (r = -0.0969, t = 0.4072), Cl- (r = -0.05995, t = 0.2685). PH shows significant positive correlation with C.O.D. (r = 0.6287, t = 3.6156) positive correlation between Cl (r = 0.2961, t = 1.3863) Ca (r = 0.1432, t = 0.6470), Na (r = 0.3403, t = 1.6179). PH shows negative correlation with K (r = 0.0616, t = 0.2689), T.H. (r = -0.1486, t = 0.6721), T.A. (r = -0.1973, t = 0.7122)
Conclusion
All the physico-chemical parameters of ground water of Thane Region are within the highest desirable limit or maximum permissible limit set by WHO, except chemical oxygen demand values for most the ground water samples recorded high values. Ground water of Thane region recorded higher values of Na, Cl, Ca and Mg. This may be due to proximity of ground water sampling stations to the creak. A large number of factors and geological conditions affect the correlations between different pairs directly or indirectly. An appreciable significant positive correlations have been recorded for electrical conductivity with Na and Cl-. Na with Cl-, Total hardness with calcium.
Acknowledgements
Author is grateful to Prin. Dr. G. B. Vishe for providing Administrative support, Mr. D. S. Patil Chemist I. T. L; Thane and Mr. N. Kalyan M. D. Elca lab, Thane for providing laboratory facility.
References
- N. Janardhan Raju, Current Science, (2006) 91(6).
- APHA-AWWA, Standard methods for the examination of water and waste water 20th edition, sec. 3120 (1998).
- S. P. Gupta, statistical methods sultan chand & sons, 28th edition (1999).
- World health organization, Guidelines for drinking water quality-I, Recommendations, 2nd Edition Genera WHO (1993).
- Madhavi A. Rao, Acharya N. G. Ranga J. Environmental Biology (2003) 24(2): 187-92.
- Maharashtra pollution control board report, Environmental status of Thane Region, (2005).
- Naik P. K. Dehury B. N; Tiwari A. N; J. Environ. Monit. Asses. (2007) 132(1-3): 207-33.
- Sharma M. R. J. pollution Res; (2004) 23(1): 131-134.
- Manish I. Shrivastava Environmental chemistry. Shree publishers and Distributors, New Delhi Ed (2004).


