Physio-chemical analysis of industrial effluents in Thane region of Maharashtra, India
S.R. Mirgane1 * and G.R. Bhagure2
1
Department of Chemistry,
J.E.S. College,
Jalna,
431 203
India
2
Department of Chemistry,
Dnyanasadhana College,
Thane,
400 604
India
http://dx.doi.org/10.12944/CWE.4.1.09
Thane district is one of the most industrialized districts in the state. The heavy industrialization and the increasing urbanization are responsible for the rapidly increasing stress on the water environment of the area. Therefore an attempt has been made to study the physico chemical properties of effluents and to know the pollution load on the environment. Effluent Samples were obtained from various industries such as bulk drug chemicals, textile, and rubber chemicals, vitamin products, agrochemicals, dairy, dye manufacturing, textile processing, polymer, jewelry, construction chemicals, insecticides, paper products and fine chemicals. The effluent samples were analyzed and it is found that, electrical conductivity and T.D.S. varies from 0.43 to 46.5 millisimens cm-1and 280 to 30,225 mg/lit. High T.D.S., low D.O. content, high C.O.D. and conductivity values with high Cl-,SO4-2 , Ca2+, Mg2+, Na+ content indicates highly polluted condition of effluent .Heavy metal analyses were analyzed by Inductively Coupled Plasma (ICPE-9000) Atomic Emission Spectroscopy. It is found that AS, Cu, Cd, CO, Fe, Ni, Zn, Pb and Cr are within the limit prescribed limit prescribed by I.S.I., Hg is beyond the prescribed limit
Copy the following to cite this article:
Mirgane S.R, Bhagure G.R. Physio-chemical analysis of industrial effluents in Thane region of Maharashtra, India. Curr World Environ 2009;4 (1):63-70 DOI:http://dx.doi.org/10.12944/CWE.4.1.09
Copy the following to cite this URL:
Mirgane S.R, Bhagure G.R. Physio-chemical analysis of industrial effluents in Thane region of Maharashtra, India. Curr World Environ 2009;4 (1):63-70. Available from: http://www.cwejournal.org/?p=891
Download article (pdf)
Citation Manager
Publish History
Introduction
Water is the most vital resource for all kinds of life on this planet, but it is being adversely affected both quantitively and qualitatively by all kinds of life human activities on Land, Air and Water.
Today most of the rivers of world receive millions of litre sewage domestic waste and industrial effluents containing varying in characteristics from simple nutrients to highly toxic substances. Urban pollution increases rapidly by industrial developments. Industrialization and urbanization lead to generation of large volumes of wastewater from domestic, commercial, industrial and other sources.
Industrial waste waters discharged into natural water bodies like river, creeks have created new pollution problems. Toxic chemical compounds have killed aquatic biota in many water bodies and have rendered waters useless. As industrial pollution is found in large amount in specific geographic areas, collection and treatment of these materials should be easy to accomplish, unfortunately, only small percentage of factories treats their contaminated water adequately prior to its release.
The data generated by the studies on the surface water, ground waters and creek waters by MPCB1 in Thane region of Maharashtra reveals that, the waste water generated from the cities located in the region along with industrial effluent are finally disposed in the creeks. The untreated domestic waste waters from cities like Kalyan, Dombivali, Sarvali, Thane,Ulhasnagar, Ambernath etc. deteriorating the quality of creek water. Therefore an attempt has been made to study the physico-chemical characteristics of effluents of various industries located in Thane, Dombivali, Sarvali, Ulhasnagar and Ambernath of Thane region of Maharashtra India. The pollution level of each effluent is compared with the guidelines as prescribed by Indian Standard Institution.2
Study Area
Thane, the northern most district of Kokan, lies adjoins to Arabian Sea in North West of Maharashtra state. It extends between 20’20’ north latitude 73045’ east longitudes. Thane district is one of the most industrialized districts in the state. The district is blessed with abundant natural resources in the from of perennial rivers extensive seashore and high mountainous range. Thane region is also marked with long coast line and rapidly growing residential areas of Thane, Dombivali, Ambernath, Mira, Bhayander, Vasai etc. As per the record of MPCB there are about 5449 industries in Thane region the various industries includes textile industries, dye manufacturing industries, match box factories, canning factories of various food stuff, fruit juice and slices as well as Beverage factories, pharmaceutical and chemical factories, paper mill, Jewelry industry, paint industry, insecticide industries etc.The waste from these industries, directly or indirectly find their way into the surface water, ground water and creek.
Material and Methods
Industrial effluent samples were obtained from various types of industries is presented in Table No.1.Effluents obtained from industries situated in Thane and its suburbans Rabale, Dombivali, Kalyan and Ambernath Industrial area. Effluent samples were obtained from the particular industry on request as part of academic study and were analyzed as sample received. Effluent Samples were collected in 5 lit. Plastic container previously washed with 6 N Nitric acid and high purity water. The regents used were of AR grade while double distilled water was used to prepare all solutions.
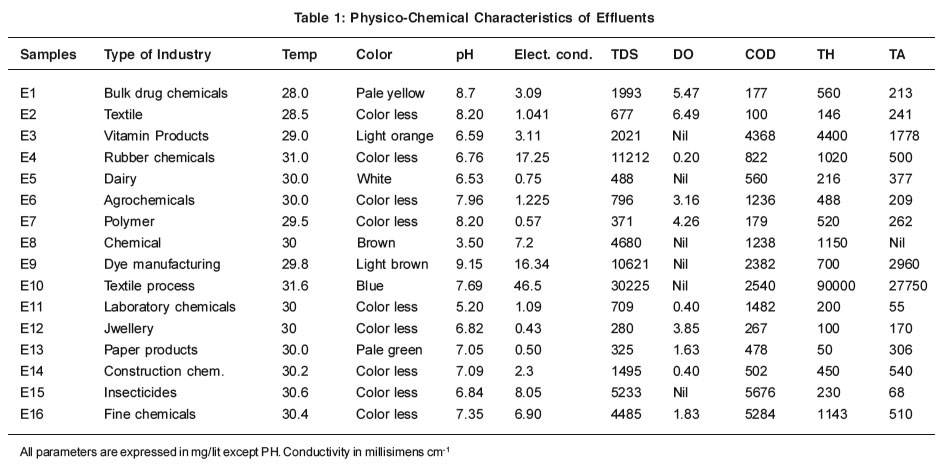 |
Table 1: Physico-Chemical Characteristics of Effluents Click here to view table |
The physico- chemical parameters considered for the examination are temperature, color, electrical conductivity, oil and grease, total dissolved solids, total hardness, total alkalinity, dissolved oxygen, chemical oxygen demand, chlorides, Sulphates, nitrates and metal ions like calcium, magnesium, sodium, potassium. These parameters have been determined by standard methods.3 Sodium and potassium ions have been determined by flame photometer (Model Elico CAL-178. Out of 16 industrial effluent samples 10 effluent samples were analyzed for heavy metal ions like arsenic, cadmium, cobalt, copper, iron, mercury, nickel, zinc, lead and chromium. Heavy metal ions were analyzed by Inductively Coupled Plasma-Atomic Emission Spectroscopy (Model ICPE-9000 Shimadzu, Japan.) Effluent samples were digested by adding con. HNO3 for half an hour, cooled, filtered by using what man filter paper no. 41. The metals were estimated in the sample by aspirating the filtered sample solution directly into the plasma of the instrument. The instrument was standardized for the individual elements. Calibration curve was obtained for every metal ion using standard solution. Standard solutions were prepared from 1000 mg/ lit. stock solution of different metals of interest. Minimum concentration of metal which could be detected by the instrument was 10 ppb.The results of all the above experimental findings are summarized in Table 1, 2 & 3.
Results and Discussion
The values reported in Table 1, 2 and 3 are the average of triplicate analysis performed for every sample collected. It can be seen that the PH of the industrial effluents ranges from 3.50 to 9.15. Sample E3, E4, E5, E8 and E11 are found to acidic in nature. PH of the dairy effluent is acidic in nature this may be due to formation of lactic acid by decomposition of lactose.4 Use of organic and inorganic acids in the manufacturing processes causes decline in pH values. Sample No. E2, E10 are found to be more basic in nature this may be due to use of caustic soda, sodium silicate in the textile processes like Kiering, bleaching, mercerizing etc.5 pH values of all the samples are found to be within the limit as per the standard prescribed by Indian Standard Institution. Except sample no. E8, pH values of all the samples are found to be with in the limit as per the standard prescribed by Indian Standard Institution.
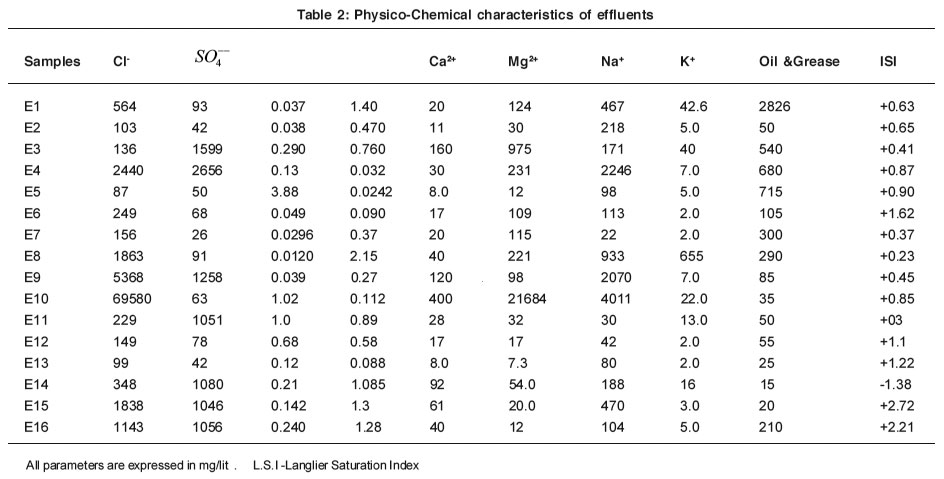 |
Table 2: Physico-Chemical characteristics of effluents Click here to view table |
Electrical Conductivity
The range of electrical conductivity observed for different samples lies between 0.43 to 46.5 millisimens/cm the samples no. E4, E8, E9, E10, E15 and E16 show high conductivity mainly due to higher dissolved solids.
Total Dissolved Solids
The total dissolved solids of all the collected effluents range from 325 to 30,225 mg/lit. The maximum permissible limit as per ISI standard is 2100 mg/lit. It has been observed that sample E3, E4, E8, E9, E10, E15 and E16 show high value of total dissolved solids which is beyond the tolerance limit as set by ISI; high values of total dissolved solids indicating that these effluents contain various types of mineral species in the water.
Total Hardness
The hardness value of effluents range from 50 to 90,000mg/lit. Sample no. E3 shows hardness 4400 mg/lit. This industry manufactures vitamin product containing calcium and magnesium. The increase in hardness of sample E3 and E10 may be due to the presence of calcium hypochlorite use in the textile processes like Bleaching.
Total Alkalinity
The total alkalinity of effluents ranges from 0 to 27750 mg/lit. The highest alkalinity is observed in the sample no. 10. This is thought to be due to the appreciable amount of caustic soda used in the kiering and mercerizing process of textile mill.
Dissolved Oxygen
It has been observed that the sample nos. E3, E5, E8, E9, E10 and E15 show negligible amount of dissolved oxygen. This is due to large amount of biodegradable matter present in the sample. The remaining samples shows low values of dissolved oxygen due to inadequate amount of organic matter present in these effluents.
Chemical Oxygen Demand
Chemical oxygen demand is extremely useful in finding out the pollution strength of industrial effluents. In the present study, most of the effluents show appreciable amount of COD. The sample No.,E3, E4, E6, E7,E8, E9, E10, E14, and E16 shows high value of COD due to vitamin waste, dynes, axillaries organ phosphorus compound etc., COD values of there sample exceeds the limit as prescribed by ISI standards. The results shows that industries which manufactures vitamin products agrochemicals, dye, auxiliaries, textile processing industries, rubber releasing large amount of oxygen demanding chemicals.6
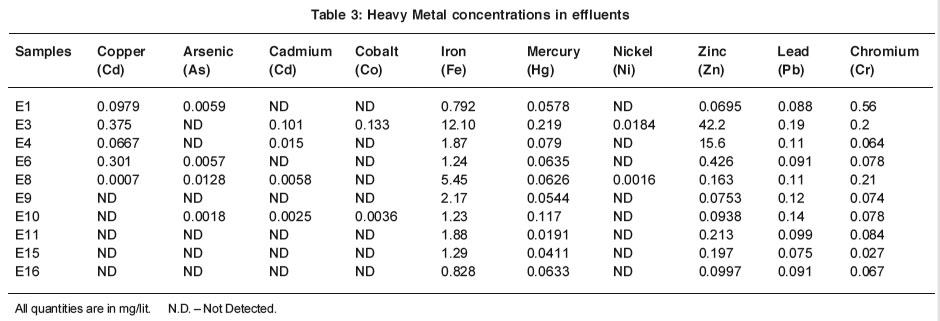 |
Table 3: Heavy Metal concentrations in effluents Click here to view table |
Oil and Grease
It has been found that all the effluent samples shows oils and grease. Oils and Grease is used as the raw materials in the process or lubricants applied for machineries. Oils and grease are very high with in the range of ISI values. The high values of grease are responsible to disturb the vegetation and effected the marine environment and its creatures.
Chlorides
The concentration of chlorides was found in the range of 103 to 69580 mg/lit. It has been found that, effluent sample no. E4, E8, E9, E10, E15 and E16. Contain high amount of chlorides with the range of ISI values. High amount of chlorides may be due to chlorinated compounds used in rubber chemicals chlorinated pesticides and insecticides. Use of acid and salts in many process, use of chlorine and calcium hypochlorite in textile processing etc. high amount of chlorides may show deleterious effect on metallic pipes.7
Sulphates
The concentration of sulphate ranges from 26 to 2656 mg/lit. Effluent samples E3, E4, E9, E11 E14, E15 and E16 contains high amount of sulphate which is beyond the permissible limit as preseribed by ISI. High value of sulphate in the effluent samples is due to use of sulphuric acid, sodium sulphate, aluminium sulphate as the raw materials.
Phosphates and Nitrates
It has been observed that phosphates and nitrates concentration in all the effluents is very low.
Calcium and Magnesium
Calcium and Magnesium content in the effluents are low except sample no E3 and E10. In samples No. E3, Ca2+ and Mg2+ contents are 160 mg/lit and 975 mg/lit respectively. This is due to use of calcium and magnesium compounds in preparation of vitamins. Samples no E10 contain 400 mg/lit and 21684 mg/lit of calcium and magnesium.
Sodium and Potassium
Most of the effluents show less amounts of Na+ and K+ except sample no E4, E9 and E11. In these samples Na+ contains are 2246 mg/lit 2070 mg /lit and 4011 mg/lit respectively. This is due to use of sodium and potassium salts during neutralization, bleaching and mercerizing.
Heavy Metals
Heavy metals are a major source of pollution in India due to industrial waste disposal and considered highly toxic to aquatic organisms. The compounds of these elements are non-biodegradable and hence remains suspended or partially dissolved in water column and get accumulated in many aquatic organisms.
Arsenic
Arsenic forms a verity of inorganic and organic compounds of different toxicity reflecting the physico- chemical properties of arsenicals of different valency. It was found that effluent samples E1, E6, E8 and E10 contains 0.0059, 0.0057, 0.0128 and 0.0018 mg/lit of arsenic which is well below the permissible limit. These industries are chemicals, dye staff, agrochemicals and textile and bulk drug chemicals. Arsenic was not detected in the effluent samples E3, E4, E9, E11, E15 and E16.
Copper
Copper ion concentration in the effluents E1, E3, E4, E6, and E8 are found to be with in the limits as prescribed by ISI. Copper ion was not detected in the sample no E9, E10, E11, E15, E16. The toxicity of copper to aquatic life is depending on the alkalinity of water as copper is generally more toxic to aquatic fauna at lower alkalinities. B. Patel and et .al.8 al. reported dissolved copper 0.02 to 1.30 mg/ lit in Bombay harbor which receives large amounts of industrial and municipal waste
Cadmium
Cadmium ion concentration in the industrial effluents Nos. E3, E4, E8, E10 are 0.101, 0.015, 0.0058, 0.0025 mg/lit. Cadmium ion was not detected in the remaining samples.Train9 reported that, biologically, cadmium is non essential, non beneficial element, recognized to be highly toxic to fishes even at low levels in water that metal concentration at certain stations were relatively low. Mahapatra10 analyzed the sediments of polluted Thane creak at 20 stations for 9 heavy metal ions. He found that cadmium in uncontaminated freshwater sediments is generally detected at 0.1 to 1.0 mg/lit dry weight, increasing to 4 to 10 mg/kg in contaminated areas.
Cobalt
Cobalt ion concentration in the effluent sample no E3 and E10 are 0.133 mg/lit and 0.0036 mg/lit where as in other sample cobalt ion was not detected. Sample E3 contain cobalt ion because of use of cobalt compounds in vitamin products. Cobalt often is undetectable is drinking water, reflecting its low concentration in surface waters. When present, concentrations are generally < 0.005 mg/lit.¹¹
Iron
Iron concentrations in the effluents was found in the range of 0.792 mg/lit to 12.10 mg/lit. Effluent samples no E 3 and E 8 contain maximum iron concentration 12.10 mg/lit and 5.45 mg/lit. Effluent sample no E3 contain maximum iron concentration 12.10 mg/lit, this is due to the use of iron compounds in the vitamins preparation. Iron concentration in the effluents may be due to the interaction of machinery components, with many acids, chlorides and sulphate due to which iron releases in the form of corrosion product.7,12
Mercury
Almost all effluents are mercury rich and exceeding the limit prescribed by ISI. Mercury concentration in the effluents found to be in range 0.0191 mg/lit to 0.219 mg/lit high concentration of mercury in the effluents because of use of mercury compounds in various processes. Tejam and Halder13 reported that fishes from Mumbai and Thane region had 35.56 mg of mercury per gm of fresh weight tissue.
Shaw 14 reported the effect of Chloro -alkali factory effluent in Orissa on plant and animal life has found mercury as the main pollutant. The most dangerous phenomenon of mercury is it methyllation in the environment to form highly soluble, toxic species. These compounds are readily absorbed and concentrated by aquatic plants and animals.
Nickel
Nickel ion concentration in the effluent sample no E3 was found 0.0184 mg/lit. and E8 shows 0.0016 mg/lit which is below the limit preseribed by ISI. In other effluents Nickel was detected.
Zinc
Zinc ion concentration in all effluent sample is below the limit as prescribed by ISI except, In sample no E3 zinc ion concentration is 42.2 mg/lit. which exceeds the limit.
Lead and Chromium
Lead and Chromium ion concentration is lower than the limits preseribed ISI, except sample no E3, E9 and E10 shows high lead ion concentration which exceeds the limit. The values of these metals show significant variation depending upon the nature of effluent suggesting that the respective metal salts have pronounced industrial activities.
Conclusion
From the result of physico chemical analysis of effluents, it has been concluded that oil and grease, TDS, COD, chlorides, sulphates are very high in comparison to the standard Prescribed by ISI. The effluent samples showed appreciable concentration of all heavy metals. Concentration of mercury in all effluent samples is high in comparison to the standard prescribed by ISI. Concentration of other heavy metal is low, though the concentration levels are not high but more or less every industry discharges the heavy metals through their effluents and ultimately contaminates the water and soil in the Thane region.
Acknowledgements
The authors wish to thank to all Industry authorities for providing samples for academic study. Specials thanks to Principal Dr. G.B. Vishe Dnyanasadhna College, Thane for providing administrative support. Mr. D.S. Patil, Chemist, Insecticide Testing Laboratory, Thane for providing laboratory facilities. The authors are also grateful to Mr. N. Kalyan M.D. Elca laboratories, Thane for assistance in analysis of heavy metals by Inductively coupled plasma atomic emission spectroscopy. Thanks are also to Dr. R.P. Chavan, Prof. B.S. Khollam and Mr. Sumant Bikad for useful suggestions.
References
- Maharashtra Pollution Control Board Report, (2005.) Environmental status of Thane Region,
- Indian Standard Institution IS: 2490 (part-I)-1981. General Limits.
- APHA-AWWA and WPCF, Standard method of Examination of water and waste water, 20th edition Sec. 3120 (1998).
- Bhatnagar Mridula and Suruchi Gupta, Assessment of Physico-Chemical Characteristics of Dairy Effluents, Asian Journal of Chemistry, (2001) 13(4): 1405-1410.
- Prof. Trivedi P. R and Prof. Gurdeep Raj, Environmental Industrial Pollution control (volume-v) Akashdeep Publishing House, New Delhi, P.1219-1248, Reprint (2005).
- Naik, P.K;Dehury, B.N.and Tiwari,A.N., Ground water Pollution around an Industrial area in costal stretch of Maharashtra State, India. Environ. Monit. Assess., (2007) 132(1-3): 207-233.
- Abigail F.Cantor, Jae K. Park and Parsit vaiyavatjamai; Effect of Chlorine on Corrosion in drinking Water systems. Journal American water works Association, 95.5 may (2003) 112-123.
- Patel, B.Bangera, V.S.Patel, V.S; Balani, M.C., Heavy metals in Bombay Harbour area Marine pollution Bulletin, (1985) 16: 22-28.
- Train, R.E. Quality; Criteria for water U.S.A. EPA Washington D.C; 256 (1979)
- Marine pollution Bulletin, (1985) 16: 22-28.
- Ramesh , R.and M. Anbu M., Chemical methods for Environmental Analysis, Macmillan India Ltd. First published (1996).
- Train, R.E. Quality; Criteria for water U.S.A. EPA Washington D.C; 256 (1979)
- Marine pollution Bulletin, (1985) 16: 22-28.
- Mohapatra, Satya P., Distribution of heavy metals in polluted creak sediment. Environment monit. Assess. (1988) 10(2): 157-163.
- Ramesh , R.and M. Anbu M., Chemical methods for Environmental Analysis, Macmillan India Ltd. First published (1996).
- ASM metal hand book, 13A (2000).
- Tejam, B.H. and B.C.Halder., A. preliminary survey of mercury in fish from Bombay and Thane environment Ind. J. Env. Health (1975) 17(1): 9.
- Shaw, N., Ph.D. Thesis, Berhampur Univ (1987).


