Electrochemical behavior of copper electrode in sodium hydroxide solutions
I. Zaafarany1 * and H. Boller2
1
Institute of Inorganic Chemistry,
Johannes-Kepler-Universität Linz,
A-4040 Linz
Austria
http://dx.doi.org/10.12944/CWE.4.2.32
The cyclic voltammograms of the copper electrode in different concentrations of NaOH solutions was studied using cyclic voltammogram’s (CV’s) technique. In addition surface examination and morphological studies were also conducted using scanning electron microscope (SEM) and energy dispersive analysis of X-rays (EDAX). The four anodic peaks where founds to correspond successively to the formation of a mono layer of Cu2O, a thick layer of CuO and CuO22- and finally the formation of a higher oxide Cu2O3 before the evolution of oxygen. It is suggested that the CuO is formed from the oxidation of Cu2O and/or direct oxidation of metallic copper in 5M NaOH solution. The ratio of anodic and cathodic charge was found to be about unity, indicating the quantitative reduction of solid oxidation product. The behavior of copper electrode in NaOH solutions was found to be quite complicated. Thus, no simple relation were found between the voltage scan rate and both the peak current and peak potential or between the peak K current and alkali concentration of alkali.
Copy the following to cite this article:
Zaafarany I, Boller H. Electrochemical behavior of copper electrode in sodium hydroxide solutions. Curr World Environ 2009;4(2):277-284 DOI:http://dx.doi.org/10.12944/CWE.4.2.32
Copy the following to cite this URL:
Zaafarany I, Boller H. Electrochemical behavior of copper electrode in sodium hydroxide solutions. Curr World Environ 2009;4(2):277-284. Available from: http://www.cwejournal.org/?p=959
Download article (pdf)
Citation Manager
Publish History
Introduction
The electrochemical behaviour of copper is of considerable interest in many areas of technology, including solar cell,1 integrated circuits2 and heat exchangers.3 Hence, the cyclic voltammograms of this metal has been extensively studied, particularly in alkaline solutions4-7 which affords more resolution than the conventional galvanic technique.
The anodic behaviour of Copper in alkaline environments leads to the formation of an oxide film consisting of either Cu2O or a duplex layer of Cu2O and CuO depending on the electrolyte composition and electrochemical conditions.8-10
Pyun and Pork11 using insitu spectroelectrochemical technique for identifying surface film and concluded that hydroxides of Cu(I) and Cu(II) were first formed by anodic oxidation at corresponding potentials and then they transform to oxides upon aging. Macdonald,12 studied the cyclic voltammetry of copper in hydroxide solutions at elevated temperatures 25 to 250 °C and found that the results are consistent with the formation of both soluble Cu2O2 2- and insoluble Cu2O and CuO products at the metal surface. The formation and reduction of Cu(III) was found to occur near oxygen evolution region at 25 °C but not at higher temperatures due to a sharp reduction in the oxygen evolution potential with temperature.
The aim of the present investigation is to through new lights on the characteristics of the reaction products formed on the copper surface, products performed on the copper surface in NaOH solutions. The implications of these results with references to the mechanism of the electrochemical reactions are also discussed.
Experimental
The working of copper electrode was prepared from high purity (99.98 %) copper rod, diameter 6 mm, length 6 mm was placed in a “KelF” shield, protected by epoxy resin. The bottom electrode was screwed onto a polyethene holder with a contact wire in order to obtain good electrical contact. The electrodes are successively abraded with finest grade emery paper and degreased with acetone. Complete wetting of the surface was taken as indication of its cleanliness when rinsed with bidistilled water. All chemicals used were of A.R. quality. The solutions were prepared using bidistilled water, no attempts were made to deareate them. The electrolytic cell was of pyrex and is described elsewhere.13
Cyclic voltammograms curves (CV‘s) were obtained from an autolab. (ECO Chemie) combined with the software package GPES (General Purpose Electrochemical System). This is a computercontrolled electrochemical measurements system. It consists of data-acquisition system and a potentiostat/galvanostat. CVs were used to study the corrosion of copper in alkaline solutions sweeping from hydrogen evolution -1.8 V to 0.8 V of oxygen evolution. All measurements were taken at 25 ± 1 °C.
Scanning electron microscope (SEM) of the type (XL30) was used to examine the surface of copper in absence and presence of NaOH solutions. All micrograph of corroded specimens were taken at a magnification of (X 500). Energy dispersive analysis of X-ray examination using a Traktor TV- 2000 energy dispersive spectrometer was used in this work.
Results and Discussion
1-Effect of Alkali Concentrations
The electrochemical behavior of copper in alkaline solutions was studied using cyclic voltammograms technique (CV’s). Figures 1-3 show typical CV’s of copper electrode in 0.1, 1 and 5M NaOH solutions traced at a voltage scanning rate of 50 mV s-1, respectively. The potential was swept between hydrogen and oxygen evolution. Repeated cycling of electrode polarization gave essentially similar CV’s except that the peak currents increase and the peak potential is shifted to more negative values. This could be due to electrode activation as a result of successive sweep. The excellent reproducibility is an indication of the stability of the system and the reversibility of all the reaction involved.
The voltammogams are characterized by several features marked from A to D on the anodic half cycle and from E to G on the cathodic one.
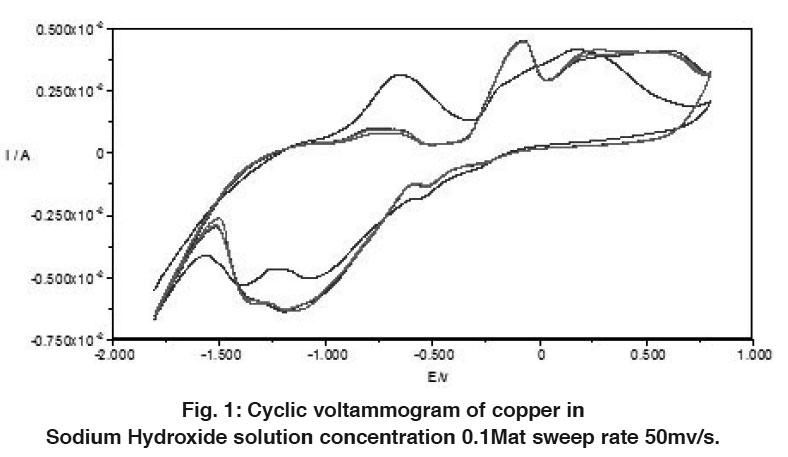 |
Figure 1: Cyclic voltammogram of copper in Sodium Hydroxide solution concentration 0.1Mat sweep rate 50mv/s. Click here to view figure |
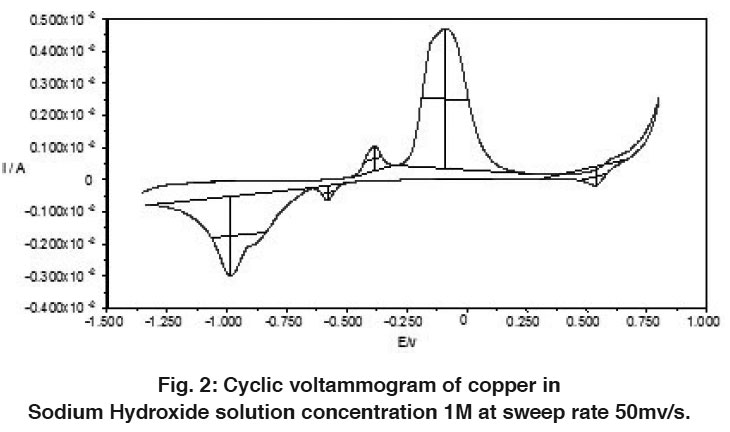 |
Figure 2: Cyclic voltammogram of copper in Sodium Hydroxide solution concentration 1M at sweep rate 50mv/s. Click here to view figure |
Anodic Half Cycle (Forward Scanning)
Peak (A):
The thermodynamic consideration of different possible oxidation reaction reveals, the possibility of such transformation and helps in determining the most possible reactions like among a number of proable one. Owing to the stability of cuprous rather than cupric state in direct contact with metallic copper, it is most probable that the peak (A) corresponds to the formation of cuprous oxide according to the following equations:
Cu + OH → Cu (OH) + e ...(1)
2Cu (OH) → Cu2O + H2O ...(2)
A comparison of the quantity of electricity under peak A is also reported for the formation of Cu2O.
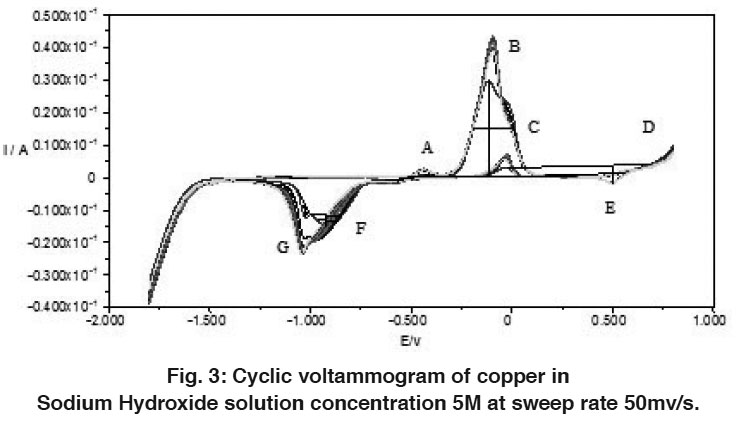 |
Figure 3: Cyclic voltammogram of copper in Sodium Hydroxide solution concentration 5M at sweep rate 50mv/s. Click here to view figure |
Peak (B):
It appears at a more noble potential than that of peak (A). This peak is due to the oxidation of cuprous oxide to either (or both) CuO and Cu(OH)2 according to the following equations:
Cu2O + 2OH- → 2CuO + H2O + 2e - ...(3)
Cu2O + 2OH- + H2O →2Cu(OH)2 + 2e - ...(4)
The resulting Cu(OH)2 exists in the following equilibrium.
Cu(OH)2 → CuO + H2O Abd El-Haleem et al.14 assumed the formation of a multilayer film of CuO under peak B in contrast to the monolayer of Cu2O under peak A. The formation of a multilayer oxide results from three dimensional nucleation processes.
Region (C):
Region (C) appears only below 1M alkali concentration and at higher concentrations. This is due to the direct dissolution of copper as cuprite
ions according to either (or both) of the following electrochemical reactions:
Cu + 3OH- → HCuO2 - + H2O + 2e –
Cu + 4OH- → Cu(OH)4 2- + 2e –
and/or from Cu(OH)2 through chemical reaction:
Cu(OH)2 + 2OH- → CuO2 2- + 2H2O
Region (D):
It is thought to be due to the formation of a higher oxide. Some authors5,15 reported that this oxide may be copper sesquioxide [Cu2O3].
Latimer16 is also of the opinion that Cu2O3 is formed only when copper dissolves as cuprite HCuO2 -. However, Al-Kharafi and El-Tanawy17 argue that the source of this oxidation peak is the possible formation of Cu(OH)2 on the oxide surface.
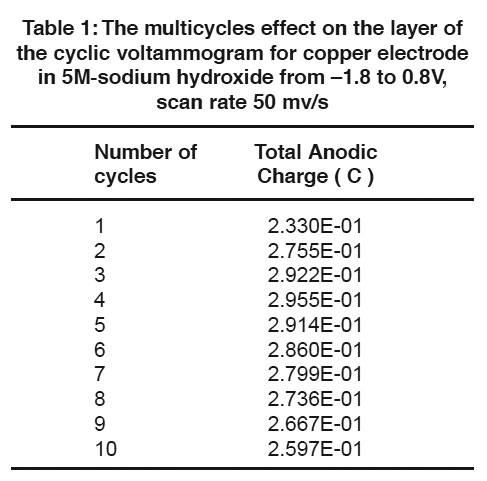 |
Table 1: The multicycles effect on the layer of the cyclic voltammogram for copper electrode in 5M sodium hydroxide from –1.8 to 0.8V, scan rate 50 mv/s Click here to view table |
B-Cathodic Half Cycle
The reverse scanning shows three reduction peaks namely E, F and G. The first cathodic peak E, that occurs at the most positive potential is presumably corresponds to the reduction of (or part of) the anodic product Cu2O3 in the anodic region (D). The area under the cathodic peak was slightly greater than that under the anodic one because of the reduction of dissolved oxygen. However, when the potential scan is reversed after peak B. Two well defined cathodic peaks were recorded (peaks F and G). These two main steps would be expected to be attributed to the reduction of Cu(OH)2 and Cu2O formed in the corresponding three main anodic steps (A, B and C).
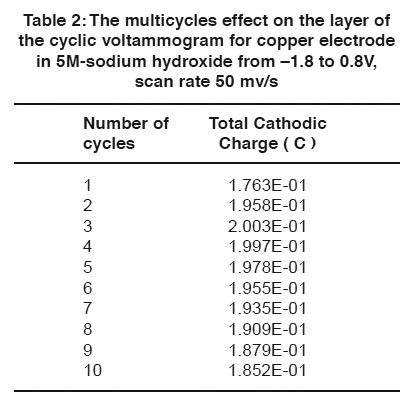 |
Table 2: The multicycles effect on the layer of the cyclic voltammogram for copper electrode in 5M sodium hydroxide from –1.8 to 0.8V, scan rate 50 mv/s Click here to view table |
Peak F is a well defined peak with a relatively small area. It could be mostly attributed to the partial reduction of Cu(OH)2. On the other hand, Peak G is well defined peak with a relatively large area, greater than any of the corresponding anodic step areas. Accordingly, peak (G) could be attributed to the reduction of the remaining Cu(OH)2 which was not reduced under peak (F), along with the reduction of Cu2O formed under anodic step (A). In other words, peak (G) is a complex (composite) peak which corresponds to the either parallel or series processes. However, there are evidence18 to indicate that reduction of Cu2O and remaining Cu(OH)2 do not proceeds as it would be expected Cu(OH)2 → Cu2O → Cu but rather Cu2O → Cu and Cu(OH)2 → Cu.
The reaction occurring during this peak (G) is however complex since, the system is unstable being directly transferred to the corresponding Cu2O / Cu(OH) / OH-.
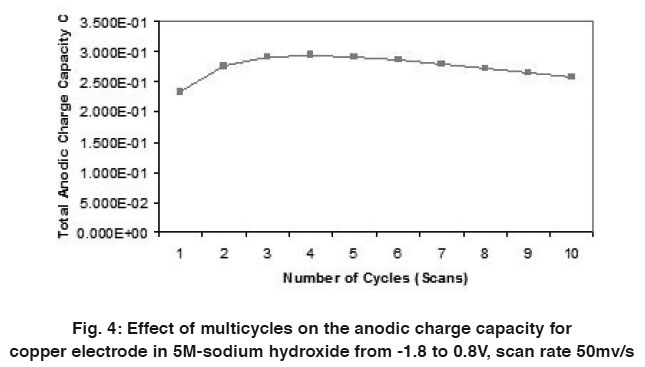 |
Figure 4: Effect of multicycles on the anodic charge capacity for copper electrode in 5M-sodium hydroxide from -1.8 to 0.8V, scan rate 50mv/s Click here to view figure |
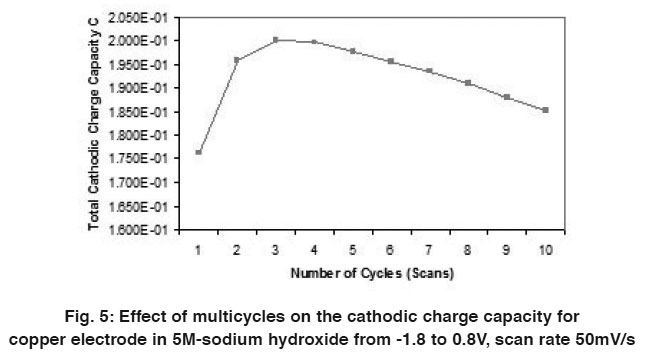 |
Figure 5: Effect of multicycles on the cathodic charge capacity for copper electrode in 5M-sodium hydroxide from -1.8 to 0.8V, scan rate 50mV/s Click here to view figure |
Charge Consideration
A comparison of the quantity of charge under the anodic (QA) and cathodic (QC) peaks is sometimes useful in detecting the formation of soluble reaction products. Figs. (4 & 5) and Tables (1 & 2) show the relation between the number of multicycles on the anodic charge capacity and the cathodic charge copper electrode in 5M NaOH from -1.8 to 0.8 V at a scan rate 50 mVs-1 respectively.
The values of QA/QC > 1. This may be due to either of the following:
(i) A soluble reaction product is produced in the anodic halfcycle and diffuses away from the electrode surface, and hence is not recovered in the cathodic half cycle.
(ii) Only partial reduction of the oxidation products. Under this condition, repeated cycling should result in lower anodic reaction rates and hence lower peak currents due to the restricting effect of the unreduced oxidation products remaining on the electrode surface.
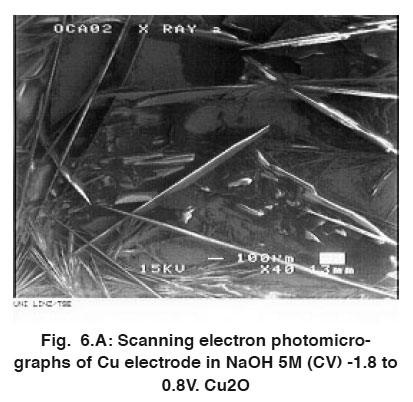 |
Figure 6.A: Scanning electron photomicrographs of Cu electrode in NaOH 5M (CV) -1.8 to 0.8V. Cu2O Click here to view figure |
 |
Figure 6.B: Morphology of copper oxide after anodic oxidation for 1h in NaOH 5M CA at - 0.094V. (CuO) Click here to view figure |
It is interesting to note that these dissolution reaction occur only at potential beyond that of peak (B), i.e. above + 0.275 V (S.C.E.). This is because the charge ratio for the second cyclic voltammogram in Fig. (3) was < 0.95 V in 5 M NaOH solution while the reversal potential was 0.275 V.
 |
Figure 6.C: Scanning electron photomicrographs of Cu in NaOH 5M CA -1.044V. (Cu2O) Click here to view figure |
Surface Analysis
The thin layer formed after immersion of copper electrode in 5M NaOH solution was investigated by scanning electron photomicrographs energy dispersive analysis of X-ray (EDAX). The anodic current decreases under potentiostatic conditions (Figs. 4 and 5) at -0.094 V and -1.049 V corresponding to the peaks B and G, respectively, in Fig. 5. (The electrode was covered by the dark layer.) Analysis of the surface by SEM indicate the formation of Cu2O and CuO, Fig. 6 (A, B and C). EDAX helped to determine oxygen together with other elements in the layers formed under different conditions, Fig. 7 (A-C) shows that the dark layer formed by CV contains copper, oxygen and sodium salt.
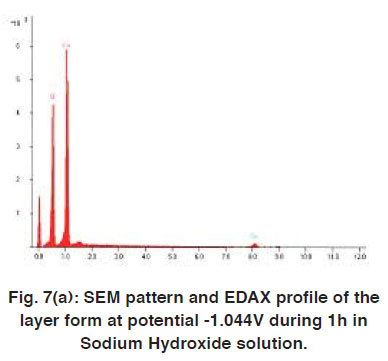 |
Figure 7(a): SEM pattern and EDAX profile of the layer form at potential -1.044V during 1h in Sodium Hydroxide solution. Click here to view figure |
Analysis of the surface by SEM showed two distinctive areas. Most of the electrodes look covered with a dry looking layer for which the elemental composition was consistent with Cu2O. Therefore, copper should be expected to corrode activity. Producing cuprous oxide Cu(I). In fact, this is the most common product found. As the electrode surface appeared completely covered by a dark layer, Fig. 6 (A,B and C).
 |
Figure 7(b): SEM pattern and EDAX profile of the layer form at potential -0.094V during 1h in Sodium Hydroxide solution. Click here to view figure |
EDAX analysis of the surface showed amounts of oxygen and copper except for some shallow needles and very small amorphous deposits, where the needles were consistent with a cupric oxide composition. During the anodic scan, the current decreases slowly with time. this suggest a competition between passivation and active dissolution.
 |
Figure 7(c): SEM pattern and EDAX profile of the layer form at potential -1.8 to 0.8V in Sodium Hydroxide solution by cyclic voltammetry. Click here to view figure |
EDAX analysis of the surface showed concentration of sodium and found some shallow needles Fig. 7 (A-C), which were found to be cupper and oxygen. It had been suggested that in some cases non-crystalline deposits are a necessary precursor to the formation of the SEM analysis is not completely conclusive in the sense that it can not positively identify different copper hydroxide or complex phases, the results of these experiments strongly indicate that it is related to the formation of Cu(OH)2 under the conditions of the SEM (high vacuum, electron bombardment Cu(OH)2 loses certainly water to form (CuO) cupric oxide.
Conclusion
The cyclic voltamograms of the copper electrode where obtained in NaOH solution as a function of the electrolyte concentration and voltage range. A correlation was made between three welldefined anodic peaks and their corresponding cathodic ones. The anodic peaks where found to correspond successively to the formation of a monolayer of Cu2O, while the formation of a thick multilayer composed of CuO and finally Cu2O3 upon which O2 is evolved. It is suggested that the CuO is formed from the oxidation of Cu2O and/or direct oxidation of metallic copper in 5M NaOH. The ratio of anodic and cathodic charges was found to be about unity, indicating the quantitative reduction of solid oxidation products. The behaviour of copper electrode in NaOH was found to be quite complicated. Thus, no simple relations were found between the voltage scan rate and both, the peak current and peak potential or between the peak current and alkali concentration.
References
1. E. Fortin and D. Masson; Solid-State Electron, (1982) 25, 281.
2. H. H. Strehblow, and C. J. Doherty: J. Elelectrochem. Soc. (1978) 125, 30.
3. Y.A. El-Tanawy, F.M. Al-Kharafi and A. Katrib: J. Electronanal. Chem., (1980) 125, 321.
4. M.R. Gennero De Chialvo, S.L. Marchiano and A.J. Arvia: J. Appl. Electrochem., (1984) 14, 165.
5. S.M. Abd El-Haleem and E.E. Abd El-Aal: Corrosion, (1981) 171, 309.
6. S. T. Mayer and R.H. Muller: J. Electrochem. Soc., (1992) 139(2), 426.
7. S. Dong, Y. Xie and G. Cheng: Electrochim Acta, (1992) 37(1), 17.
8. J.M.M. Droog, C.A. Ablerliesten, P.T. Alderliesten and G.A. Bootsma: J. Electroanal. Chem., (1980 111, 61).
9. H. H. Trehblow and B. Tilze: Electrochim Acta, (1980) 25, 839.
10. L.D. Burke, M. J. G. Ahern and T.G. Ryan: J. Electrochem. Soc., (1990) 137, 553.
11. C.H. Pyun and S.M. Park: J. Electrochem. Soc., (1986) 133, 2024.
12. D.D. Mac Donald: J. Electrochem. Soc., (1978) 125, 1960.
13. A.M. Shams El-Din and S.M. Abd El-Haleem: Werkstoffe Korros., (1973) 24, 389.
14. S.M. Abd El-Haleem and E.E. Abd El-Aal. Corrosion, (2006) 62(2), 121.
15. A.M. Shams El-Din and F.M. Abd El-Wahab. Electrochim. Acta, (1964) 9, 113.
16. W.M. Latimer: Oxidation potentials (Upper saddle River, N.J. Prentice-Hall, 1956), p. 188.
17. F.M. Al-Karafi and Y.A. El-Tanawy: Corros. Sci., (1982) 22, 1.
18. D.D. Mac Donald, J. Electrochem. Soc. (1974) 121, 651.


