Research and Development Index (RDI) as an indicator for Economic development
E.M.R. Kiremire1 *
1
Faculty of Science,
University of Namibia,
Private Bag 13301,
Windhoek
Namibia
http://dx.doi.org/10.12944/CWE.4.2.03
A simple formula relating economic development to research and development has been established. The more scientific research and development a country engages in, the more its economy advances. A research and development index(RDI) has also been established. RDI can be utilized as a good indicator to determine the level of economic development of countries. That is, whether a country is very developed, medium or lowly developed.
Copy the following to cite this article:
Kiremire E.M.R. Research and Development Index (RDI) as an indicator for Economic development. Curr World Environ 2009;4(2):263-275 DOI:http://dx.doi.org/10.12944/CWE.4.2.03
Copy the following to cite this URL:
Kiremire E.M.R. Research and Development Index (RDI) as an indicator for Economic development. Curr World Environ 2009;4(2):263-275. Available from: http://www.cwejournal.org/?p=957
Download article (pdf)
Citation Manager
Publish History
Introduction
It has been said many times over that Science and Technology is the engine of economic gowth1. Yet there has not a simple formula that correlates economic growth with science and technology or research and development. This paper is an attempt to develop a simple mathematical formula that relates economic development to research and development.
Formulating a module of an economic development based on Research and Development (R&D).
Fundamental Principle 1
Human and historical experiences clearly indicate that it is a fundamental principle that economic development and military superiority heavily depend upon the level of development of science and technolgy. Therefore, revitalizing S+T and R+D for deployment for sustainable development in Africa clearly imply the impact of these on economic development of the African continent. In a simple graphical form, this message may be represented as shown in Fig. 1. The principle is similar to the principle of supply and demand found in economics2. Thus, as science and technology develops from point A to B and C, there is a concomitant rise in the economic sphere from point A to B and finally to C. The economic development is intertwined with scientific and technological development as expressed in Fig. 1.
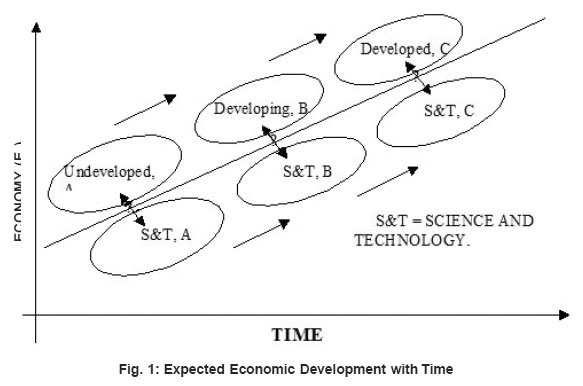 |
Figure 1: Expected Economic Development with Time Click here to View figure |
If the economy has to develop with time, science and technology(S&T) have to grow with time as shown in Fig. 2. Hence, it is a fair assumption that the level of the economy ( EC ) is directly proportional to the level of science and technology ( ST ). This is represented by Figs. 2 and 3.
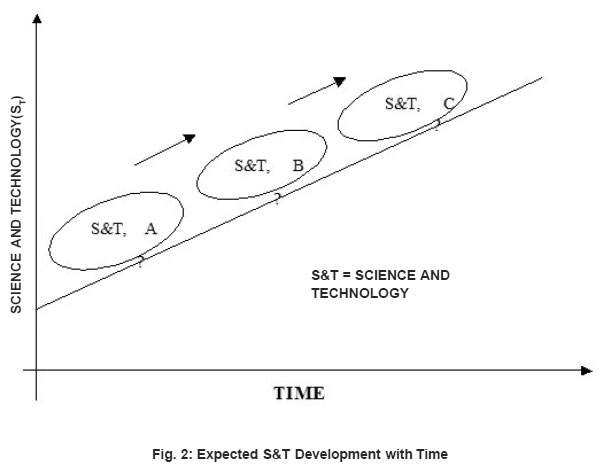 |
Figure 2: Expected S&T |
If we assume that the relationship between EC and ST is linear, then this can be expressed by a simple equation:
EC = k ST + L0 ……………(i)
where k is the gradient that depends mainly on the level of investment in ST and L is the current level of economic development.
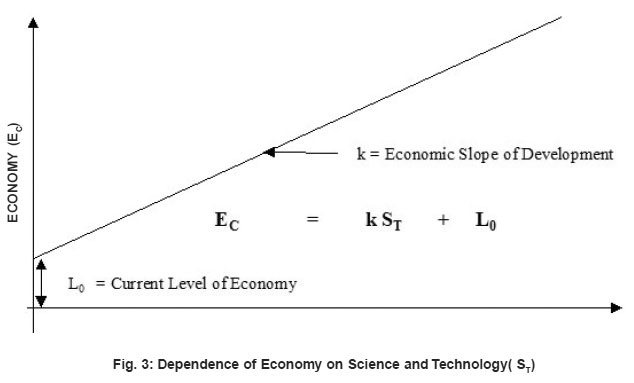 |
Figure 3: Dependence of Economy on Science and Technology( ST) |
If the economy is doing extremely well (or revolutionized), the an exponential graph may be obtained as shown in Fig. 4. The exponential curve could arise when there is make revolutions in science and technology.
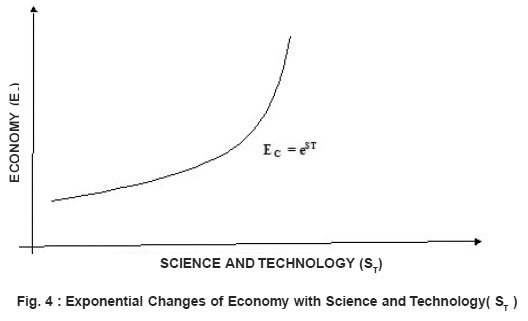 |
Figure 4 : Exponential Changes of Economy with Science and Technology( ST ) |
Fundamental Principle 2
We also know that Science and Technology (ST) is heavily dependent upon the development of research (R and D or simply RD). In other words, as RD increases, so will ST.
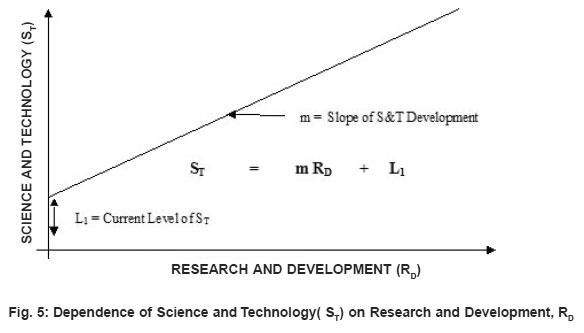 |
Figure 5: Dependence of Science and Technology( ST) on Research and Development, RD Click here to View figure |
Also the development of science and technology (ST) heavily depends upon research and development (RD). If we also assume a linear relationship, then another simple equation can be set up as in equation (ii). This is shown in Fig. 5.
ST = mRD + L1 …………..(ii)
Substituting ST in (i),
we get
EC = k ( mRD + L1) + L0 = kmRD + kL1 + L0 …….(iii)
EC = nRD + L2 ………….(iv),
Where n = km and L2 = kL1 + L0
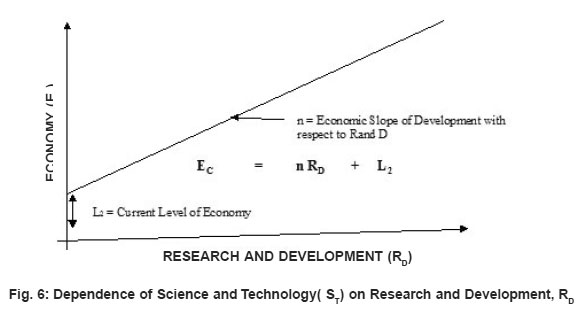 |
Figure 6: Dependence of Science and Technology( ST) on Research and Development, RD |
From the equation EC = n RD + L2 , n is a gradient that depends mainly upon the level of investment in Research and Development ( R&D). The graph shows that as the level of RD increases, the level of the economic development also increases. This is shown in Fig. 6. If there are major discoveries in RD, the impact on the economy could be exponential as indicated in Fig. 7.
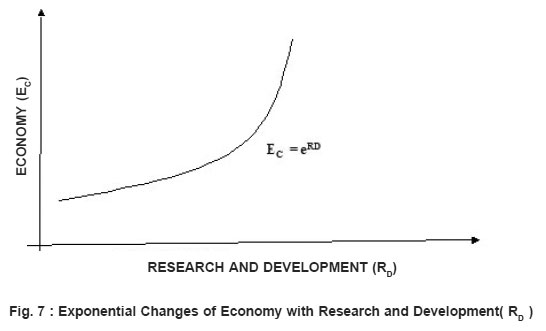 |
Figure 7 : Exponential Changes of Economy with Research and Development( RD) |
If a combination of the mixture of linear and exponential economic development occurs, we could have what is shown in Fig. 8.
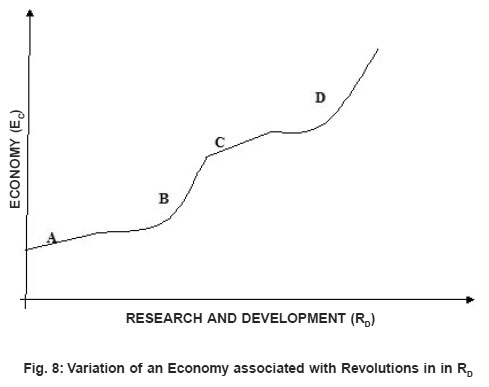 |
Figure 8: Variation of an Economy associated with Revolutions in in RD Click here to View figure |
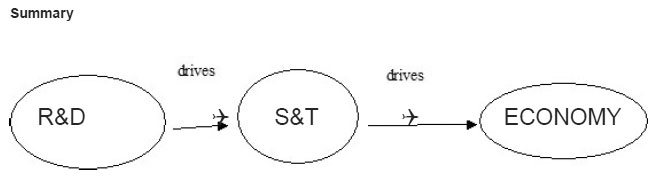
Summary
 |
Graph 1 |
In other words, Research& Development drives Science &Technology and Science &Technology drive the economy.
Some of the Major Inventions in Science and Technology
The major breakthroughs in inventions (R&D) began around 1800. The following is a list of some of them3.
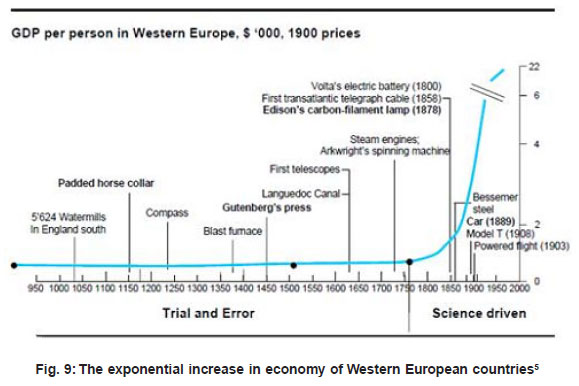 |
Figure 9: The exponential increase in economy of Western European countries5 |
1800-1900 Period 1800 Battery
Gas lighting, steam-powered locomotive, electric light, improved printing, plastic surgery, photographic camera, miner's lamp, stethoscope, balloon, cement, electromagnet, matches, microphone, typewriter, Braille printing, sewing machine, reaper, electric dynamo, corn planter, refrigerator, propeller, revolver, telegraph, postage stamp, Morse code, platform scale, rubber vulcanization, bicycle, hydrogen fuel cell, stapler, first vulcanized rubber, anesthesia for tooth extraction, antisceptics, dental chair, safety pin, dishwasher, advanced sewing machine, gyroscope, manned glider, fiber optics, rayon, washing machine, internal combustion engine, elevator, machine gun, dynamite ( 1866, Alfred Nobel), modern typewriter, traffic lights, barbed wire, telephone, carpet sweeper, first moving pictures, practical long-lasting bulb, toilet paper, modern seismograph, film for cameras, automatic player piano, fountain pen, coca cola, radar, gramophone, contact lenses, drinking straws, AC motor and transformer, escalator, dieselfueled combustion engine, vacuum flask, zipper, roller coaster, and motor-driven vacuum cleaner
1900-2000 Period
Disposable razor blades, powered controlled airplane, parachute, liquid fuel rocket, electronic television, sliced bread, antibiotics, ballpoint pen, helicopter, Geiger counter, gyrocompass, Haber Process, neon lighting, x-ray, cruiser missile, ultra centrifuge, insulin, computer, credit card, communication satellite, bullet train, microwave oven, integrated circuit, laser, video game, Rubik's cube, mobile phones, compact disc, global positioning system, Viagra, plasma television, World Wide Web, Memory card, DNA fingerprinting, Internet, Artificial heart, digital camera, personal computer, ARPNET, automatic teller machine, electric compact calculator, and synthetic diamond, computer mouse, packet switching, space station, email, oil eating bacteria, and genetically modified organisms(GMOs).
2001- Present
Artificial liver, fuel cell bike, self-cleaning windows, Braille Glove, Phone tooth, Nano-tex, birth control patch, foveon camera chip, date rape drug spotter, solar tower, virtual keyboard, optical camouflage system, hybrid car(Toyota), Ice Bike, Infrared fever screening system, No-contact Jacket, Thinking shoes, Flower Sound, and SonoPrep.
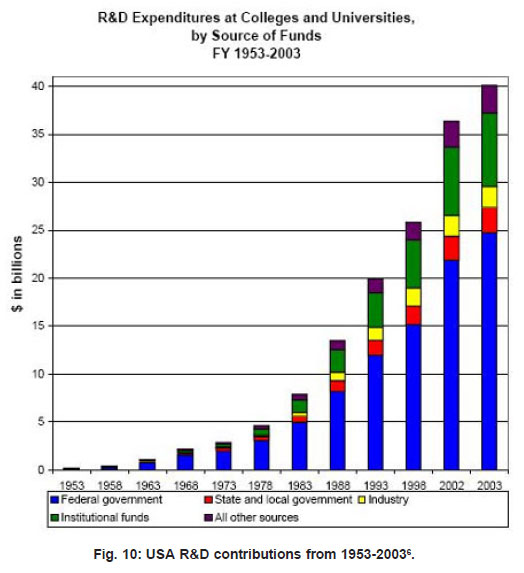 |
Figure 10: USA R&D contributions from 1953-20036. Click here to View figure |
Impact of Research and Development on the Economy
The most Important Economic Fact of the last Century
GDP has Increased 30 fold (Samuelson)
Discussion
There are three modules proposed for the economic development namely:- the linear module (Fig. 6), the exponential module ( Fig. 7) and the mixed module (Fig. 8). However the reality on the ground indicate that if Science and Technology with its R&D are properly implemented, the economic gains follow the exponential curve as shown in Fig. 9 of Western Europe countries4. It is also a good idea to assume that the Western European model can be adopted to cover all the developed nations both collectively and singly. There are a number of factors that influence the exponential curve. Among others, these include :-the intensity of R&D (amount of GDP %), the rate of implementing R&D(the capacity, commitment and skills of the people involved in the implementation of R&D), and duration of implanting R&D(how long it has taken implementing R&D). As these factors vary from country to country, the levels of economic development do vary as well. For instance, since the second world war, USA invested heavily in S&T and R and D. The R and D investment rose from about 0.1 billion per year in 1953 to 40 billion per year in 2003. This rose to US$ 51.9 billion6. This is about 51,900% increase. This is illustrated by Fig. 105.
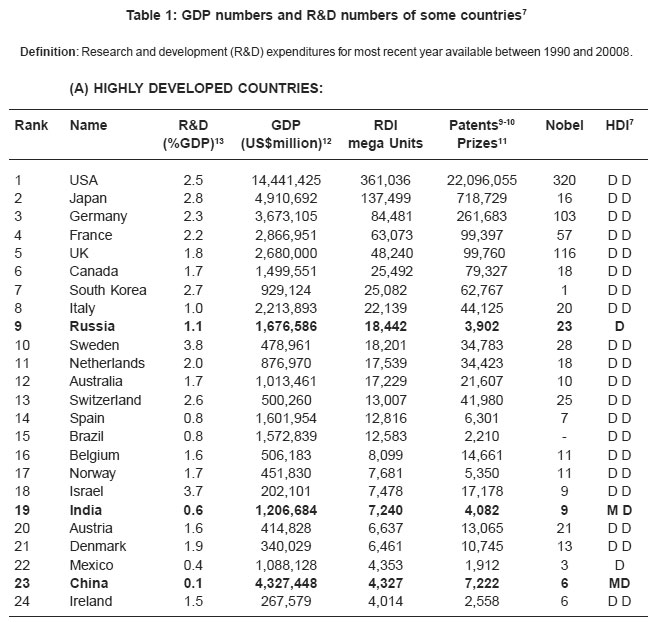 |
Table 1: GDP numbers and R&D numbers of some countries7 |
Malaysian Case Study
United States represents a case of a very highly developed country. Let us take Malaysia as a case of a medium developing country. She has increased her R&D rate from 0.22% GDP in 1996 to 0.70% in 20027. This is an increase of 318%. Furthermore, Malaysia invested heavily in science and technology capacity building6. Malaysian policy focussed on the following themes:
- Funding projects of high national priority and can be commercialized.
- Funding projects that address the needs of Malaysian Industry.
- Encouraging collaborative efforts among research institutions and
- Enhancing R&D linkages between public and private sector.
Categorization of World Countries
The nations of the world have been categorized in a number of ways. These include, Rich and Poor countries, First world, Second world and Third world countries, Developed and Developing countries, the North and South countries. On the basis of the Human Development Index(HDI)7, the world countries have been classified as VERY HIGHLY DEVELELOPED COUNTRIES , HDI = 0.950 AND OVER, D= HIGHLY DEVELOPED COUNTRIES, HDI = 0.800 0.900,MD =MEDIUM DEVELOPED COUNTRIES, HDI = 0.500-0.799, and LD = LOWLY DEVELOPED COUNTRIES, HDI= BELOW 0.500. Human development index takes into account the Life Expectancy, the Knowledge and Education and Standard of living8. Since a modern economy depends heavily upon Research and Development, we can develop another concept defined as the product between R&D % of GDP and the GDP itself. We can call the number so obtained, Research Development Index(RDI in mega units).The countries of the world can then be arranged according to the RDI values. The list of countries so obtained is shown in Table 1 along with some other relevant information. This allows us to categorize world nations into three groups, namely HIGLY DEVELOPED COUNTRIES ( RDI = 4000 and above), MEDIUM DEVELOPED COUNTRIES (RDI = 3999 -500), and LOWLY DEVELOPED NATIONS(RDI = below 500). RDI appears to be more realistic than HDI. For instance, Russia is and India and China are put in the second and third ranking levels of development by HDI respectively (see Table 1)while RDI scale puts them in the first rank of developed countries. They have advanced technologies including nuclear capabilities with huge economies and it is not a surprise therefore that are even members of the current G20 countries. It is rather unfair for HDI to put Malaysia and Singapore into the 2nd rank while the economic giant China into the 3rd rank. It is also quite amazing that small economies such as Iceland and Cyprus are regarded as 1st rank developed in comparison to Russia, China and India. These anomalies have been addressed by the RDI ranking.
Definition: Research and development (R&D) expenditures for most recent year available between 1990 and 2008.
(A) Highly Developed Countries :
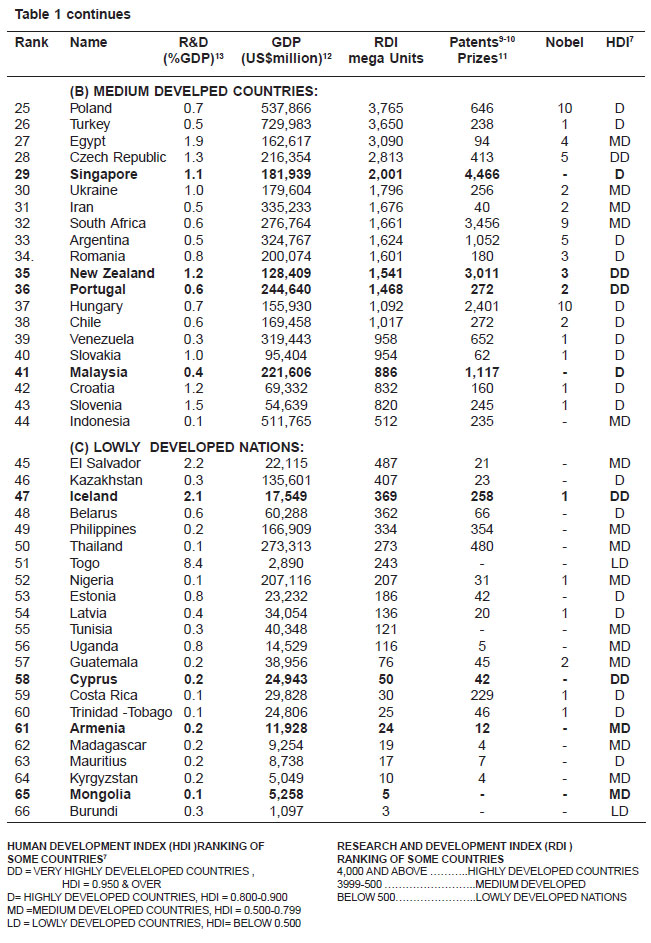 |
Table 1 continues Click here to view table |
Human Development Index (HDI ) Ranking of some Countries7
DD = VERY HIGHLY DEVELELOPED COUNTRIES , HDI = 0.950 & OVER D= HIGHLY DEVELOPED COUNTRIES, HDI = 0.800-0.900 MD =MEDIUM DEVELOPED COUNTRIES, HDI = 0.500-0.799 LD = LOWLY DEVELOPED COUNTRIES, HDI= BELOW 0.500
Research and Development Index (RDI ) Ranking of some Countries
4,000 AND ABOVE ………..HIGHLY DEVELOPED COUNTRIES 3999-500 ……………………..MEDIUM DEVELOPED BELOW 500…………………..LOWLY DEVELOPED NATIONS
HDI has some contradictions. For instance, Russia is put into the same category as Trinidad an Tobago, Malaysia , Costa Rica, or Mauritius. In RDI categorization, Russia, China and India are powers to reckon with and hence they can be regarded as highly developed countries.
The Impact of RDI on various Key Sectors of the Economy
The RDI units are proportional to the amount o funding available for investment in research and development activities of a nation. The mor RD units are invested, the more the research output, the faster the economy grows. The Research and Developments funds are usually given to those institutions that have the capacities an talents to conduct research. These include among others, universities, research centres research institutes, research corporations, certain government units, industrial parks, incubation centres The RDI units of USA are greater than those of the combined RDI units of Japan, Germany France, UK and Canada. It is not a surprise therefore that the top 10 ranked universities(Jul 200 by webometrics) associated with production of a total of 409 Nobel Prize winners are from US and among the top 50 universities (webometrics ranking January 2008), 44 are from USA. Thi year (2009), six US universities namely, John Hopkins, University of California, San Francisco University of Wisconsin- Madison, University of Michigan, University of California-Los Angeles and University of California-San Diego received more than US$ 6 billion for research from Government14. It was through R&D that Stanford University immensely contributed to th creation of the SILICON VALLEY15. Also the RAND corporation16 has done tremendous amoun of work to boost the American economy through research and development. Research Institute are also well funded. Among the top 10 research institutes 8 are from USA17. It should be note that some countries divert some of the R&D funds into military related research. America also tops the list of 2009 in military expenditure of US$ 607.0 billion(41.5% of world total)18.
The Status of RDI Levels in Africa
Africa's Vision
During African liberation struggle, the rallying call was "no country is free until every inch of the continent is free". After the liberation struggle, some African countries have even took further steps to set a time frame by which they will be as highly economically developed as today's developed countries19. Examples are given in Table 1.
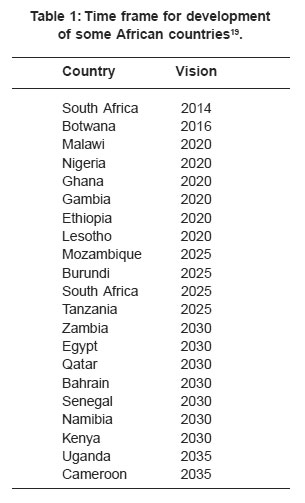 |
Table 1: Time frame for development of some African countries19. Click here to view table |
As can be seen from the table, the pledge is within the next 10-25 years from today, that these countries will be as developed as say USA, Sweden or Australia or even Russia. Unfortunately given the prevailing low levels of Research and Development in most of the African countries, the VISIONS may turn out to be nothing but 'pipe dreams'.
According to a journalist, Gumisai Mutume who attended the AU meeting of the Heads of State in Addis Abbaba in 2007, he reported as follows: "At a January 2007 summit of the continent's political body, the African Union, Heads of State "strongly urged" all AU countries to allocate at least 1 per cent of their gross domestic product(GDP) to research and development by 2020.
They also pledged to revitalize African universities - many of which have declined due to dwindling support over the last few decades – and to promote the study of science and technology by young people.
Declaring 2007 the year of science and technology, the leaders, who met in Addis Ababa, Ethiopia, agreed to a series of other initiatives to promote S&T in Africa."
As can be seen from Table 1, the RDI levels for the few African countries represented are extremely low. Even if the data were available for other missing African countries the picture would not change much. Egypt which is topping the African list has RDI of 3,090 units as compared to USA which is topping the world with 361,031 units. Egypt is about the same level as that of Turkey. The next ranked in Africa is South Africa with 1,661 RDI units. The lower value of South Africa as compared to Egypt is mainly due to its low R&D percent of 0.6 as compared to 1.9 for Egypt. The R&D percentage of 0.1 for the oil giant Nigeria is quite embarrassing. It is quite amazing that Togo has a R&D figure of 8.4%. This needs to be verified. If it is true, this is extremely encouraging and we hope it will be maintained. The combined RDI units for Egypt, South Africa, Nigeria, Madagascar, Mauritius, Uganda, and Burundi are 5,356. This above that of Mexico and lower than that of Denmark.
These observations are in line with other findings20-21.
- The African continent has 14.5 % of global population.
- It has 1.1% of the world's scientific researchers.
- It has 1 scientist/engineer for every 10,000 people as compared to 20-50 for developing countries and • Science and technology gap between Africa and the rest of the world is on the rapid increase.
Recommendations for Stimulating R&D in Africa
- Total commitment and belief in S&T.
- Put in place and implement S& T policies.
- Massive mission-oriented education in S&T.
- Heavy investment in R&D at universities and research centres.
- Promote incubation centres and science parks.
- Create and promote the culture of spin-off companies.
- Pay special attention to information technology(IT).
- Cut down on military expenditure and divert the funds to R&D.
References
- (a) UNIDO representative in Lesotho; http://www.lesotho.gov.ls/articles/2009/INDUSTRIAL_DEV_ENGINE.php; downloaded 11-12-09 (b) Indian Prime Minister Atal Bihari Vajpayee;http://www.siliconindia.com/ shownews/Science_and_technology_ the_engine_to_economic_growth_Vajpayeenid- 18099.html; downloaded 11-12-09. (c) Wan Gang , Chinese Minister of Science and Technology; http://www.sourcejuice.com/ 1245572/2009/08/25/Science-Technology- Minister-Wan-;Gang-new-engine-economicgrowth/
- Richard G. Lipsey, Peter O. Steiner, and Douglas D. Purvis, "Economics" 8th Edition, Harper & Row Publishers, New York,1987.
- Timeline of historic inventions; http://en. wikipedia.org/ wiki/Timeline_ of_ historic_ inventions; Downloaded 15-11-09.
- http://www.tim.ethz.ch/education/courses/ courses_fs_2009/course_ti_fs_2009/ Session03_Technology_and_growth_Bou.pdf; downloaded 29-11-09.
- http://www.aaas.org/spp/rd/opm510. pdf;downloaded 19-11-09.
- http://portal.unesco.org/education/en/files/ 55597/11999609765MALAYSIA.pdf/ MALAYSIA.pdf; downloaded 29-11-09.
- http://en.wikipedia.org/wiki/ List_of_countries_by_Human_Development_ Index; downloaded 29-11-09


