Seasonal variation in physico- chemical characteristics of ground water on the bank Uyyakondon channel of river Cauvery at Tiruchirappalli - Tamil Nadu, India.
A. Abdul Jameel1 * and A. Zahir hussain1
1
Department of Chemistry,
Jamal Mohamed College,
Tiruchirappalli,
India
http://dx.doi.org/10.12944/CWE.4.2.11
The groundwater quality on water samples were taken near the bank of channel on both sides and the other two samples were taken nearly ½ km away from the channel at 5 stations. The study was carried out for summer and rainy seasons of 2003. The samples were subjected to Physico- chemical analysis. High alkalinity, TDS, TH, Na and No3, BOD and COD were observed at ground water stations.
Copy the following to cite this article:
Jameel A.A, Hussain A.Z. Seasonal variation in physico- chemical characteristics of ground water on the bank Uyyakondon channel of river Cauvery at Tiruchirappalli - Tamil Nadu, India. Curr World Environ 2009;4(2):341-346 DOI:http://dx.doi.org/10.12944/CWE.4.2.11
Copy the following to cite this URL:
Jameel A.A, Hussain A.Z. Seasonal variation in physico- chemical characteristics of ground water on the bank Uyyakondon channel of river Cauvery at Tiruchirappalli - Tamil Nadu, India. Curr World Environ 2009;4(2):341-346. Available from: http://www.cwejournal.org?p=200/
Download article (pdf) Citation Manager Publish History
Introduction
Water plays an indispensable role in every species that survive in this world and is required by all living organisms for their existence. Though water is a renewable resource, reckless usage and improper management water system may cause serious problems in availability and quality of water. Water may be contaminated by various means, chemically and biologically and become unfit for dr inking and other uses. The increasing industrialization, urbanization, agricultural and other human activities have caused enor mous deterioration in the quality of various natural water bodies, particularly rivers and ground water in d eveloping countr ies like India. In spite of considerable purification of river, unabated disposal of sewage and industrial wastes are deteriorating the quality of both ground and river water. Tiruchirappalli is one of the most important industrial cities in Tamilnadu and it is situated on the bank of river cauvery and at the center of Tamilnadu. Industries of diverse fields such as tanneries, pharmaceuticals, pesticides, fertilizer plants, dying, dairy, steel rolling mills, distillery etc, are located in and around Tiruchirappalli town. Uyyakondan channel is about 65.5 km long running through the heart of Tiruchirappalli as a tributary of river Cauvery. It originates from pettavaithalai and completing its course at Valavanthankottai (20 km east of Tiruchirappalli town). It flows across about 60 villages. The channel water is used for domestic and irrigation pur poses and it irrigates 1311 hectares.
There is no proper management and planning for the disposal of municipal sewage at Tiruchirappalli. The city generates the organic and inorganic wastes of about 250-300 tonnes per day and the municipal corporation is dumping them in the Dump yard at Ariyamangalam. The typical sewage compr ising of domestic and other wastewater are discharging directly into the channel without any proper treatment. The garbage dumping sites of Palakarai, Ar iamangalam, Kattur, Thiruverumbur and Valavanthankottai are located around the bank of the Uyyakondan channel. Moreover the rainwater percolates through the dumping site, which decomposes the waste and liquid leachate thus produced, can easily enter into the watercourses or ground water. Hence the present investigation has been attempted to study the physico-chemical characteristics of the ground water at Tirchirappalli.
Materials and Methods
The ground water samples were taken from the bore wells on either side of the bank of Uyyakondan channel [1A-5A, 1B-5B] of each station. Two other samples were collected nearly a kilometer away from the banks at all the stations [1C-5C, 1D-5D].
Sample Collection
The samples were collected in plastic cans. Prior to use, cans were cleaned thoroughly rinsing with distilled water. They were dried, cooled and labeled. For the estimation of DO, BOD and COD, well-sterilized BOD bottles were used. All necessary precautions were taken during sampling analysis and transpor tations of water samples to the laboratory.
The first part of the analysis includes the physico-chemical parameters such as , pH, electrical conductivity, total dissolved solids, total hardness, carbonate, bicarbonate, chloride, sodium, potassium, calcium, magnesium, nitrate, fluoride, sulphate, biochemical oxygen demand, chemical oxygen demand and dissolved oxygen3 . Preservatives such as conc. HCl and conc. H2SO4 were added to the samples used for COD.
The pH of the water sample was measured by a glass electrode and electrometer type pH meter (Elico-model L1-12T) after taking necessar y precautions in sampling and standardization. Conductivity was measured using Digital Conductivity Meter (Elico-Model CM-180).
Results and Discussions
pH
pH value is an impor tant factor in maintaining the carbonate and bicarbonate levels in water. The mean pH values are recorded within the range of 7.7-8.2 and 7.5-8.2 for ground water samples in both summer and rainy seasons respectively (Table 1 & 2). The pH values are found to be within the permissible limit of WHO (6.5 - 8.5) in all the sampling stations for ground water samples. There are no abnormal changes in both seasons. The slight alkalinity seen for ground water as well as water samples may be due to the presence of bicarbonate ions, which are produced by the free combination of CO2 with water to form carbonic acid, which affects the pH of the water. Carbonic acid (H2CO3) dissociates partly to produce (H+) and bicarbonate (HCO3) ions 6.
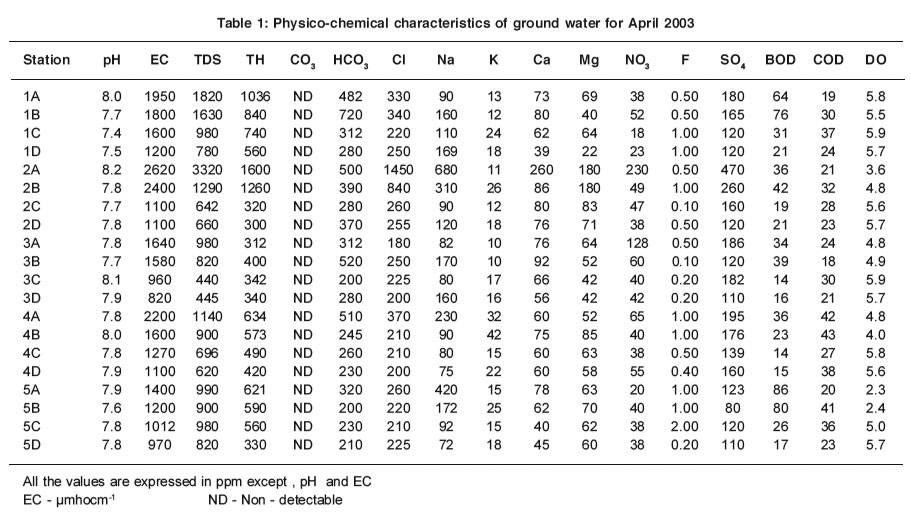 |
Table 1: Physico-chemical characteristics of ground water for April 2003 Click here to view table |
The pH values increase slightly for ground water samples in all the sampling stations in summer. The slight depletion of pH during rainy season may be attributed to seasonal dilution effect2. The low pH does not cause any harmful effect1.
Electrical Conductivity
The mean EC values are within the range of 820 - 2620 µmhocm-1 and 680 - 5600 µmhocm-1 for the ground water samples in summer and rainy seasons respectively (Table 1 & 2). The importance of EC is its measure of salinity, which greatly affects the taste and has a significant impact of the user acceptance of the water as potable5. Higher the ionisable solids greater will be the EC. The EC values are well above the permissible limit of WHO (600 µmhocm-1) for ground water samples. The ground water samples which are very near to the channel have maximum EC and that the values decrease for the samples collected far away from the channel. The EC values are high in summer except at station 2A for ground water samples and it EC values may be due to the increase in evaporation of water molecules.
Total Dissolved Solids
The mean TDS values are found within the range of 440 - 3320 ppm and 450 - 3655 ppm for ground water samples in summer and rainy seasons respectively (Table 1 & 2 ).Most of the ground water samples show higher TDS values that are well above the permissible limit of WHO (500 ppm). The maximum TDS values are observed at stations 1A - 10A and 1B - 10B in summer and rainy seasons.
Total Hardness
The mean TH values are within the range of 300 -1600 ppm and 210 -1500 ppm for ground water samples in both summer and rainy seasons respectively (Table1 & 2). TH values exceed the desirable limit of WHO (300 ppm) in all the stations for ground water samples except at stations 1A-5A and 1B-5B in summer and rainy seasons. These stations are adjacent to the channel. At the same time low TH values are observed at stations 1C-5C and 1D-5D that are located far away from the channel. It clearly indicates that high value of TH of ground water near the channel is due to the impact of channel water containing solid wastes.
Alkalinity (Carbonate And Bicarbonate)
The carbonates are not detectable for ground and channel water samples in both seasons. The mean values of bicarbonate are recorded within the range of 200 - 500 ppm and 118 - 606 ppm for ground water samples in summer and rainy seasons respectively (Table1 & 2).
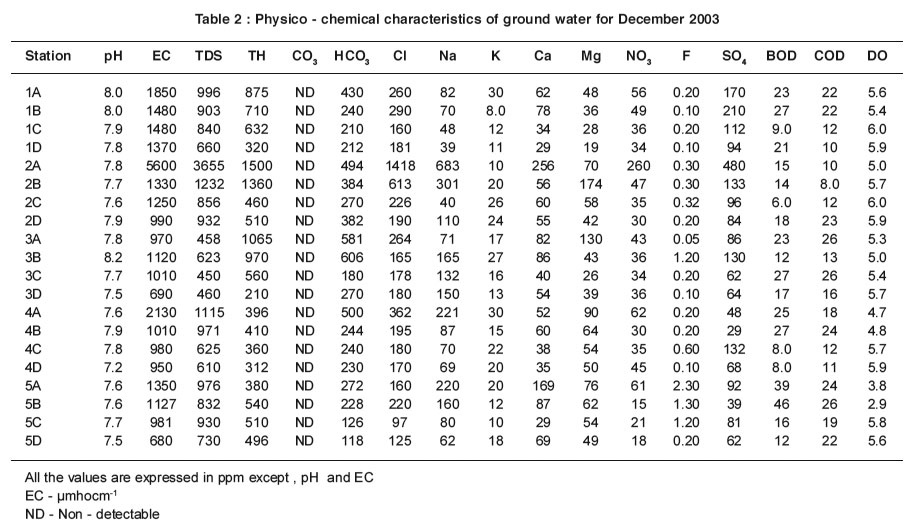 |
Table 2 : Physico - chemical characteristics of ground water for December 2003 Click here to view table |
Even though the carbonate alkalinity is absent, the total alkalinity is found which may be due to the accumulation of bicarbonates .The bicarbonate values are within the permissible limit of 8 (500 ppm) for most of the ground water.
Chloride
The mean values of chloride are found in the range of 180-1450 ppm and 97 -1418 ppm for ground water samples in summer and rainy seasons respectively (Table1 & 2).
The percolation of channel water and intrusion of sewage activities reduce the chloride level when the distance is increased. Thus the samples 1C-5C and 1D-5D have low chloride level. High value of chloride is recorded at station 2A in summer due to the increased rate of percolation of agricultural land water and domestic sewage.
Sodium
The mean values of sodium are within the range of 72-680 ppm and 39-683 ppm for ground water samples in summer and rainy seasons respectively (Table1 & 2).
The sodium values exceed the desirable limit of WHO (200 ppm) in most of the ground water samples. The ground water samples, which are very near to the channel have maximum sodium values than that for the samples collected far away from the channel.
Potassium
The mean values of potassium are recorded between the range of 10-42 ppm and 8-30 ppm for ground water samples in summer and rainy seasons respectively (Table 1 & 2). The values of potassium exceed permissible limit of 12 ppm in most of the ground water samples in summer and rainy seasons. The values of potassium fluctuate in ground water samples stationwise.
Calcium and Magnesium
The mean values of calcium and magnesium are recorded in the range of 40-260 ppm and 29-256 ppm for ground water samples in summer and 22-180 ppm and 19-174 ppm in rainy season respectively (Table1 & 2). The calcium and magnesium values are within the permissible limit of WHO (200 and 150 ppm respectively) for most of the ground water samples. But the calcium values are high at station 2A. High values of magnesium are found at stations 2A and 2B. Stations 2A and 2B are surrounded by agricultural field.
Nitrate
The mean nitrate values are observed within the range of 18-230 ppm and 18-260 ppm for all ground water samples in summer and rainy seasons respectively (Table1 & 2). Nitrate values exceed the permissible limit of 45 ppm for most of the ground water samples. The ground water samples, which are nearer the channel, have maximum nitrate values and the values decrease for the samples collected far away from the channel.
Fluoride
The mean fluoride values are recorded within the range between 0.10-2.0 ppm and 0.05-2.30 ppm for ground water samples in summer and rainy seasons respectively (Table1 & 2).In the present study the values of fluoride are in the close range of permissible limit of WHO (1.0-1.5 ppm) for most of the ground water sample.
Sulphate
The mean values of sulphate are found in the range of 80-260 ppm and 39-480 ppm for ground water samples in both summer and rainy seasons respectively (Table 1 & 2).Sulphates occur naturally in water as a result of leaching from gypsum and other common minerals. Sulphate may come into the ground water by industr ial or anthropogenic addition and in the form of sulphate fertilizers.The values of sulphate are within the permissible limit of 250 ppm (WHO) in most of ground water samples except stations 1B, 2A .
Biochemical Oxygen Demand (BOD)
The mean values of BOD are between the range of 14 - 86 ppm and 6.0 - 39 ppm for the ground water samples in summer and rainy seasons respectively (Table 1 & 2).
In the present study, the values of BOD are found to exceed the permissible limit of WHO (5.0 ppm) for ground water samples in summer and rainy seasons. High values recorded in summer may be attributed to the maximum biological activity at elevated temperatures where as the lowest BOD in rainy season may indicate lower biological activity. There is an inverse relationship between DO and BOD4,7.
Chemical Oxygen Demand (COD)
The mean COD values are within the range of 18-43 ppm and 8-26 ppm for ground water samples in summer and rainy seasons respectively (Table1 & 2).
COD values exceed the permissible limit of 10 ppm in all the sampling stations for ground water, which indicate the pollution by biodegradable and chemically degradable organic matter.
Dissolved Oxygen (DO)
The mean values of DO are recorded within the range of 2.3-5.8 ppm and 2.9-6.0 ppm for all the ground water samples in summer and rainy seasons respectively (Table 1 & 2). During the study period, the seasonal changes in oxygen content have been recorded. The general trend of changes in DO concentration in different seasons are directly or indirectly governed by fluctuations of temperature and BOD. Higher values of DO are recorded in rainy season, the period during which the water temperature was lowest.
Conclusions
From the present study it is concluded that most of the ground water samples near the channel are much polluted by the intrusion of channel water. The ground water samples are much polluted in the summer than rainy seasons. Some of the ground water samples that are far away from the channel are also polluted due to anthropogenic activity and the soil nature. Hence, the polluted materials should be avoided while letting them into the channel. Some strict and effective measurements are urgently needed for safe the quality of ground water on the bank of Uyyakondan channel of river Cauvery at Tiruchirappalli.
References
- Abdul Jameel, A. Poll. Res.,(1998) 17(12): 111-114.
- Barnah, N.K., Kotoky, P., Bhattacharyya, K.G and Borah, G.C. Sci Total Env.,(1996) 193(1): 1-12.
- Goel, P.K. Water pollution - Causes, Effects and Control. New age Int. (P) Ltd., New Delhi. (2000).
- Indira Bai, W.P.S and Seenamma George. Poll, Res.,(2002) 21(2): 209-214.
- Jain, P.K. Poll. Res.,(1996) 15(4): 407 - 409.
- Jha, A.N. and Verma, P.K. Poll. Res.,(2000) 19(2): 75 - 85.
- Sengar, R.M.S., Sharma, K.D and Pathak, P.D. Indian, Bot. Soc.,(1985) 64: 365-376.
- World Health Organisation, Environmental health criteria-3, World Health Organisation, Geneva (1977).


