Seasonal variation in the aquatic environment of Industrial effluents of Sitapura industrial area (Pre-monsoon and monsoon season 2007)
Rajni Agarawal1 * , S. K. Sharma1 and U. Jha2
http://dx.doi.org/10.12944/CWE.4.2.18
A comparative study has been carried out to study the variation in the quality of industrial effluent of Sitapura Industrial Area, Jaipur in pre-monsoon and monsoon season. The industrial effluent samples were analysed for various parameters like pH, Electrical Conductivity, Total dissolved solids, Total suspended solids, Total solids, Sodium, Potassium, Chloride, Nitrate, Hardness, Total Alkalinity, Sulphate, Phosphate, Fluoride, Chemical Oxygen Demand and Dissolved Oxygen were analysed in pre-monsoon and monsoon season and the results of analysis indicated that most of the parameter were at higher level in the pre-monsoon season.
Copy the following to cite this article:
Agrawal R, Sharma S.K, Jha U. Seasonal variation in the aquatic environment of Industrial effluents of Sitapura industrial area (Pre-monsoon and monsoon season 2007). Curr World Environ 2009;4(2):385-388 DOI:http://dx.doi.org/10.12944/CWE.4.2.18
Copy the following to cite this URL:
Agrawal R, Sharma S.K, Jha U. Seasonal variation in the aquatic environment of Industrial effluents of Sitapura industrial area (Pre-monsoon and monsoon season 2007). Curr World Environ 2009;4(2):385-388. Available from: http://www.cwejournal.org/?p=990
Download article (pdf) Citation Manager Publish History
Introduction
The industries, which are burgeoning at a fast rate, produce about 55,000 million m3 of waste water per day, out of which 68.5 million m3 is discharged into rivers and streams.1 Resulting the degradation of water resources, urban pollution increases rapidly by industrial development. Industrialization and urbanization lead to generation of large volumes of waste water from domestic, commercial and industrial purposes. The industrial effluent from Sitapura Industrial Area (SIA), Jaipur is discharged into the nearby drain. Which may effect the quality of underground water in the nearby area.2 Therefore a attempt has been made to study the physico-chemical characteristics of effluent of various industries located in SIA and of mixed effluent in the pre-monsoon season and to compare the results with the results of monsoon season samples.
Materials and Methods
The industrial effluents of 3 textile industries, 4 pharmaceuticals industries, 4 printing industries, 4 food products industries, 3 samples of mixed effluents in both seasons i.e. pre-monsoon and monsoon season were collected. The samples were collected at the discharge points of different industries while mixed effluent samples were taken from the points where this mixed effluent is discharge into the nearby nala. These were systematically analysed. Samples were collected in sterilized bottles. The analysis of these samples were carried out using standard methods.3,4
The pH meter, Digital Conductivity meter, UV-VIS Spectrophotometer, Digital Flame Photometer instruments were used to determine pH, electrical conductivity, Nitrate, Sulphate, Sodium, Potassium, Phosphorus. While chloride, alkalinity, hardness, dissolved oxygen COD were determined by using titrimetric method, TDS and Suspended solids were determined by gravimetric method.
Results and Discussion
As per the table-1, the value of pH ranged from 6.21 to 8.76 during pre-monsoon season and from 6.3 to 8.6 during monsoon season. After comparison it is found that the mostly the pH value decreased in samples except few effluents samples. In these cases pH value slightly increased. A quick evaluation of acidic and alkaline nature of water can be done by the determination of pH which is an important parameter of water.5 The pH value of industrial effluents was under permitted limit of Industrial Effluent Standards in both season. The value of electrical conductivity ranged from 1.06 to 4.13 mmho/cm in the pre-monsoon season and in monsoon season from 1 to 3 mmho/cm. Electrical Conductivity of monsoon samples was low from pre- monsoon samples. During rainy season, dilution of water resulted in lowering the specific conductivity values. Landfill leachate, domestic sewage and urban factors affect the ground water systems.6 TDS values varied from 509.5 to 2431.5 mg/L of pre-monsoon samples and 680 to 2142 mg/L for monsoon samples. TDS of textile effluents and pr inting effluents decreased and TDS of pharmaceutical effluents also decreased except one sample in monsoon season. TDS of food products effluents and mixed effluents was increased except one sample in each. This may be excess use of preservatives, edible dyes, inorganic and organic chemicals. TDS of all samples are under permitted limit as per Industrial Effluent Standards. Total Suspended Solids were found in the range of 1.2 to 1239.6 mg/L of pre-monsoon samples and 1.6 to 860.6 mg/L of monsoon samples. TSS of few samples was increased in monsoon season. TSS of few samples was at higher side from the permitted limit of Industrial Effluent Standards.
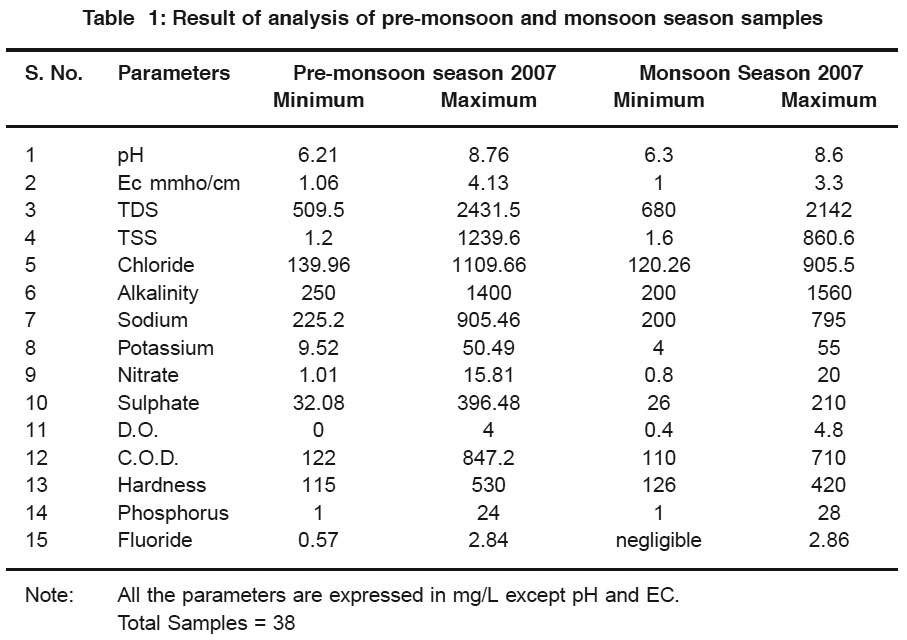 |
Table 1: Result of analysis of pre-monsoon and monsoon season samples Click here to view table |
Chloride value varied from 139.96 to 1109.66 mg/L of pre-monsoon samples and from 120.26 to 905.5 mg/L of monsoon samples. The chlor i de value of all effluents samples wa s decreased in monsoon season. Total alkalinity of all samples was noted from 250 to 1400 ppm in pre-monsoon season and from 200 to 1560 ppm in monsoon season. Alkalinity values of mostly all samples were decreased in monsoon season except few. The value of sodium and potassium were in the range of 225.20 - 905.46 ppm and 9.52 - 50.49 ppm in pre-monsoon samples and 200 - 795 ppm and 4-55 ppm in pre-monsoon samples. Sodium and potassium value of mostly all samples were decreased in monsoon season except few samples. The nitrate values were found from 1.01 to 15.81 mg/L in pre-monsoon samples and from 0.8 to 20 mg/L in monsoon samples. The nitrate values were observed under permitted limit. Nitrate value of mostly all samples was increased in monsoon season except few. Its higher values during monsoon period may be due to addition of nitrates into water run off from agricultural fields.7,8
The sulphate value varied between 32.08 to 396.48 in pre-monsoon samples and 26 to 210 mg/L in monsoon samples. Sulphate of mostly all samples was decreased in monsoon season except few. Dissolved Oxygen values were noted from 0 to 4 mg/L of effluents samples of pre-monsoon season and 0.4 - 4.8 mg/L of effluents samples of monsoon season. The dissolved oxygen in some effluents was absent in both seasons. D.O. decreased in some samples in monsoon season. COD was found to be from 122 to 847.2 mg/L in pre-monsoon season and from 110 to 710 mg/L in monsoon season. COD values of all effluents samples were found on the lower side in monsoon season in comparison to its value for pre-monsoon season samples. Some of the samples had higher COD value as per Industrial Effluent Standards. The value of COD should not exceed 400 mg/L. Hardness found to be from 115 to 530 in samples of pre-monsoon season and from 126 to 420 mg/L in samples of monsoon season.
Hardness of mostly all samples was decreased in monsoon season except few. The value of phosphorus varied between 1 to 24 mg/L in samples of pre-monsoon season and 1 to 28 mg/L in samples of monsoon season. The observed Phosphorus of mostly all samples was decreased in monsoon season except few. Fluoride in pre- monsoon samples was noted from 0.57 to 2.84 mg/ L and from negligible to 2.86 mg/L in monsoon samples. Mostly the fluoride was found lower in monsoon season except few.
Conclusion
Physico-chemical analysis of effluent samples of SIA, Jaipur in pre-monsoon and monsoon season revealed that, the concentration of most of the parameters decreased during the monsoon season, which may be dilution of effluent with rain water. During monsoon season, the run- off from the nearby agriculture field may be one of the reasons for the increased concentration of the nitrate and TSS in few effluent samples.
Acknowledgements
We are highly grateful to Dr. H. C. Pande, Vice Chancellor Emeritus, BIT and Dr. Abhinav Dinesh Director BIT Extension Centre, Jiapur for continued encouragement, useful suggestions and providing necessary facilities.
References
- http://www.wr min.nic.in. Development Alter natives. Sustainable water Management.
- Agarwal R., Shar ma S. K. and Jha U., Assessment of Industrial effluent and underground water during monsoon season 2007 in Sitapura Industrial Area, Jaipur, Current World Environ.,(2009) 2(1): 71-77.
- 'APHA, Standard Methods for the Examination of Water and Waste Water' Amer ican Public Health Association, Wahington D.C. 20th ed New York (1998).
- HLS Tondon, Method of Analysis of soils, plants, waters and fer tilizers. Fer tilizer Development and Consultation Organisation, New Delhi, India, 144+vi (1995).
- Anandhaparanmeswari N., Hemalatha S., V., Vidhyalakshmi G. S. and Shakunthala K., Groundwater quality character istics at Sivalingampillai layout, Udumalpet, Tamilnadu, Nature Environment and Pollution Technology,(2007)6(2): 333-334.
- Olaniya, M. S. and Saxena, K. L., Ground water pollution by open refuse dumps at Jaipur, Ind. J. Environ. Hlth.,(1977) 19: 176-188.
- Ranga, M. M., Limnological studies of Anasagar lake at Ajmer with special reference to planktonic population and physico-chemical properties of water, Ph. D. Thesis, M.D.S. University, Ajmer (1995).
- Sharma, D., Seasonal variation in different physico-chemical characteristics in Makroda reservoir of Guna district (M.P.), Ecology Environment and Conservation,(2001) 7(2): 201-204.


