Assessment of roadside ambient air pollution
Shyamli Singh1 * and Saurav Chakraborty1
1
Bhagwan Parshuram Institute of Technology,
Sector-17, Rohini,
Delhi ,
110 089
India
http://dx.doi.org/10.12944/CWE.5.1.33
Air pollution is one of the major consequences of environmental problems. Transport sector contributes nearly 70% of air pollution, thus proving to be the major culprit .The paper brings out the emission of particulate matter Particulates alternatively referred to as particulate matter (PM) or fine particles, are tiny particles of solid or liquid suspended in a gas. PM is a major component of air pollution that threatens both our health and environment. The study also brings out the relation between various meteorological parameters such as temperature, humidity, wind speed and wind direction
Copy the following to cite this article:
Singh S, Chakraborty S. Assessment of roadside ambient air pollution. Curr World Environ 2010;5(1):193- 196 DOI:http://dx.doi.org/10.12944/CWE.5.1.33
Copy the following to cite this URL:
Singh S, Chakraborty S. Assessment of roadside ambient air pollution. Curr World Environ 2010;5(1):193- 196. Available from: http://www.cwejournal.org/?p=1150
Download article (pdf)
Citation Manager
Publish History
Introduction
One of the important environmental problems as the consequence of the development growth is the air pollution. Air is required as a resource for life, therefore it is indispensable for us to check and control its contamination due to human activities.
The increase in transport sector in the last few years has promoted a rise of the atmospheric pollution in the cities, becoming one of the main problems.
Motor vehicles and other types of gasoline powered transportation as well as diesel run vehicles contribute significantly to the total fine particulate matter thrown out into the atmosphere.¹ These pollutants cause different health and environmental diseases. For this reason, it is especially important to estimate the emissions of these pollutants and to evaluate their influence on the air quality so that the risks on public health and environment can be estimated, and therefore, to establish the relevant actions.
Air pollution in an urban environment can be related to a multiple source. However, vehicular and industrial sources are the worst culprits of environmental degradation in metropolitan areas. Metrological and topographical factors also play an important part in the dispersion and accumulation of the quantities of pollutants, irrespective of the quantities of pollutants generated.2 The prime objective of a study on pollutant levels is the control of noxious materials in the atmosphere. To achieve the objective, it is essential to understand the sources and chemical nature of various pollutants and their effect on materials and life processes. The present study is initiated with the above background and constitutes the following objective:
- Analysis of monitored data to find out the relation of Particulate Matter with meteorological parameters such as temperature, humidity, wind speed and wind direction
- Interpretation of analyzed data
Particulate Matter Monitoring
Particulates alternatively referred to as particulate matter (PM) or fine particles are tiny particles of solid or liquid suspended in a gas.³ PM is a major component of air pollution that threatens both our health and environment.
Instrumentation Particulate Matter Analyzer
The Particulate Matter Analyzer or Dust Monitor is an instrument to measure the concentration of particulate matter in the ambient air. It can measure the concentrations of TSP, PM10, PM2.5, PM1.0.A meteorological parameter measuring device was also connected to it to record data such as wind speed, wind direction, relative humidity and ambient air temperature.4
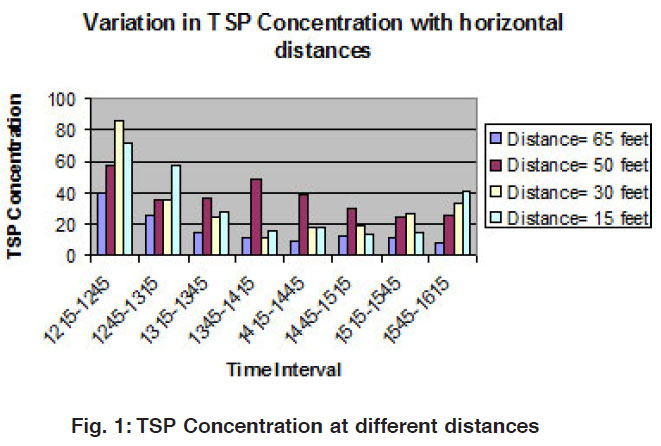 |
Figure 1: TSP Concentration at different distances Click here to view figure |
Theory of Operation
The particle size analyzer/dust monitor model used for the continuous measurement of particles in the air (aerosols). These particles can be reported in various models. However these measurements are determined in one of the two basic modes that are the ‘particle counts’ and ‘environmental mass’ (in ug/m3). These measurements are reported for the various size distribution channels.
The ambient air, to be analyzed is drawn into the unit via an internal volume controlled pump at a rate of 1.2 litres/ min. The sample passes through the sample cell, past the laser diode detector and is collected onto a 47-mm PTFE filter. The entire sample is collected on PTFE filter, which can then be analyzed gravimetrically for verification of the report aerosol’s mass.2 Additionally, further chemical analysis can be performed on the deposited residue. The pump also generates the necessary clean sheath air, which is filtered and passes through the sheath air regulator back into optical chamber. This is to ensure that no dust contamination comes in contact with the laser-optic assembly. This particle free airflow is also used for reference zero tests during the auto-calibration.
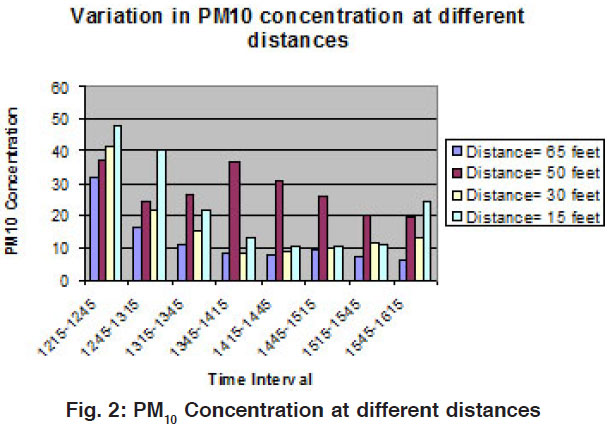 |
Figure 2: PM10 Concentration at different distances Click here to view figure |
Site Selection
The experimental assistance and guidance was provided by Central Road Research Institute an IS/ISO 9001:2000 R&D organization, was established in 1948 as a constituent laboratory of the Council of Scientific and Industrial Research (CSIR) hence the location selected for sampling are CRRI main gate located on National Highway -2
The basic criterion for the study of monitoring sites was that each sampling location should represent an air mass for the study requirement. For a study focused on monitoring the concentration levels of a particular region, site chosen was free from blowing air around the sampling point. Any obstacle should not intersect the 45 degree cone inscribed on the vertical axis of sampling instrument.³ The air particulate samples were collected from different distances from roadside.
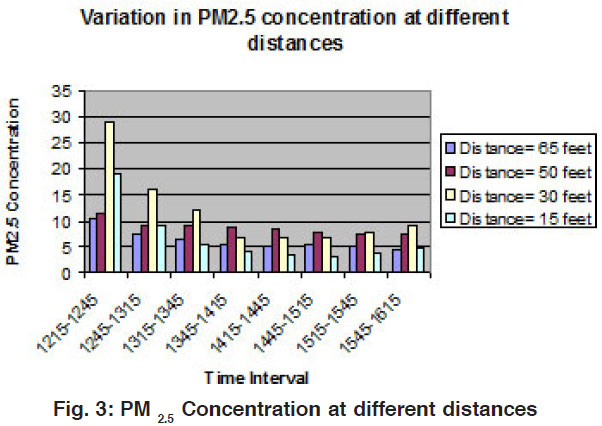 |
Figure 3: PM 2.5 Concentration at different distances Click here to view figure |
Experimentation
The Particulate Analyzer was installed at the site on different days at different distances. The housing of the instrument consisting of a wind speed and direction recorder was also set up. It was ensured that wind analyzer was fixed at a sufficient height so as to obtain a reliable and accurate meteorological data.4 Electricity was supplied to the instrument from an extension cord that was extended from security room plug point. The instrument was switched on and allowed to complete the ‘Self-Test’. The ‘Environmental Mode’ was selected and a sample period of ‘1 minutes’ was set. The instrument was allowed to warm up for 30 seconds after which it was placed at required location (i.e. at different distances on different days).6 The height was again not kept constant from ground level for different locations due to unavailability of levelled terrain. The instrument was left under the scrutiny of security guards to record the readings for around 4 hours everyday at different locations. The instrument is then switched off and brought back to laboratory everyday evening for data transfer
Data Analysis
The data analysis of the collected data was done using MS Excel. Distance variation of particulate matter concentration was plotted for the monitored period.
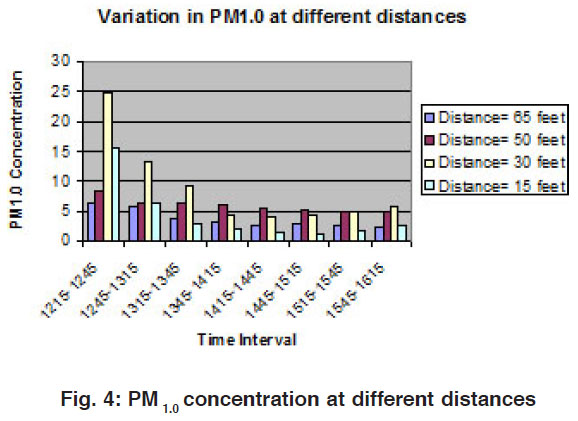 |
Figure 4: PM 1.0 concentration at different distances Click here to view figure |
Conclusion
The above data clearly shows that the concentration of Total Suspended Particulate (TSP) and PM10 concentration increases nearby road. But we observed few peaks for 2 hour time slot when we obtained the data from 50 feet, which were higher then the peaks observed when it was kept at 15 feet distance from roadside. So for its clear analysis a regression analysis was carried out between particulate concentration and meteorological parameters. On analysis it was found that it shows a good relation of R= 0.4843 as compare to other days analysis, which gives R values nearby zero.However along that we also observed a dip in PM2.5 and PM1.0 concentration at 15 feet distance from roadside (nearest distance to road) as compared to concentrations observed at its previous distances. This is due to the reason that nearby road only particulates found were released by vehicles either by there emissions or due to the friction between vehicle tyres and road surface, as roads are of concrete and not an open field. But in other cases open ground surfaces also adds up some sort of particulates due to wind and other parameters. Total Suspended Particulates (TSP) and PM10 shows an increase in there concentration as we move closer to road however PM2.5 and PM1.0 shows a dip in there concentration at nearest distance to road as compare to previous distances.
Acknowledgements
Authors acknowledge assistance provided by CRRI, Delhi.
References
- Roy M Harrison, Air Pollution: Sources, Concentrations and Measurements, Pollution Causes Effects and control, Fourth Edition (2001).
- Roy M Harrison, The health effects of Air Pollution, Pollution Causes Effects and Control, Fourth Edition (2001).
- Rao and Rao, Air Pollution, Tata Mc-Graw Hill Publishing, 26th reprint (2007).
- Central Pollution Control Board (CPCB) Guidelines for Vehicular Emissions (2006).
- Central Pollution Control Board (CPCB) Parivesh (2006).
- Centre for Science and Environment (CSE), Delhi, Estimates (2008).


