Monitoring of drinking water quality of Gopuri region of Wardha city, Maharashtra
J.R. Bajoria1 * , A.K. Satone1 , R.B. Turale1 , P.V. Tekade1 and N.P. Mohabansi1
http://dx.doi.org/10.12944/CWE.5.1.39
A study of water samples from the historical area, Gopuri of Wardha (M. S.) has been carried out to examine its portability for domestic purposes. The samples from three different places viz., Gitai Nagar (S1), Snehal Nagar (S2) & Laxmi Nagar (S3) were collected. The physicochemical parameters were studied. The parameters were analyzed & compared with standard values prescribed by American Public Health Association (APHA) & World Health Organization.
Copy the following to cite this article:
Bajoria J. R, Satone A.K, Turale R.B, Tekade P.V, Mohabansi N. P. Monitoring of drinking water quality of Gopuri region of Wardha city, Maharashtra. Curr World Environ 2010;5(1):217-219 DOI:http://dx.doi.org/10.12944/CWE.5.1.39
Copy the following to cite this URL:
Bajoria J. R, Satone A.K, Turale R.B, Tekade P.V, Mohabansi N. P. Monitoring of drinking water quality of Gopuri region of Wardha city, Maharashtra. Curr World Environ 2010;5(1):217-219. Available from: http://www.cwejournal.org/?p=1162
Download article (pdf)
Citation Manager
Publish History
Introduction
Wardha is an important city in India due to “Bapu-Kuti” of Mahatma Gandhi. The Gitai Nagar area (Gopuri) is of historical importance being surrounded by Gitai Mandir & Vishwa Shanti Stoop. Water is one of the most precious gifts of nature to mankind. A mark deterioration in water has been noticed in number of locations in the study area. Physicochemical studies on bore well water of Dohod, Gujarat were studied1. Water quality depends on Efficacy of disinfection, Temperature, solar rays.
Experimental
In the present study, water samples have been collected from three different areas located in Gopuri area of Wardha (M. S.). Samples were collected in polythene & glass bottles with necessary precautions2.
All chemicals used are of A. R. grade. Double distilled water is used for the preparation of solutions & reagents.The water quality parameters considered for the examination in the study are colour, temperature, turbidity, pH, density, surface tension, viscosity, electrical conductance, total dissolved solid, hardness, alkalinity, dissolved oxygen, chloride, and copper. All the parameters were evaluated by the standard methods prescribed by APHA3. Calcium & Magnesium hardness of water was estimated by Complexometric titration method4.Chioride contents were determined volumetrically by AgNO3 titrimetric method using potassium chromate as an indicator & was calculated in terms of mg/L.
Results and Discussion
The physicochemical data of bore well water samples (mean values) were collected in December 2008 are presented in table 1.
Results of the samples vary with different collecting places because of different nature of soil contamination4.
Temperature
All physiological activities & life processes of aquatic organisms are generally influenced by water temperature. In the present study, temperature range from 24-25oC.
pH
pH value of drinking water is an important index of acidity, alkalinity & resulting value of the acidic-basic interaction of a number of its minerals Ip. organic components. pH below 6.5 causes corrosion in pipes, resulting in release of toxic metals. pH of water in the studied region was in the range of 6.88 to 7.47, which lies in the range prescribed by APHA3.
Density, Surface Tension & Viscosity
Density ranges from 0.9706-1.1192 gm/ cm3. While surface tension was highest at S2 & lowest at S1. Viscosities of the three studied regions were in the comparable range.
Electrical Conductivity
Conductivity measurements give a rapid & practical instrument of variation of dissolved minerals content of a water sample. In our study electrical conductivity ranged from 0.89 to 1.00 mM.
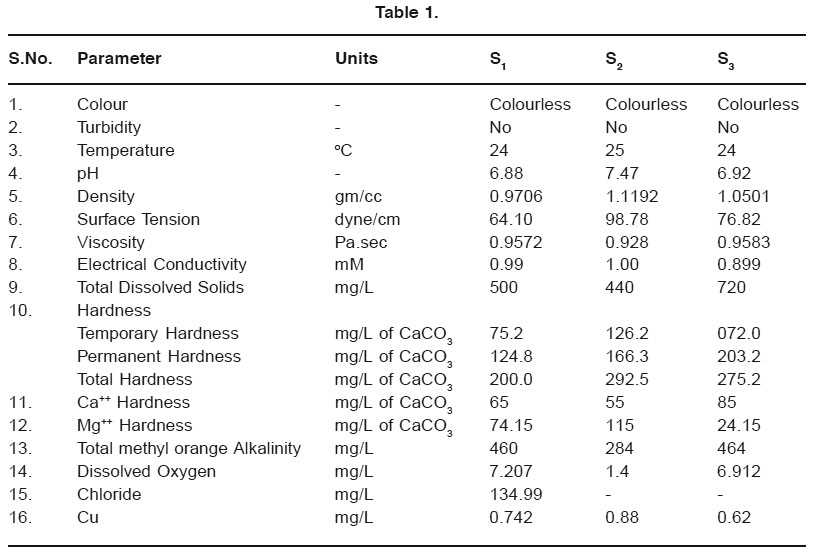 |
Table 1 Click here to view table |
TDS
According to WHO & Indian Standards, TDS values should be less than 500 mg/lit for drinking water. In the present study, TDS ranged from 440 to 720 mg/liL. The findings indicate that the sample of Laxmi Nagar (S3) just crosses the permissible limit. The water from the well is used by local people for drinking purpose. The reason for high TDS is not clear. While TDS of S1 & S2 lies in the range suggested by WHO & Indian Standards5.
Hardness
The hardness of water is not pollution parameter but indicates the water quality mainly in terms of Ca++ & Mg++ expressed as CaCO3. It is the property of which prevent the lather formation with soap. The acceptable limit of total hardness is 200 mg/L which can be extended to 600 mg/lit (ISI 1982). The hardness values are well within permissible limit.
Ca++ & Mg++ hardness
The limit of Ca++ & Mg++ have been prescribed in the range 75-200 mg/L & 50-100 mg/L respectively6. Ca++ & Mg++ contents in all samples collected fall within the limits prescribed except at Snehal Nagar (S2). Calcium is needed for the body in small quantity through water provides only a part of total requirement6.
Alkalinity
In the present study, total alkalinity ranges from 284-264 mg/L. The acceptable limit of total alkalinity of water sample is 500 mg/L & maximum desirable limit is 1500 mg/L (ISI).
DO
The DO, ranged between 1.4 to 7.207 mg/L. The lower DO content at Snehal Nagar may be due to intrusion of high organic load in the water which leads to oxygen depletion.
Chloride
The chloride content in the sample from Gitai Nagar is 134.99 mg/L. Natural water contains low chloride ions. Finding indicates that chloride ion concentration from Gitai Nagar is below the permissible limit of chloride in drinking water prescribed by Indian Standard Index5. Due to technical problem, we cannot measure the chloride concentration from other destinations.
Copper
Copper present in water sample causes great problem with materials as well as aquatic organisms. Copper present in water is estimated in the form of cuprous ion. The permissible limit of Cu in potable water according to WHO specification is 1.5 ppm. Copper content in all the studied areas was found to be very less.
Conclusion
In order to combat water pollution in Gopuri area, we must understand the problems & undertake remedial measures. So, it is advisable that water should be treated to remove exes of hardness by boiling & ion exchange.
Acknowledgements
The authors are very much grateful to Principal Dr. Om Mahodaya & Prof. V. B. Patil, H.O.D., P.G. Department of Chemistry, J. B. College of Science, Wardha for providing the facilities to carry out the present investigation.
References
- Rana, A.K. et, al., Asian J. Chem., (2002) 14(3-4): 1178-1184.
- E. Brown, M. W. Skovgsted & M. J. Fishman, Methods for collection & analysis of water samples for dissolved minerals & gases,(1974) 5
- APHA, standard methods for examination of water & wastewater 16th edition, New York (1985).
- A. I. Vogel, “T ext Book of qualitative inorganic analysis”, 4th Edn., ELBS, Landon (1978)
- The Gadget of India: Extraordinary part-11,(1991) 36: 11.
- A. G. Dhembare, G. M. Khande & C. R. Singh, Pollution research,(1998) 17: 87


