Application of water quality index for assessment of pond water quality status in Orissa, India
Rizwan Reza1 * and Gurdeep Singh1
1
Deparment of Environmental Science and Engineering,
Indian School of Mines, Dhanbad,
Jharkhand
India
http://dx.doi.org/10.12944/CWE.5.2.13
Water quality index (WQI) has been calculated for different Ponds water in industrialized area at Angul-Talcher region of Orissa (India). Water Quality Index used to assess the spatial and temporal variation and also helps in classification of pond water suitability. The pond water samples were collected (n=14) from different locations of the study area. The highest value of WQI of the samples was 80 in monsoon season while the lowest value was 43 in summer season. The higher value of WQI has been found to be mainly from the increased concentration of BOD and Coliforms in the pond water. Most of the water samples within study area were found within medium category of National Sanitation Foundation Water Quality Index (NSF-WQI).
Copy the following to cite this article:
Reza R, Singh G. Application of water quality index for assessment of pond water quality status in Orissa, India. Curr World Environ 2010;5(2):305-310 DOI:http://dx.doi.org/10.12944/CWE.5.2.13
Copy the following to cite this URL:
Reza R, Singh G. Application of water quality index for assessment of pond water quality status in Orissa, India. Curr World Environ 2010;5(2):305-310. Available from: http://www.cwejournal.org?p=289/
Download article (pdf)
Citation Manager
Publish History
Introduction
Water Quality Monitoring data consists of routine measurements of physical, chemical and biological variables that are intended to give insight into aquatic environment. However, it does not give the overall picture on the water quality status. Further need to translate it into a form that is easily understood and effectively interpreted. In general, water quality indices incorporate data from multiple water quality parameters into a mathematical equation that rates the health of a stream with a single number. That number is placed on a relative scale that rates the water quality in categories ranging from very bad to excellent (Stambuk-Giljanovic, 1999; Bordalo et al., 2001). WQI also permits the assessment of changes in water quality and its trends. On the basis of the results of WQI, pond water can be classified for the suitability of various uses (Cude, 2001; Chapman, 1992). Some of the water quality index approaches that have been frequently employed in public domain for the purpose of water quality assessment (Said et al., 2004). US National Sanitation Foundation Water Quality Index, NSFWQI (Brown et al. 1970), Canadian Water Quality index (CCME, 2001), British Columbia Water Quality Index, BCWQI (Zandbergen and Hall, 1998), Oregon Water Quality Index, OWQI (Cude, 2001) and the Florida Stream Water Quality Index, FWQI (SAFE, 1995) are very frequent used water quality indices in various part of the world.The water quality index (WQI) has been considered as the criteria for water classification, based on the use of standard parameters for water characterization. The index is a numeric expression used to transform large quantities of water characterization data into a single number, which represents the existing water quality level (Sanchez et al., 2006; Bordalo et al., 2006). A commonly used WQI was developed by the National Sanitation Foundation (NSF) in 1970 (Brown et al., 1970).
The NSF WQI was developed to provide a standardized method for comparing the water quality, based upon various water quality parameters. The WQI can be calculated with less than nine parameters (Brown et al., 1970). In present study the data matrix was obtained from various season (summer, monsoon, post-monsoon and winter), to investigate the spatial and temporal variation in water quality and classify the pond water status. According to the Indian standard (CPCB), PH, DO, BOD and Coliform are the major parameters to describe the suitability of water for various purposes.
Material and Methods
The Angul-Talcher area lies between latitudes 20° 37’ N to 21° 10’ N and longitudes 84º 53’ E to 85° 28’ E (Fig. 1) and situated at an average height of 139 meters above mean sea level (MSL). The area is characterized by tropical climate and has many important natural resources, which include coal, forests, fertile land, minor minerals, ground and surface water, etc. At present Nalco Smelter and its Captive Power Plant (CPP-960 MW), Super Talcher Thermal Power plant (STTPS-3000MW), Talcher Thermal Power Plant (TTPS-460MW), Iron & Steel industries and several Coal Mines are the major industries operating there. Beside that the agriculture is also covered a major portion of land in Angul. The overall area is intensively farmed and industrialized. These industries can increase the pollution load on the various components of environment in surrounding areas including pond water in surrounding areas. Geographical location of the study area is shown in Figure 1.
The water samples were collected from twelve (12) different locations in all four seasons viz. summer, monsoon, post-monsoon and winter season. Sampling locations were selected on the basis of different land use pattern (agricultural, residential and barren etc.). Care was taken to collect subsequent samples from same location in all season. The Samples were taken from 10 to 15cm below the water surface using acid washed plastic container to avoid unpredictable changes in characteristic as per standard procedures (APHA, 1998). Details of sampling locations along with their latitude and longitude are illustrated in Table 1.
Water Quality Index
Water Quality Monitoring data consists of routine measurements of physical, chemical and biological variables that are intended to give insight into aquatic environment. However, it does not give the over picture on the water quality. There a further need to translate it into a form that is easily understood and effectively interpreted. Water Quality Index (WQI) plays an important role in such translation process.
For calculation of water quality index (WQI), the raw analytical results for the selected water quality variables, having different units of measurements, are transformed into unit-less sub-index values (Cude, 2001). This can be done by transforming each parameter into 0 to 100 scales (Pesce and Wunderlin, 2000) by using sub-index curves. The sub-index curves may be linear, non-linear. These sub-indices are then averaged to give a water quality index value (Cude, 2001) applying suitable weighting factors that reflect the importance of each parameter as an indicator of the water quality (Pesce and Wunderlin, 2000).
National Sanitation Foundation Water Quality Index (1974) has been widely field tested and applied to data from a number of different geographical areas. It has following mathematical structure.
where, Ii is the sub index for ith water quality parameter,
Wi is the weight (in terms of importance) associated with ith water quality parameter,
n is the number of water quality parameters.
The following equations were used to calculate the WQI Sub-Indices:
- % Saturation DO (0-40%) = 0.18 + (0.66 * % Saturation DO)
- % Saturation DO (40-100 %) = (-13.5) + (1.17 * % Saturation DO)
- % Saturation DO (100-140%) = 163.34 - (0.62 * % Saturation DO)
- BOD (0 to 10 ppm) = 96.67 - (7 * BOD)
- BOD (10 to 30 ppm) = 38.90 - (1.23 * BOD)
- BOD (>30ppm) = 2.0
- pH (5.0 to 7.3) = (-142.67) + (33.50 * pH)
- pH (7.3 to 10.0) = 316.96 - (29.85 * pH)
- Coliforms (1 to 1000) = 97.20 - (26.80 * log [MPN])
- Coliforms (1000 to 10000) = 42.33 - (7.75 * log [MPN])
In deciding the weights of parameters incorporated in the index system it was believed that the importance of each parameter depends upon the degree of which the parameter can manifest changes in water quality. It was also assumed that a policy of natural land use in the basin was a possible choice for agro-industrial development in the province. The weights of the parameters are given in Table 1. The four parameters which are considered important (especially for the Indian conditions as described by CPCB) for NSF-WQI have following weights as
- % Saturation Dissolved Oxygen = 0.31
- Fecal Coliform = 0.28
- pH = 0.22
- BOD = 0.19
In general, water quality index is mathematical equation that rates the health of a stream with a single number. That number is placed on a relative scale that rates the water quality in categories ranging from very bad to excellent. Based on the estimated value of WQI, the water is categorized as per Table 2.
Results and Discussion
National Sanitation Foundation Water Quality Index (NSF-WQI) was used to assess the water quality status of various ponds. The tool converts the water quality data into usable information which express the level of water quality.
The values of water quality index were higher during monsoon season followed by winter, post-monsoon and then summer season. The values of WQI showed significant changes between different sampling locations and the analogous trend of seasonal variation. The higher values in monsoon season due to dilution impact of concentration of related parameters (Phiri et al., 2005). While the lower value in summer season was due to elevation of water temperature which leads to increase the evaporation rate and the accumulation of concern dissolved pollutants in water (Pandey et al., 1999). The figures (Fig. 2) clearly indicate the variation of water quality index (WQI) with respect to various seasons.
Table 1: Details of pond water sampling location along with their longitude and latitude
|
Sample Code |
Locations |
Longitude |
Latitude |
|
W-11 |
Manapur pond water near Beragadia village |
85016’30" |
20051’11" |
|
W-12 |
Hakimpara pond water near Jagannath temple |
85006’06" |
20049’31" |
|
W-13 |
Kumanda village, pond water |
85005’02" |
20051’15" |
|
W-14 |
Vikash nagar, Angul, pond water |
85007’04" |
20050’42" |
|
W-15 |
Raniguda village, pond water |
85007’00" |
20051’28" |
|
W-16 |
Kandasaar village pond water |
85008’36" |
20050’15" |
|
W-17 |
Derjang reservoirs |
85001’57" |
20051’02" |
|
W-18 |
Pond water near Manapur village |
85014’10" |
20051’29" |
|
W-19 |
Pond water near Jagannathpur village |
85011’30" |
20055’48" |
|
W-20 |
Pond water near Turang village |
85007’30" |
20050’50" |
|
W-21 |
Nuashahi pond water |
85011’14" |
20047’50" |
|
W-22 |
Tulashi pal pond water |
85011’12" |
20048’14" |
|
W-23 |
Longibeda pond water |
85010’51" |
20048’37" |
|
W-24 |
Gadara khai pond water |
85010’11" |
20049’04" |
 |
Figure 1: Study area along with the sampling locations Click here to view figure |
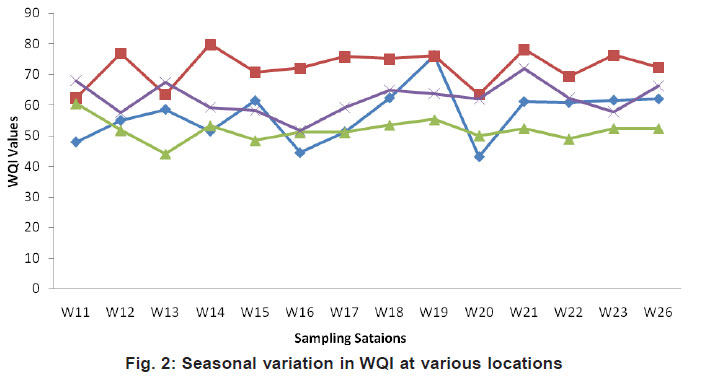 |
Figure 2: Seasonal variation in WQI at various locations Click here to view fiugre |
Table 2: Descriptor Categories of NSF-WQI values
|
NSF-WQI |
Descriptor Category |
|
0 to 25 |
Very Bad |
|
26 to 50 |
Bad |
|
51 to 70 |
Medium |
|
71 to 90 |
Good |
|
91 to 100 |
Excellent |
The WQI of water samples were found in the range of 43 to 76 in summer, 62 to 80 in monsoon, 44- to 61 in post-monsoon and 52 to 72 in winter season. On the basis of descriptive categories of NSF-WQI values, 21% of samples were found in Good category while the 66% of the samples were in medium category. Only 13% of samples were found in bad category. The lower value of WQI of various samples (W-11, W-16, W- is attributed to the high evaporation rate and the accumulation of concern dissolved pollutants in water during summer season (Pandey et al., 1999). While in the case of post-monsoon season, few samples were found within bad category. It may be due to settled or un-dissolved waste material carried out by run-off from rural area, having no roper sanitation. The main sources of pollution were defined as high BOD and Coliforms, which were considerably increased due to the domestic waste, improper sanitation and back water from agriculture fields (Rim-Rukeh et al., 2006; Izonfuo and Bariweni, 2001).
Table 3: Season wise statistical variation in WQI values
|
Seasons |
Minimum |
Maximum |
Mean |
Std. Deviation |
|
Summer |
43 |
76 |
57 |
9 |
|
Monsoon |
62 |
80 |
72 |
6 |
|
Post-monsoon |
44 |
61 |
52 |
4 |
|
Winter |
52 |
72 |
62 |
5 |
Conclusions
The WQI for all samples were found in the range of 43 to 80. Almost 87% of the total water samples were found in range of good and medium category of National Sanitation Foundation Water Quality Index (NSF-WQI). Out of 56 water samples only seven (13%) were found within bad category, it is due to domestic activities such as bathing of men and cattles, washing utensil etc. were frequently carried out along with the various pond. BOD and fecal coliforms are the main water quality sub-indices that reflect the impact of anthropogenic activities on the water quality of this river system.
Acknowledgements
The authors are thankful to State Pollution Control Board Orissa, for sponsoring this study. Authors are also grateful to Prof. T. Kumar, Director, ISM for granting of ISM fellowship. One of the authors (Rizwan Reza) is grateful to Indian School of Mines/MHRD/Govt. of India, for providing research facilities.
References
- Stambuk-Giljanovic, N., Water Research, (1999) 3423-3440.
- Bordalo A. A., Nilsumranchit W.Chalermwat K., Water Research, (2001) 3635–3642.
- Cude C. G., Journal of American Water Resources Association, (2001) 37: 125-137.
- Chapman D., Water quality assessment London: Chapman & Hall (on behalf of UNESCO, WHO and UNEP), (1992) 585.
- Said A., Stevens D. K. and Sehlke, G., Environmental Monitoring and Assessment, (2004) 34: 406-414.
- Canadian Council of Ministers of the Environment (CCME), Water Quality Index user’s manual (2001). (http://www.ccme.ca/ assets/pdf/wqi_usermanualfctsht_e.pdf)
- Zandbergen P. A. and Hall, K. J., Water Quality Research Journal of Canada, (1998) 33: 519-549.
- Strategic assessment of Florida’s environment (SAFE), Online available: http://www.pepps.fsu.edu/safe/environ/swq1.html (1995).
- Sanchez E., Colmenarejo M. F., Vicente J., Rubio A., Garcýa M. G.and Travieso L., Ecological Indicators, (2006) 7: 315-328.
- Brown R. M., McClelland N. I., Deininger, R. A. and Tozer, R. G., Water and Sewage Works, (1970) 117: 339-343.
- Central pollution control board (Govt. of India). Online available on: http:// www.cpcb.nic.in/
- American Public Health Association (APHA, (20 edition) Washington D.C. (1998)
- Pesce S. F. and Wunderlin D. A., Water Research, (2000) 34: 2915-2926.
- Phiri O., Mumba P., Moyo B. H. Z and Kadewa, W., Int J Environ Sci Tech, (2005) 2: 237-244.
- Panday S.K., Singh A.B. and Hasnain S.I., Aquatic Geochemistry, (1999) 5: 357-379.
- Rim-Rukeh A., Ikhifa, O. G. and Okokoyo A. P., Journal of Applied Sciences Research, (2006) 2: 256-259.
- Izonfuo L.W.A. and Bariweni A. P., J. Appl. Sci. Environ. Mgt, (2001) 5: 47-55.


