Assessment of drinking water quality of jaipur main and its suburb railway stations with special mention to fluoride
Anirudh Sahni1 * , Kavita Sahni2 and Abhishek Gautam1
1
Department of Environmental Science,
Birla Institute of Technology,
Jaipur,
India
2
Department of Zoology,
Vedic Kanya PG College,
Jaipur,
India
http://dx.doi.org/10.12944/CWE.5.2.11
Fluorosis is the prevalent problem of the Rajasthan state as the drinking water source at many places are ground water which are having high concentration of fluoride ion. Fluoride contamination of ground water may be correlated with the regional geological aspects. For the present study the water samples were collected and analysed for physico-chemical parameters namely pH, EC, TDS, Calcium and Magnesium Hardness, Total Alkalinity, Chlorides, Sulphates, Nitrates etc. with special reference to fluoride deliberation for drinking water of Jaipur main station (Two samples); Jagatpura; Durgapura; Sanganer; Gandhinagar; Baisgodam and Kanakpura railway stations. The source of drinking water at every station is groundwater. The analysed values were compared with the standard values of Bureau of Indian Standards (BIS) and World Health Organisation (WHO). The analysis shows that the fluoride concentration is much higher in the drinking water samples of Sanganer; Jagatpura; Jaipur main; Baisgodam and Kanakpura railway station where as it is within permissible limits for the drinking water of Durgapura and Gandhinagar railway station. According to BIS and WHO the fluoride concentration more than 1.5 mg/l is toxic and may cause Fluorosis. Too much of fluoride concentration leads to destruction of enamel and causes fluorosis leading to decalcification, dental disorder, mineralization of tendons, digestive and nervous system. Out of eight water samples six are of higher range and two comes in the permissible limits. Hence the study suggests the defluoridation of drinking water in the study area.
Copy the following to cite this article:
Sahni A, Sahni K, Gautam A. Assessment of drinking water quality of jaipur main and its suburb railway stations with special mention to fluoride. Curr World Environ 2010;5(2):293-298 DOI:http://dx.doi.org/10.12944/CWE.5.2.11
Copy the following to cite this URL:
Sahni A, Sahni K, Gautam A. Assessment of drinking water quality of jaipur main and its suburb railway stations with special mention to fluoride. Curr World Environ 2010;5(2):293-298. Available from: http://www.cwejournal.org/?p=1199
Download article (pdf)
Citation Manager
Publish History
Introduction
Clean and safe drinking water is most primary need of living organisms. Ground water contributes 0.6 percent of the total water resources on the earth and is the major source of drinking and agriculture water in rural and urban areas. Chemical composition of the water is the major criteria for its suitability in drinking purposes especially in India where water purifying techniques are minimal. In India ground water caters to 80% of the total drinking water requirement and 50% of the agricultural needs. Fluoride (F–) occurs in almost all waters from trace to high concentrations (Graciri and Davies 1993). Presence of fluoride in groundwater poses a great problem in most of the states of India (Susheela 2001, Murlidharan et.al. 2002). An estimated 62 million people, including 6 million children suffer from fluorosis because of consuming fluoride-contaminated water in our country (Raju et.al. 2009). Fluoride less than1.5 mg/ l is important for bones and tooth formation is mainly obtained from drinking water. Ground water is the main source of water for drinking purposes in Rajasthan. In the state 71% of the irrigation and 90% of the drinking water source is ground water (Rathore, 2005)
Drinking water at railway stations is mainly supplied from borewells. Most of the railway stations in India rarely have the much needed purifying technology. Fluoride content in the water of railway station may be harmful to the public as well as railway employees. The Jaipur as the capital of Rajasthan and its thickly populated city has one main station and six suburb railway stations. The water supply to these stations for drinking purpose is mainly ground water. In the present study drinking water samples from all the stations were collected and analysed for the physico – chemical and bacteriological parameters for the monsoon period 2009.
Material and Methods
Eight water samples were collected from Jaipur main and suburb railway station namely Gandhinagar, Durgapura, Sanganer, Baisgodam, Kanakpura and Jagatpura. Two water samples each from platform 3 and 6 of the Jaipur main railway station were collected. Autoclaved plastic bottles were used for sample collection. Random sampling was done for bacteriological analysis from few stations. A total of 17 physico – chemical parameters were analysed including pH, EC, TDS, chloride, nitrate, fluoride, total hardness, calcium and magnesium hardness, sulphates, phosphate, turbidity, sodium, potassium, alkalinity, and COD. Temperature was taken at the time of sampling of water samples with help of thermometer. Fluoride contents were determined by SPADNS method (APHA 2005). The other physico – chemical parameters were determined titrimetrically and spectrophotometrically.
Results and Discussion
Observations reveal that (Table – 1) pH values were in the range of 7.21 to 7.45. TDS varied with minimum value 298 mg/l (durgapura) to maximum of 870.4 mg/l (sanganer) indicating samples have tolerable concentrations of soluble salts as per WHO, ICMR and BIS norms. EC was in the range of 0.479 to 1.36 milli siemens. No prescribed standard are suggested by WHO, ICMR and BIS for electrical conductance of drinking water. Total hardness ranged from 92 to 400 mg/l, calcium and magnesium hardness ranged from 42 to 200 mg/l. Sulphates were in the range from 48 to 106 mg/l. Phosphates are not traceable in all the samples. Nitrates ranged from 0.3 to 1.2 mg/l. Potassium and sodium ions ranged from 3 to 68 mg/l. Total alkalinity ranged from 60 to 110 mg/l. COD ranged from 1.2 to 2.5 mg/l. All the values of above parameters are in the permissible range of WHO, ICMR and BIS. The fluoride values are in the range from 0.8 to 3.2 mg/l. Only two values are within the permissible limits while other six samples have higher fluoride content than the prescribed limits of WHO, ICMR and BIS (Table – 2).
In the random sampling for coliforms, two samples showed positive results. The values of MPN coliform per 100 ml was from 23 to 43. Presence of coliforms in the drinking water is harmful for human health and such water is unfit for drinking. To check the coliform content residual chlorine should be added in the drinking water (Shah et.al. 2006)
The result interpretation shows that most of the samples were fit for drinking except a few where the values were on higher side of desirable limits. The pH and EC for Sanganer water sample are quite high showing the presence of dissolved salts in greater quantity. Similarly sodium content is higher in sanganer and kanakpura samples. Chloride content is maximum in sanganer water sample, nearly equal to kanakpura sample. Least value was obtained at Durgapura station. The higher fluoride values are found for six samples from Jagatpura, Sanganer, Jaipur main, Kanakpura and Baisgodam (Graph – 1).
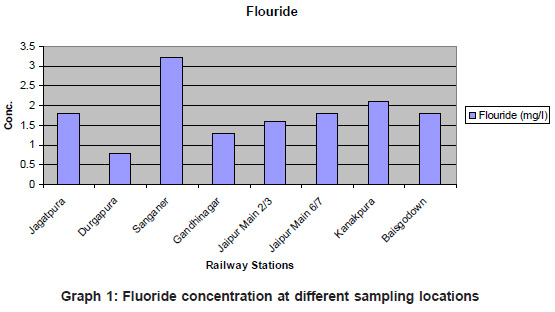 |
Graph 1: Fluoride concentration at different sampling locations Click here to view graph |
The Karl Pearson coefficient ‘r’ was calculated using the correlation equation among the various physico-chemical parameters (Table – 3). Statistical analysis suggest that EC bears a positive correlation with dissolved solids and sulphates (r = 0.99 and r= 0.88 respectively). It shows that resulting electrical conductivity depends on the dissolved salts. Chlorides bears a positive correlation with calcium and magnesium (r= 0.98 and r= 0.86 respectively). It indicates that calcium chloride is more than magnesium chlorides in the water samples. Total hardness also bears positive correlation with calcium hardness, magnesium hardness, chlorides and TDS (r= 0.98, r= 0.982, r= 0.94, r= 0.79, respectively). It reveals that total hardness may depend on water soluble calcium and magnesium chlorides. The fluoride has positive correlation with TDS, chlorides, calcium and magnesium hardness and sulphates (r= 0.83, r= 0.84, r= 0.93, r= 0.94, r= 0.90 respectively). It suggests that fluoride content is dependent on high content of dissolved salts in form of chlorides and sulphates. Overall purification of water will reduce the dissolved salts in the water and thus reducing the fluoride content. In this way the water will be fit for human consumption.
Table 1: Physico-chemical and Bacteriological analysis of drinking water samples of various railway stations of Jaipur
|
S. No |
Parameters |
Jagatpura |
Durgapura |
Sanganer |
Gandhi Nagar |
Jaipur Main |
Jaipur Main |
Kanakpura |
Bais Godown |
|
2/3 |
3/7 |
||||||||
|
1 |
Temperature |
27 |
27 |
26 |
27 |
26 |
26 |
25 |
26 |
|
2 |
pH |
7.21 |
7.5 |
7.3 |
7.25 |
7.39 |
7.45 |
7.26 |
7.32 |
|
3 |
Electrical conductivity (ms) |
0.647 |
0.46 |
1.36 |
0.76 |
0.48 |
0.44 |
0.88 |
0.56 |
|
4 |
Total dissolved solids mg/l |
414 |
298 |
870.4 |
486.4 |
300 |
311.1 |
560 |
359.6 |
|
5 |
Chlorides (mg/l) |
88.6 |
35.5 |
266 |
106.4 |
124.8 |
141.8 |
265 |
108.5 |
|
6 |
Total hardness (mg/l) |
160 |
92 |
400 |
120 |
210 |
220 |
300 |
180 |
|
7 |
Calcium Hardness as Ca ( mg/l) |
90 |
50 |
200 |
80 |
110 |
120 |
180 |
100 |
|
8 |
Magnesium Hardness as Mg ( mg/l) |
70 |
42 |
200 |
40 |
100 |
100 |
120 |
80 |
|
9 |
Sulphates (mg/l) |
52 |
48 |
106 |
51 |
58 |
60 |
84 |
55 |
|
10 |
Phosphates (mg/l) |
NT |
NT |
NT |
NT |
NT |
NT |
NT |
NT |
|
11 |
Nitrates (mg/l) |
0.3 |
0.4 |
1.2 |
0.3 |
0.6 |
0.6 |
0.8 |
0.6 |
|
12 |
Turbidity |
1 |
1 |
2 |
1 |
1 |
1 |
2 |
1 |
|
13 |
Sodium as Na (mg/l) |
56 |
42 |
73 |
64 |
46 |
48 |
68 |
49 |
|
14 |
Pottassium as K (mg/l) |
5 |
3 |
8 |
6 |
4 |
4 |
7 |
3 |
|
15 |
Total alkalinity (mg/l) |
66 |
60 |
110 |
70 |
77 |
80 |
88 |
70 |
|
16 |
COD (mg/l) |
2.1 |
1.6 |
2.5 |
1.2 |
1.4 |
1.4 |
2.2 |
1.3 |
|
17 |
Flouride (mg/l) |
1.8 |
0.8 |
3.2 |
1.3 |
1.6 |
1.8 |
2.1 |
1.8 |
|
18 |
Coliform (No/100ml) |
- |
43 |
- |
Nil |
23 |
- |
- |
- |
Table 2: Standard Limits by WHO, ICMR and BIS of drinking water
|
Characteristics |
Unit |
WHO |
ICMR |
|
BIS |
||
|
|
|
HDL |
MPL |
HDL |
MPL |
HDL |
MPL |
|
pH |
- |
|
|
|
|
|
|
|
E.C. |
m mho/cm |
- |
- |
- |
- |
- |
- |
|
TDS |
mg/l |
500 |
1000 |
500 |
1500 |
500 |
2000 |
|
Total Alkalinity |
mg/l |
120 |
250 |
120 |
250 |
200 |
600 |
|
Calcium hardness |
mg/l |
75 |
200 |
75 |
200 |
75 |
200 |
|
Magnesium hardness |
mg/l |
30 |
50 |
50 |
200 |
- |
- |
|
Total hardness |
mg/l |
100 |
500 |
200 |
600 |
200 |
600 |
|
Chlorides |
mg/l |
200 |
600 |
200 |
1000 |
250 |
1000 |
|
DO |
mg/l |
- |
- |
- |
- |
- |
- |
|
COD |
mg/l |
- |
- |
- |
- |
- |
- |
|
Coliform |
Coliform/100ml |
Nil |
10 |
Nil |
10 |
Nil |
10 |
WHO: World health Organisation
ICMR: Indian Council of Medical Research
BIS: Bureau of Indian Standards
HDL: Highest desirable limits
MPL: Maximum permissible limits
Fluoride content in water above desirable limits is harmful for human beings. Consumption of such water having fluoride more than 1.5 mg/l may cause degeneration of bones and dental mottling especially in pregnant woman and children (Raju et.al. 2009). It is suggested that defluoridation of the drinking water should be done at these stations.
Table 3: Correlation-coefficient (r) among the various water quality parameters Note: all the results are in mg/l except pH, EC, temperature and turbidity
|
Parameters |
Temp |
pH |
EC |
TDS |
Cl |
TH |
Ca |
Mg |
SO4 |
NO3 |
Turbidity |
Na |
K |
TA F |
|
Temp |
1 |
|||||||||||||
|
pH |
0.059 |
1 |
||||||||||||
|
EC |
-0.268 |
-0.518 |
1 |
|||||||||||
|
TDS |
-0.272 |
-0.499 |
0.999 |
1 |
||||||||||
|
Cl |
-0.782 |
-0.371 |
0.78 |
0.787 |
1 |
|||||||||
|
TH |
-0.705 |
-0.243 |
0.782 |
0.792 |
0.941 |
1 |
||||||||
|
Ca |
-0.772 |
-0.331 |
0.776 |
0.784 |
0.986 |
0.982 |
1 |
|||||||
|
Mg |
-0.615 |
-0.148 |
0.76 |
0.771 |
0.862 |
0.982 |
0.928 |
1 |
||||||
|
SO4 |
-0.614 |
-0.252 |
0.883 |
0.89 |
0.934 |
0.967 |
0.954 |
0.945 |
1 |
|||||
|
NO3 |
-0.679 |
-0.028 |
0.743 |
0.752 |
0.858 |
0.95 |
0.905 |
0.961 |
0.947 |
1 |
||||
|
Turbidity |
-0.655 |
-0.332 |
0.843 |
0.842 |
0.926 |
0.864 |
0.903 |
0.795 |
0.938 |
0.83 |
1 |
|||
|
Na |
-0.311 |
-0.718 |
0.914 |
0.913 |
0.794 |
0.676 |
0.741 |
0.588 |
0.763 |
0.549 |
0.8 |
1 |
||
|
K |
-0.327 |
-0.61 |
0.909 |
0.909 |
0.825 |
0.731 |
0.781 |
0.657 |
0.812 |
0.596 |
0.833 |
0.97 |
1 |
|
|
TA |
-0.608 |
-0.21 |
0.832 |
0.844 |
0.921 |
0.975 |
0.95 |
0.964 |
0.968 |
0.942 |
0.841 |
0.721 |
0.782 |
1 |
|
F |
-0.526 |
-0.438 |
0.83 |
0.833 |
0.842 |
0.941 |
0.903 |
0.945 |
0.901 |
0.869 |
0.76 |
0.709 |
0.726 |
0.915 |
Acknowledgements
The authors are thankful to Dr. Abhinav Dinesh, Director, Birla institute of Technology (Mesra, Ranchi) Jaipur campus, for providing guidance and necessary help.
References
- APHA, Standard methods for the examination of water and wastewater, American Public Health Association, Washington, DC, 2005.
- Gaciri S. J., Davies T. C., The occurrence and geochemistry of fluoride in some natural waters of Kenya. J. Hydrol. 1993;143:395-412.
- Guidelines for Drinking Water Quality, World Health Organisation, Geneva 2009.
- Muralidharan D., Nair A. P., Sathyanarayana U., Current Science. 2002;83:699-702.
- Raju N., Janardhana., Dey Sangita., Das Kaushik., Fluoride contamination in groundwaters of Sonbhadra District, Uttar Pradesh, India, Current Science. 2009;96(7): 979-985.
- Rathore M. S., Groundwater exploration and augmentation, A Review. 2005.
- Susheela A. K., A Treatise on Fluorosis, Fluorosis Research and Rural Development Foundation, Delhi. 2001;15.
- Shah M. C., Shilpkar P. G., Shah A. J., Pujara P. T., Jarolia P. V. Assessment of Drinking Water Quality of Various Railway Stations on Ahmedabad to Khedbrahma Train Route in Gujarat, India, Poll. Res. 2006;25(3):549-552.
- Water Quality Standards for Drinking Water, BIS, 10500-1991.


