Declination in the fertility of lands due to the flood in Bagalkot district
Basavaraj M. Kalshetty1 * , R.C. Sheth1 , M.C. Sangannavar1 and M.B. Kalashetti2
1
Department of Chemistry,
B.L.D.E.A Comm. B.H.S. Arts and T.G.P. Science College,
Jamkhandi,
587 302
India
2
Department of studies in Chemistry,
Karnataka University,
Dharwad,
580 003
India
http://dx.doi.org/10.12944/CWE.5.2.18
Soil plays a very vital role as it produces food for human beings and animals. The organic matter in soil as decomposed by a host of micro organism. Due to human activities, soil is the receptor of many pollutants including pesticides, fertilizers, etc., Hence, soil is an important component of environmental chemical cycle.
Copy the following to cite this article:
Kalshetty B. M, Sheth R. C, Sangannavar M. C, Kalashetti M. B. Declination in the fertility of lands due to the flood in Bagalkot district. Curr World Environ 2010;5(2):333-337 DOI:http://dx.doi.org/10.12944/CWE.5.2.18
Copy the following to cite this URL:
Kalshetty B. M, Sheth R. C, Sangannavar M. C, Kalashetti M. B. Declination in the fertility of lands due to the flood in Bagalkot district. Curr World Environ 2010;5(2):333-337. Available from: http://www.cwejournal.org/?p=1213
Download article (pdf)
Citation Manager
Publish History
Introduction
Soil testing is a proven, practical method for evaluating the fertility status of soils and providing a sound basis for making recommendations in respect of fertilizers applications, soil amendment to farmers for increased crop production. Soil testing is of recent introduction but its importance in our agricultural program can hardly be over emphasized. Use of fertilizers in the country is now decidedly on the increase but their application must be guided on a scientific basis in a rational manner to achieve good yield. Soil testing is made significant progress and made fertilizers recommendations to farmers on the results, showing deficient and sufficient area of the desired yield levels. However, the amounts and kinds of fertilizers required for the same crop vary from soil to soil even from field to field on the same soil. The farmers should apply the proper doses of fertilizers at the right time with the recommendation based upon the soil testing. The risk of unbalanced nutrient elements and uneconomical use of fertilizers reduce the crop yields, the general impression about soil testing is that it is a rapid and too accurate method of assessing what plant food elements are deficient in a soil., and that if one applies thee deficient elements good yields are assured. The research work so far conducted on the crop in the particular soil areas, and the management practices of the concerned farmer, such as proper tillage, efficient water management, good seed, and adequate plant protection measures. Soil testing is essential, as the first step in obtaining high yields and maximum returns from the money invested in fertilizers.
Experimental
All the Chemicals used were of analytical grade, metal salts were purchased from E.Merck. Soil sampling and preparation of soil sample for analysis was done by reported method.1 only few grams of soil are analyzed for studying various properties and nutrient content of soil. The frequency of sampling should be once after the crops when the soil moisture is optimum.
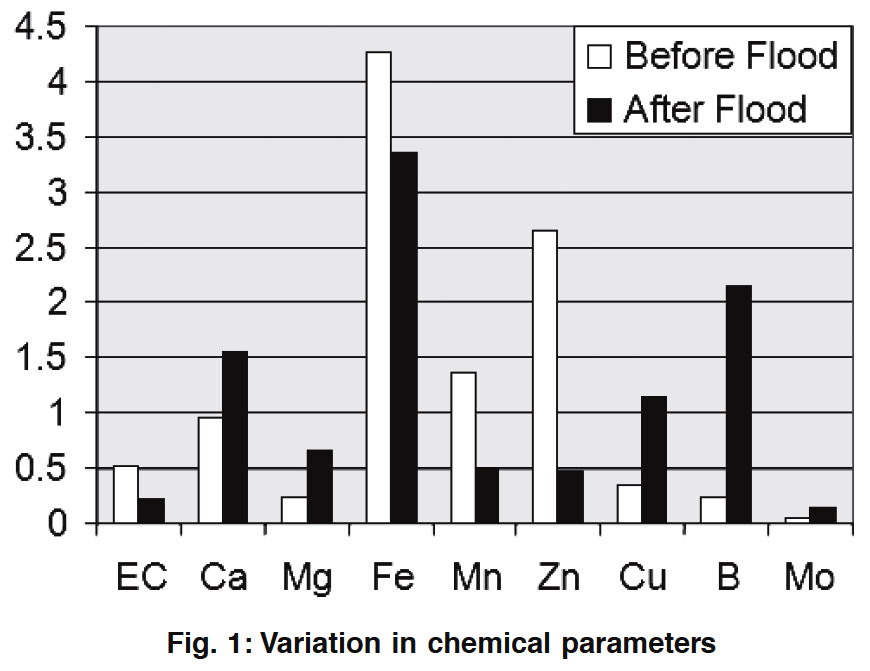 |
Fig. 1: Variation in chemical parameters Click here to view |
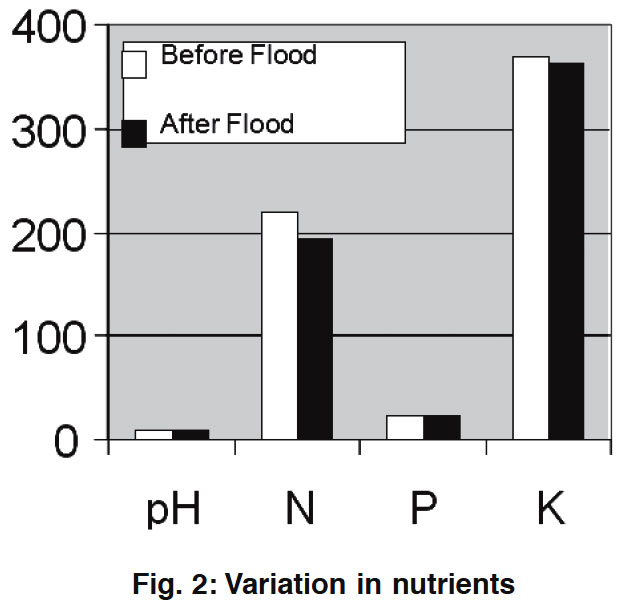 |
Fig. 2: Variation in nutrients Click here to view |
Determination of pH and conductance of soil sample
The pH meter Systronics digital model No. 552, having combined electrode were used for the measurement of pH of soil in suspension of water by pH sensitive electrode method1. Amount of soluble salts in a soil sample were estimated from EC of aqueous soil extracts.2
Determination of major nutrients (N.P.K. and organic carbon) in the soil
Usually organic carbon is expressed as organic matter. Since, the organic matter on an average contains 58% organic carbon. The organic carbon in the soil was estimated by wet oxidation method2,3 (Walkley-Black method). Available nitrogen in the soil was determined by Alkaline permanganate method.2,3 Olsen’s method2,3 is employed for the determination of available phosphorus in the soils. Available potassium is determined by using a flame photometer.
Determination of secondary Nutrients
Available Sulphur in the soil refers to mainly SO4-S, both exchangeable and water soluble. The determination of available sulphur includes extraction using appropriate reagent and estimated by turbidometric method.3 The same extract for available potassium estimation, was used for the determination of calcium and magnesium under working standards.3
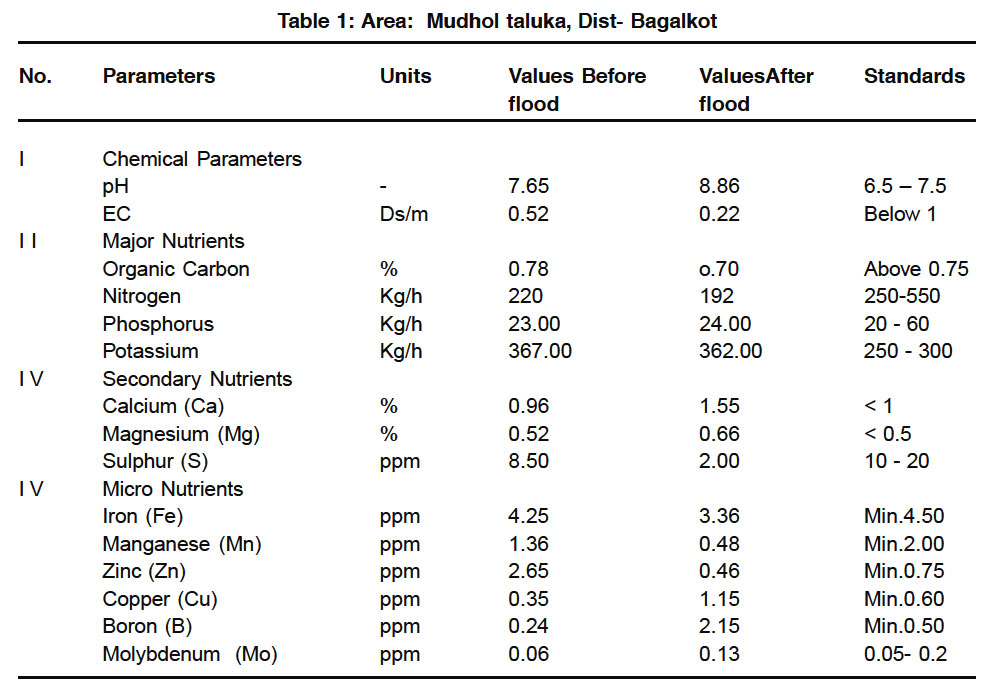 |
Table 1: Area: Mudhol taluka, Dist- Bagalkot Click here to view |
 |
Table 2: Area: Bilagi taluka, Dist- Bagalkot Click here to view |
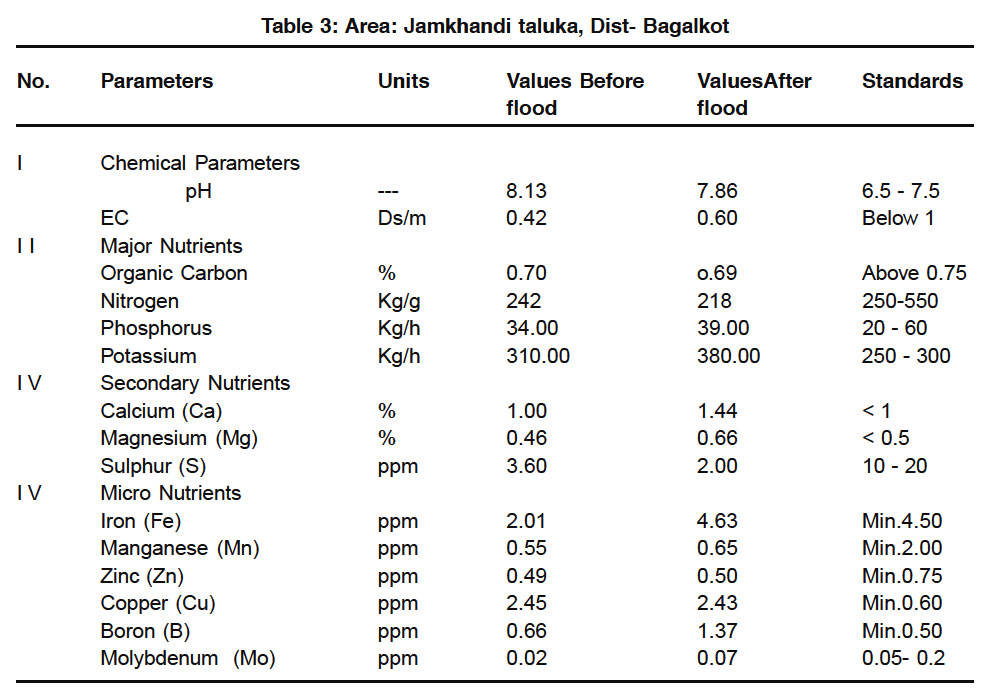 |
Table 3: Area: Jamkhandi taluka, Dist- Bagalkot Click here to view |
Determination of Micro- Nutrients
(Fe, Mn, Zn, Cu, Boron and Molybdenum) All the micro-nutrients were estimated by using Atomic Absorption Spectrophotometer in ppm values3,4
Results and Discussion
The pH data given in Tables 1 to 3 determines the degree of acidity or alkalinity in the soil materials suspended in water. The variation in the pH values helps to know the solubility of soil minerals and the mobility of ions in the soil. The pH values in all three areas of the district slightly increase after the flood. The pH of the soil samples before and after the flood was exceeded more than tolerable limits of ISI, WHO standards. Soils were found to be slightly basic. The EC levels of all the samples were also seen well below the permissible limits of various standards.
The major Nutrients such as Organic Carbon in the soil samples collected from Bilagi and Jamkhandi areas of the district, were found to be less than the permissible limits before as well as after the flood, but there was more in the percentage values of organic carbon before flood in the soil sample collected in Mudhol area, after the flood it was noticed that the declination in the percentage of organic carbon may be due to natural purification. Nitrogen, phosphorus and potassium in the soil samples of the selected areas, before the flood the values were slightly nearer to the limits of various standards, but after the flood the soil samples were analyzed and it was found to be the declination in the values of these nutrients.
The secondary Nutrient Calcium in the soil samples collected at Mudhol, Jamkhandi and Bilagi were mostly found to be remaining within the permissible limits of various standards before the flood. The soil samples collected after the flood in these three areas crossed the minimum tolerance limit of 1% of WHO standards. Magnesium in the soil samples also follows the same trend as Calcium before the flood, but after the flood the Magnesium in the soil samples crossed the minimum tolerance limit of 0.5% of WHO and ISI standards. Among the samples collected from three areas, the Sulphur values found to be lesser than the minimum tolerance limit.
The micro-Nutrients before and after the flood especially Iron in all three areas found to be less than 4.5 ppm of WHO standards, slight exceed in the Iron values in the soil samples collected in Bilagi and Jamkhandi areas after the flood.
There will be a declination in the Magnesium values after the flood from the sample collected at Mudhol, But the soil samples collected from Bilagi and Jamkhandi show the more Magnesium values after the flood. Further, the study of micro-nutrients such as Copper and Boron noticed more in the soil samples were collected from three talukas of the district after the flood effect. Zinc also found in the same trend of the soil samples collected from Bilagi and Jamkhandi areas as shown in Tables 2 and 3. But there will be a declination in the Zinc values of the soil samples collected from Mudhol area after the flood. Finally the Molybdenum values of the soil samples collected from the three areas were found to be remaining within the permissible limits of various standards. Figure 1 and Figure 2 shows the variation in the Chemical parameters, Major Nutrients, Secondary Nutrients and Micro Nutrients before and after the flood in the Bagalkot district.
Conclusion
The soil samples collected from three places before and after flood in Bagalkot district, were analyzed for various parameters and reported that there will be slight variation in few parameters from the permissible limits of standards. Some recommendations were made to the farmers of the concerned fields for proper use of fertilizers.
Acknowledgements
Authors are very much thankful to Mr. Praveen M. Katti and his technicians, Rohini Analab, Mahalingapur for their interest, valuable help and necessary facilities in the research work.
References
1. Dr. Sunita Hooda,Dr. Sumanjeet Kaur. V, “Laboratory manual for Environmental chemistry”, S.Chand and Company ltd. New Delhi, (2001).
2. Black, C.S., “Methods of Soil Analysis” Part II (1965).
3. Jackson, M.L., “Soil Chemical Analysis”, Prentice Hall of India PVT. Ltd. New Delhi, 205 (1967).
4. Jeffery G.H, Basset J, Mendham J and Denny R C, “Vogel’s Text Book of quantitative chemical analysis”, 5 th edn. ELBS (1989).
5. Subbaiah, B.V. and Ashija, G.L., Current Science., 25: 252 (1956).
6. B.K.Sharma and H.Kaur, “Environmental Chemistry” , Goel publishing house, Merrut (2004).
7. A.K.De, “Environmental Chemistry”, Wiley Eastern limited (2003).
8. S.S.Dara, “A Test Book of Environmental Chemistry and Pollution Control”, S.Chand and company ltd (2000).
9. APHA Standard methods for analysis of Water and Waste water, 18th Ed., American Public Health Association, Inc., Washington DC, (1992).


