Effect of thermal pollution on the hydrological parameters of river Jhelum (J & K)
Tanveer A. Qureshi1 * , T.A. Qureshi1 , Salman Rouf Chalkoo1 , Kamlesh Borana1 and Susan Manohar1
1
Department of Applied Aquaculture,
Barkatullah Universit,
Bhopal,
462 026
India
http://dx.doi.org/10.12944/CWE.5.2.10
The Buniyar hydroelectric project and the Lower Jhelum Barrier at Gantamulla constructed across river Jhelum are in operation from several years. The two power stations have changed the hydrological features of the area where dam is situated. Therefore, the impact of hydroelectric projects on fishery resources of river Jhelum is a matter of great concern. The treated water from the power house is released through turbines, having cooling effect on them. The change in the hydrological parameters such as increase in temperature, depletion of oxygen etc. might have brought fishes under stress which is the main cause in decreased population of finfishes from site to site. The golden Mahaseer, Tor putitora, which was once an abundant species in River Jhelum has come under the threat of extinction due to human intervention. The prevailing water quality around hydroelectric projects is unsuitable for finfishes of river Jhelum.
Copy the following to cite this article:
Qureshi T. A, Qureshi T. A, Chalkoo S. R, Borana K, Manohar S. Effect of thermal pollution on the hydrological parameters of river Jhelum (J & K). Curr World Environ 2010;5(2):287-292 DOI:http://dx.doi.org/10.12944/CWE.5.2.10
Copy the following to cite this URL:
Qureshi T. A, Qureshi T. A, Chalkoo S. R, Borana K, Manohar S. Effect of thermal pollution on the hydrological parameters of river Jhelum (J & K). Curr World Environ 2010;5(2):287-292. Available from: http://www.cwejournal.org/?p=1197
Download article (pdf)
Citation Manager
Publish History
Introduction
River Jhelum is lifeline of Kashmir and is the only source of water which drains the valley from South to North. It is the only ultimate source of water, which inhibits all species of fishes of valley, being the most resourceful water body. But due to various anthropogenic activities it is bringing up threat to its fauna and flora. The most precarious and deteriorative is construction of dams which have affected the hydrological features of region surrounding the dam.
The Buniyar barrage and the Lower Jhelum barrier at Gantamulla constructed across river Jhelum, are in operation from several years. Both hydropower stations have affected the hydrological features of dam area of river Jhelum. The dam has been constructed across the river from where the water is led to turbines, beside the main river. The water is then allowed to join the main river, after cooling the turbines. In case of Lower Jhelum hydropower station, the water is led through an open channel of few kilometres, while in case of Buniyar barrage water is led through an eleven kilometre long tunnel in the mountains, achieving a difference in altitude of about 210 m., before water is again allowed to join the main river.
The two hydroelectric projects have caused thermal pollution in the dam area. Change in the hydrological parameters might affect the metabolic activities of fishes and may result in stress, which will result in decreased distribution and population of fishes.
Devi et al., (1979), has envisaged thermal pollution as one of the factors responsible for causing environmental hazard. Most researchers have worked on the fish fauna of Jammu and Kashmir. Some of the recent works are that of (Qureshi et al., 2006, Salman et al., 2006, Arjumand et al., 2006 and Qureshi et al., 2007,). Scientists have also worked on the temperature regime of the water bodies of Kashmir valley (Wanganeo et al., 1992, Yousuf et al., 1995) but very less work is available on the effect of thermal pollution on the hydrobiological aspects of these water bodies as well as availability of different fishes in this area. Therefore, this piece of work was undertaken for investigating the same in river Jhelum in Jammu and Kashmir.
Material and Methods
Study Sites
Four sites from various locations on river Jhelum were selected for the study of physico-chemical parameters.
Site-1 The first site was selected near the Jhelum entering the Lower Jhelum Hydroelectric Power Project (LJHP). The site is lined by Gantamulla on the left bank and Zehanpora on the right bank
Site-2 It lies near outlet of L.J.H.P towards the Uri barrage. The area is lined by Warikha on the left side and Chahal on the right side
Site-3 It lies near the Uri Dam (Boniyar), where the water of river Jhelum is again blocked. On left bank, it is lined by Buniyar and on the right bank by Pringal.
Site-4 It is situated at the end of Uri hydroelectric power project. The area is guarded by Bandhi on the left bank and Paranpela on the right bank.
Physico-Chemical Parameters
Monthly samples of water were collected from selected sites of River Jhelum, for a period of six months from June, 2006 to November, 2006. The water parameters such as temperature, total dissolved solids, pH, free carbon dioxide, and total alkalinity were measured at sampling site it self. The estimation of dissolved oxygen, chloride, total hardness and COD was done in laboratory. All the parameters were analysed following the methods of Golterman et al. (1978), Boyed (1979) and APHA (1995).
Results
Physiochemical parameters of any water body assume importance since slight disturbance in any one of them may alter the whole ecological picture of the water which may create disaster to all aquatic lives inhabiting it. The physico-chemical parameters evaluated exhibited marked variation through out the study period which is shown in fig 1-8.
The physico-chemical parameters were evaluated in from sampling stations fixed at river Jhelum which exhibited marked variation throughout the study period which is shown in fig. 1-8.
Water temperature - (Fig.-1)
During the study period the maximum temperature at site I was recorded to be 240C in June and July. While the minimum temperature was recorded to be 120C in November. The maximum temperature at site II was recorded to be 240C in July and August. While the minimum temperature was recorded to be 130C in November. The maximum temperature at site III was recorded to be 23.930C in August. While the minimum temperature was recorded to be 13.10C in November. The maximum temperature at site IV was recorded to be 23.920C in August. While the minimum temperature was recorded to be 12.020C in November.
Total Dissolved solids : (Fig. 2)
During the study period the maximum total dissolved solids at site I were recorded to be 150mg/ l in June. While the minimum total dissolved solids were recorded to be 58 mg/l in August. Maximum total dissolved solids at site II were recorded to be 135 mg/l in June. While the minimum total dissolved solids at site II were recorded to be 51 mg/l in August. Maximum total dissolved solids at site III were recorded to be 135 mg/l in June. While the minimum total dissolved solids a site III were recorded to be 49 mg/l in August. Maximum total dissolved solids at site IV were recorded to be 154 mg/l in June. While the minimum total dissolved solids at site IV were recorded to be 56 mg/l in August.
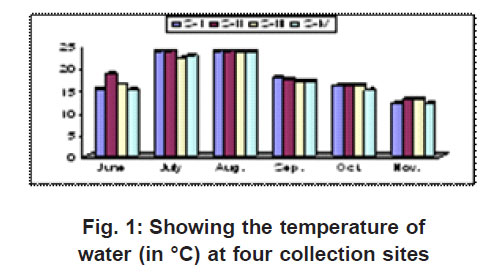 |
Figure 1: Showing the temperature of water (in °C) at four collection sites Click here to view figure |
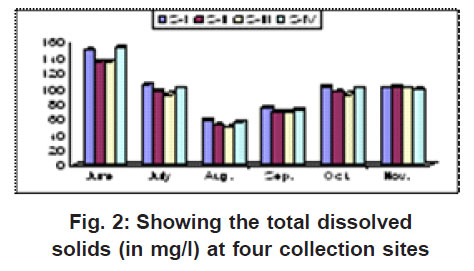 |
Figure 2: Showing the total dissolved solids (in mg/l) at four collection sites Click here to view figure |
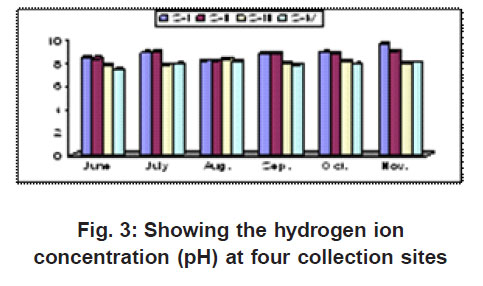 |
Figure 3: Showing the hydrogen ion concentration (pH) at four collection sites Click here to view figure |
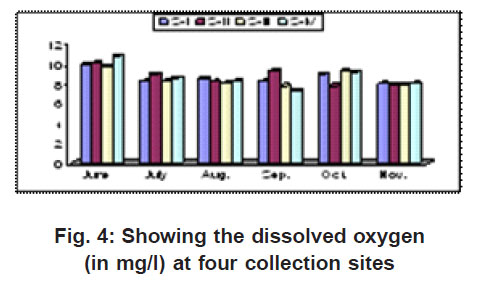 |
Figure 4: Showing the dissolved oxygen (in mg/l) at four collection sites Click here to view figure |
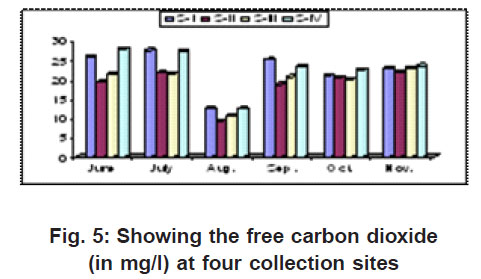 |
Figure 5: Showing the free carbon dioxide (in mg/l) at four collection sites Click here to view figure |
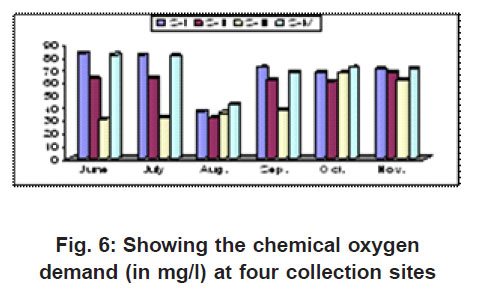 |
Figure 6: Showing the chemical oxygen demand (in mg/l) at four collection sites Click here to view figure |
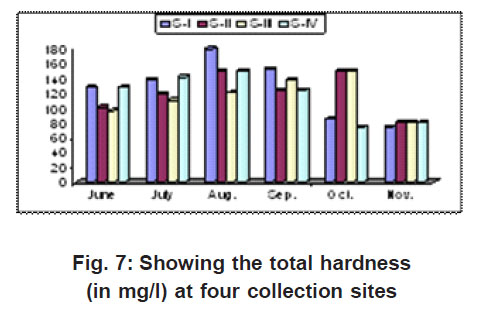 |
Figure 7: Showing the total hardness (in mg/l) at four collection sites Click here to view figure |
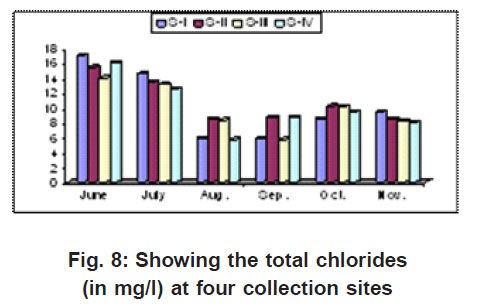 |
Figure 8: Showing the total chlorides (in mg/l) at four collection sites Click here to view figure |
pH : (Fig.-3)
During the study period the maximum pH recorded at site I was to be 9.6 in November. While the minimum pH was recorded to be 8.9 in August. The maximum pH recorded at Site II was to be 9.0 in November. While the minimum pH was recorded to be 8.20 in August. The maximum pH recorded at site III was to be 8.3 in August. While the minimum pH was recorded to be 7.76 in June. The maximum pH recorded at site IV was to be 8.1 in August. While the minimum pH was recorded to be 7.42 in June.
Dissolved oxygen : (Fig-4)
During the study period the maximum dissolved oxygen recorded at site I was to be 10.1 mg/l in January. While the minimum dissolved oxygen was recorded to be 8.0 mg/l in November. The maximum dissolved oxygen recorded at site II was to be 9.9 mg/l in January. While the minimum dissolved oxygen was recorded to be 7.8 mg/l in November. The maximum dissolved oxygen recorded at site III was to be 10.0 mg/l in June. While the minimum dissolved oxygen was recorded to be 8.9 mg/l in September. The maximum dissolved oxygen recorded at site IV was to be 9.6 mg/l in June. While the minimum dissolved oxygen was recorded to be 7.8 mg/l in September.
Free Carbon dioxide (Fig-5)
During the study period the maximum free carbon dioxide recorded at site I was to be 21.6 mg/l in June. While the minimum free carbon dioxide was recorded to be 9.3 mg/l in August. The maximum free carbon dioxide at site II was recorded to be 27.5 mg/l in June. While the minimum free carbon dioxide was recorded to be 12.5 mg/l in August. The maximum free carbon dioxide recorded at site III was to be 21.6 mg/l in June. While the minimum free carbon dioxide was recorded to be 10.5 mg/l in August. The maximum free carbon dioxide recorded at site IV was to be 27.33 mg/l in June. While the minimum free carbon dioxide was recorded to be 12.4 mg/l in August.
Chemical Oxygen Demand : (Fig. -6)
During the study period the maximum chemical oxygen demand was recorded to be 83.4 mg/l in June at site I. While the minimum chemical oxygen demand was recorded to be 37.2 mg/l in August. The maximum chemical oxygen demand was recorded to be 63.5 mg/l in July at site II. While the minimum chemical oxygen demand was recorded to be 31.6 mg/l in August. The maximum chemical oxygen demand was recorded to be 67.5 mg/l in October at site III. While the minimum chemical oxygen demand was recorded to be 31.22 mg/l in June. The maximum chemical oxygen demand was recorded to be 82.05 mg/l in June at site IV. While the minimum chemical oxygen demand was recorded to be 42.5 mg/l in August.
Total Hardness : (Fig-7)
During the study period the maximum total hardness was recorded to be 180 mg/l in August at site I. While the minimum total hardness was recorded to be 74 mg/l in November. The maximum total hardness was recorded to be 150 mg/l in October at site II. While the minimum total hardness was recorded to be 80.2 mg/l in November. The maximum total hardness was recorded to be 140 mg/l in October at site III. While the minimum total hardness was recorded to be 80 mg/l in November. The maximum total hardness was recorded to be 150 mg/l in August at site IV. While the minimum total hardness was recorded to be 74.1 mg/l in October.
Total chlorides: (Fig-8)
During the study period the maximum total chlorides at site I was recorded to be 17 mg/l in October. While the minimum total chloride was recorded to be 6 mg/l in June. The maximum total chloride at site II was recorded to be 16 mg/l in August. While the minimum total chloride was recorded to be 8 mg/l in June. The maximum total chloride at site III was recorded to be 14 mg/l in August. While the minimum total chloride was recorded to be 5 mg/l in June. The maximum total chloride at site IV was recorded to be 16 mg/l in November. While the minimum total chloride was recorded to be 6 mg/l in July.
Discussion
More or less similar parameters as observed in the present study, have been recorded by Swedish Ministry of Agriculture, 1982; Okland and Okland, 1986. Sharma, 1986; & Svensson et al., 1995.
The River Jhelum river has already lost one fish species, the migratory Golden Mahaseer, Tor putitora, due to Mangla Dam down stream in Pakistan part of Jhelum river. Earlier, the Mahaseer migrated upstream to Kashmir valley for spawning ( Mirza and Bhatti, 1986). The project area is in a climatic zone described as Himalayan dry temperate forest where January is the coldest month & July the warmest. In the main Kashmir valley the temperature fluctuates between -5°C to above 30°C. At higher altitudes the snow remains on the peaks almost all throughout the year. Lakes above 3000 m.s.l. are covered with ice, for eight months of the year and those at 2000 m.s.l four months of the year while ice in the valley only occurs on some nights in small ponds. The maximum temperature during the summer ranges from 15°C in mountains to 30°C in the valley lakes (Wanganaeo et al., 1992). The fish fauna of this region is adapted to lower temperature regime and therefore also to other parameters prevailing in such condition.
Menon et al.(2000) have described cold water fisheries as the one occurring in water bodies having temperature not more than 18-20°C and the lower temperature may be anywhere from 0-5 °C or slightly more depending upon the altitude, topography and climatic factors of area. They also stated along with water temperature factors like dissolved oxygen etc. control the occurrence and abundance of fish in cold water. In the present study the water temperature has crossed this limit and has been recorded upto 24 °C. Wikipeda (2008)
stated that the temperature change of even one to two degree Celsius can cause significant change in organism metabolism and other adverse cellular biology effect. Principal adverse changes can include rendering cell walls less permeable to necessary osmosis, coagulation of cell protein and alteration of enzyme metabolism. These cellular level effects can adversely affect reproduction and also cause mortality. Lenntech (2008) opined that species that are intolerant to warm water conditions may disappear, while others preferring this condition may thrive so that the structure of the community changes. Respiration and growth rates maybe changed. An increase of temperature may result in the loss of sensitive species. Menon et al. (2000) have also stressed on the influence of certain parameters which exert profound influence on the distribution and availability, in which temperature is stated to be first.
The present study points out that the hydroelectric projects have adversely affected the natural stocks of cold water fish. The activities pertaining to the projects under construction are responsible for increase in the silt load and destruction of fish food organisms in streams. The increased silt load along with changed temperature regime of channel adversely affected the feeding and spawning of fish (Menon et al., 2000). The present study also throws light on the effect of thermal pollution in the area surrounding the two power stations. This can be one of the reasons for elimination of Tor putitora from the site.
References
- Arjmund Shabana., Preliminary survey on the status of aquatic biodiversity of river Jhelum in relation to certain biotic parameters, Srinagar, Kashmir). P.hD Thesis, Barkatullah Univ., Bhopal. 2006;1-86.
- Devi K. S., Venogopal P., Remani K. N., Lalitha S. & Unnitha R. V. Hydrographic features and water quality of Cochin Backwaters in relation to industrial pollution. Indian Journal of Marine Scienctes. 1979;8:141-145.
- Lenntech. Lenntech water treatment and air???? purification holding B. V. Rotterdamsewege 402 M. 2629 HH delft, The Netherlands. 2008.
- Mirza M. R., M. N., Bhatti. Systametics and biology of the golden mahaseer of the Indus river system. Biologia. 1986;42:31-35.
- Menon A. G. K., Singh H. R., Kumar N. Present eco-status of cold water fish and fisheries. 2002.
- Okland J., K. A., Okland. The effects of acid deposition on benthic animals in the lake and streams. Experientia. 1986;42:L 471-486.
- Qureshi T. A., Najar A. M., Salman Rauoof., Amioria Shafia., Common fish species of Wular lake, Kashmir-Their morphometric contextualstudies. Fishing Chimes. 2006;25: 133-135.
- Salman R., Chalkoo., Tanveer A., Qureshi., Bilal A. Dar, Ramandeep Kour, Ajmair S. Sodhi, T. A. Qureshi., Status Of Cold Water Fisheries OF Kashmir, Fishing chimes. 2006;26(10).
- Tanveer A. Qureshi, Salman R. Chalkoo, K.Borana, S. Manohar, Syed Shsahzada Mudasir and T. A. Qureshi., Effect of Lower Jhelum hydroelectric project on finfish diversity of river Jhelum, (J & K). Current World Env. 2007;41-43.
- Sharma R. C., Effect of physico – chemical factors on benthic fauna of Bhagirathi River, Garhwal Himalaya. Indian J. Ecol. 1986;13(1):133-137.
- Svensson T. W., Dickson J., Hellberg G. Moberg., N. Munthe. The Swedish liming programme. In Acid Region ’1995. Eds. P. Grennfelt, H. Rhode, E. Thornelof and J. Wisniewski. Kluwer Academic Publishers. 1995;2:1003-1008.
- Swedish Minsitry of Agriculture 1982. Acidification today and Tomorrow. The Stockholm conference on the acidification of the environment. 1982 .
- Wanganeo A., Zutshi D. P., Wanganeo R. Catchment deterioration – fish populations. In: Current trends in fish and fishery biology and aquatic ecology. Eds. A. R., Yousuf M. K., Raina., M. Y Qadri. Published by Post Graduate Department of Zoology, University of Kashmir, Srinagar – India. 1992;173-178.
- Wikipedia, Wikipedia Free encyclopaedia. 2008.
- Yousuf A. R., Fishery Resources of Kashmir. In: Ecology, Environment and Energy. Eds. A.H. Khan and A.K. Pandit. University of Kashmir. Srinagar, MS only. 1995;20.


