Heat transfer and fluid flow analysis of roughness ribin solar air heater duct by computational fluid dynamics (CFD)
Prashant Baredar1 * , Shankar kumar2 , Ajeet kumar Giri2 and Jitendra kumar3
1
Department of Energy,
Maulana Ajad National Institute of Technology,
Bhopal,
462 051
India
2
Department of Mechanical Engineering,
Lakshmi Narayan College of Technology,
Bhopal,
462 021
India
3
Department of Mechanical Engineering,
NRI Institute of Information Science and Technology,
Bhopal,
462 021
India
http://dx.doi.org/10.12944/CWE.5.2.09
This study evaluates heat transfer and fluid flow behavior in a rectangular duct with inverted U-type turbulator roughened ribs mounted on one of the principal wall (solar plate) by computational fluid dynamics software (Fluent 6.3.26 Solver). In this study CFD software has been used to perform a numerical simulation for enhance turbulent heat transfer. In this study, the Reynolds-Averaged Navier–Stokes analysis is used as a numerical technique and the k-e turbulent model with near-wall treatment as a turbulent model. The results are validated by comparing with existing experimental datas. The Reynolds number, pitch-to-rib high ratio and different pitch are chosen as design variables. Reynolds number range from 3800 to 18000; ratio of turbulator height to duct hydraulic mean diameter is varied from, e/Dh = 0.0186 to 0.03986 (Dh = 37.63 mm and e = 0.7 to 1.5 mm) and turbulator pitch to height ratio is varied from, p/e = 6.67 to 57.14 (p = 10 to 40 mm).The angle of attack of flow on turbulators, a = 90o kept constant during the whole analysis. The effects of roughness parameters on Nusselt number and friction factor have been discussed and the conditions for the best performance have been analysied.
Copy the following to cite this article:
Baredar P, Kumar S, Giri A. K, Kumar J. Heat transfer and fluid flow analysis of roughness ribin solar air heater duct by computational fluid dynamics (CFD). Curr World Environ 2010;5(2):279-285 DOI:http://dx.doi.org/10.12944/CWE.5.2.09
Copy the following to cite this URL:
Baredar P, Kumar S, Giri A. K, Kumar J. Heat transfer and fluid flow analysis of roughness ribin solar air heater duct by computational fluid dynamics (CFD). Curr World Environ 2010;5(2):279-285. Available from: http://www.cwejournal.org?p=285/
Download article (pdf)
Citation Manager
Publish History
Introduction
An attempt has been made to carry out CFD based analysis to fluid flow and heat transfer characteristics of a solar air heaters having roughened duct provided with artificial roughness. Combined effect of swirling motion, detachment and reattachment of fluid which was considered to be responsible in the increase of heat transfer rate has been observed during CFD analysis. Nusselt number has been found to increase with increase in Reynolds number where friction factor decreases with increase in Reynolds number for all combinations of relative roughness height (e/D) and relative arc angle (a/90). CFD results have also been validated for smooth duct and different CFD model results were compared with Dittus–Boelter pirical relationship for smooth duct. Among all the models used, k-ε model (RNG) results have been found to have good agreement.
Nomenclature
H Height of the solar air heater duct, mm
W Width of the solar air heater duct, mm
Dh Hydraulic diameter of channel, mm
p Pitch, mm
e Roughness height, mm
e/D Relative roughness ratio
p/e Relative roughness pitch
Nur Nusselt number for roughened duct
Nus Nusselt number for smooth duct
fr Friction factor for roughened duct
fs Friction factor for smooth duct
Pr Prandtl number
Re Reynolds number
h Convective heat transfer coefficient, Wm-2K1
k Thermal conductivity, Wm-1K-1
L Length of test section, mm
p Static pressure, Pa
u Mean velocity, m s-1
u’i Fluctuation velocity components, m s-1
α Thermal diffusivity (m2/s)
β Coefficient of volumetric expansion (1/K)
µ Kinematic viscosity, kg s-1m-1
µt Eddy viscosity, kg s-1m-1
ij Reynolds stress, m2 s-2
w wall shear stress, Pa
ω Turbulent specific dissipation rate, s-1
ε Turbulent dissipation rate, m2 s-3
ρ Density, kg m-3
A constant heat flux of 1000 W/m2 was considered to be supplied by having a heater plate placed over the absorber plate assume that average solar heat flux is 1000 W/m.2 Solution Domain
Duct Height (H) =130mm
Duct Width (W) =22mm
Hydraulic mean diameter, ‘Dh’ = 37.63 mm Duct aspect ratio, ‘W/H’ = 6
Inlet Length=270mm (> 5√WH)
Length of Test Section=250mm (Taking only for CFD analysis purpose)
Outlet length= 140mm (> 2.5√WH)
Turbulator height, ’e’ = 0.7mm, 1.0mm and 1.5mm (shows in Fig. 4.6)
Turbulator height to hydraulic mean diameter ratio, ‘e/Dh’=0.0186–0.03986
Turbulator pitch to height ratio, ‘p/e’= 6.667–57.14 Angle of attack of flow, ‘α’= 90o
Reynolds number, ‘Re’= 3800–18,000 Uniform Heat at bottom Surface=1000 W/m2K
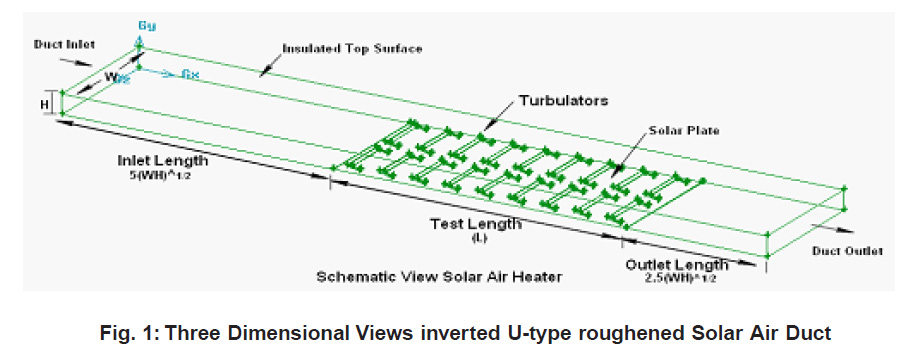 |
Figure 1: Three Dimensional Views inverted U-type roughened Solar Air Duct
|
Fig.3 shows the solution domain for analysis. A uniform heat flux of 1000 W/m2 is given at bottom broad wall keeping all other walls smooth and insulated. The inverted U-type turbulator provided on the heated wall are also insulated from the wall, thus no heat is given to the ribs as done by Tanda. Fig.3 shows that turbulator rib geometry, In total length of tarbulator 12mm one part 5mm length past on solar plate and reaming 7mm length in inclined having a different angle according to roughness height. Analysis is carried out with 2D mesh, which not only saves computer memory but also lot of computational time.
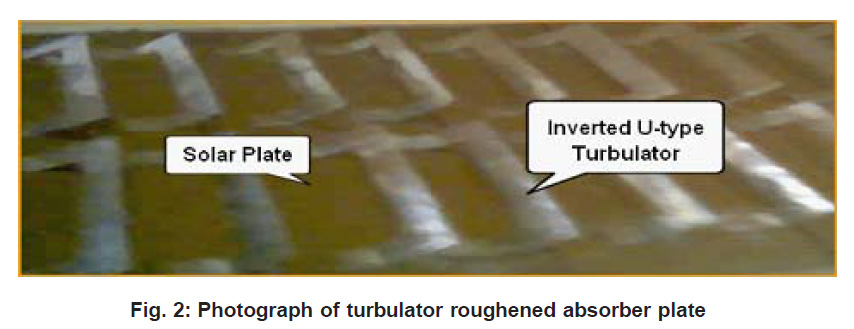 |
Figure 2: Photograph of turbulator roughened absorber plate
|
Grid Independence Test
For grid independence test, the number of cells is varied from 3,72590 to 9,34175 in various steps. It is found that after 8,49250 cells, further increase in cells has less than 1% variation in Nusselt number value which is taken as criterion for grid independence.
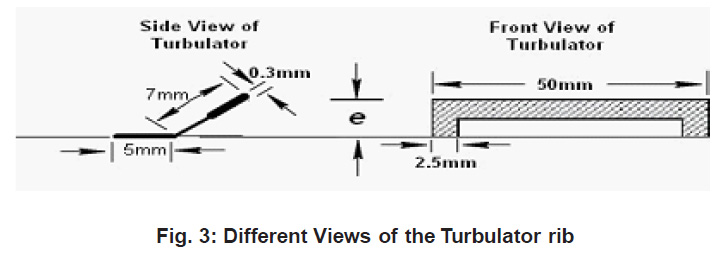 |
Figure 3: Different Views of the Turbulator rib
|
The computational fluid dynamics simulations were performed for rectangular duct with one roughened wall with ‘inverted U-shaped turbulator’; subjected to uniform heat flux boundary condition has been performed. The remaining three smooth walls were insulated. These conditions correspond to the flow in the solar air heater duct. The effect of Reynolds number, relative roughness pitch and relative roughness height on the heat transfer coefficient and friction factor has been studied. Results have been compared with those of a smooth duct under similar flow conditions to determine enhancement in heat transfer coefficient and friction factor. Investigations have been carried out in medium Reynolds number flow (Re = 3800– 18,000). The recirculation zones are clearly identified and the flow is seen to reattach before the following in all cases. In cases, the flow over the ribs appears to be the most complex; since the turbulator face is set inclined to the flow direction, sizable primary and secondary recirculation regions form near the front and rear corners at the turbulator bottom. The size of the recirculation zone, however, is largest for the p/e =6.67 rib and smallest for the p/e=57.143.
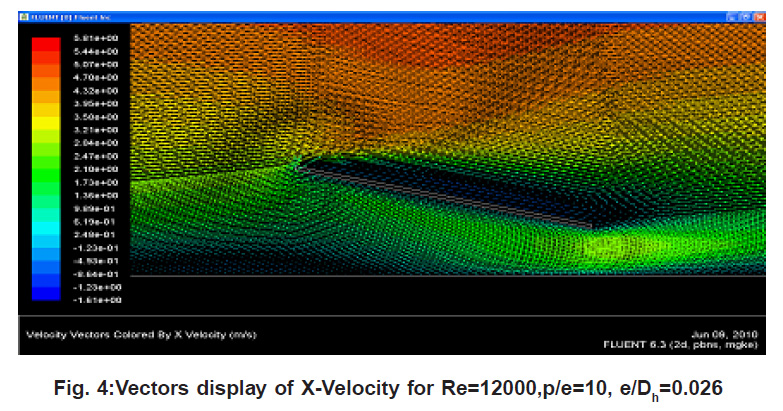 |
Figure 4: Vectors display of X-Velocity for Re=12000,p/e=10, e/Dh=0.026
|
Flow structure
The figures present path lines of turbulent channel flow through turbulator using the kӌ model for e/Dh=0.0186 to 0.0398. Here the path lines in the channel are presented. It can be visible that the largest re-circulation zone can be found in the groove region for p/e =6.67 reason behind this is roughness height becomes e=1.5 at this maximum air diverse to bottom surface solar plat also increase rate of heat transfer. If compare all Fig.4 found that bigger re-circular zone we get in front of turbulator which having p/e =6.67. Fig.4 shows the flow pattern in form of vectors around the turbulator region. It clearly shows the dead regions (eddy formation) adjacent to the turbulator, both on front side and back sides. The front side has larger eddies. These are regimes of low heat transfer
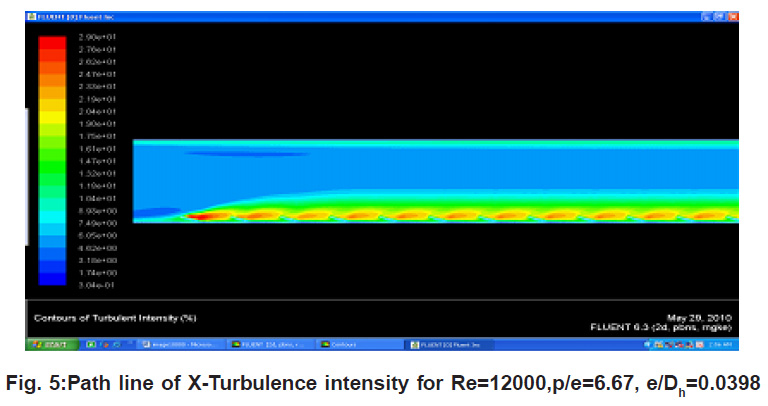 |
Figure 5: Path line of X-Turbulence intensity for Re=12000,p/e=6.67, e/Dh=0.0398
|
The contours of turbulence intensity are displayed in Fig.4 for different p/e and e/Dh ratios. The peak turbulence intensity values, predicted by the k-
ε turbulence model, are seen on the back side of turbulator regions, while the turbulence intensity is observed to be very low at groove bottom wall area. If compare all fig.5 turbulence find maximum at p/e =6.67 due roughness height, this proof that we get higher heat transfer compare to other p/e ratio
 |
Figure 6: X-Y Plot generated by fluent Solver for Heat transfer Coefficient Re=12000, p/e=14.286,e/Dh=0.0186 |
Fig.6 shows the variation of Nusselt number with Reynolds number for different roughness height. It can be seen that the Nusselt number value increases with Reynolds number in all cases as expected, results have also been compared with those of the smooth duct under similar flow and thermal boundary conditions to determine the enhancement in the heat transfer coefficient.
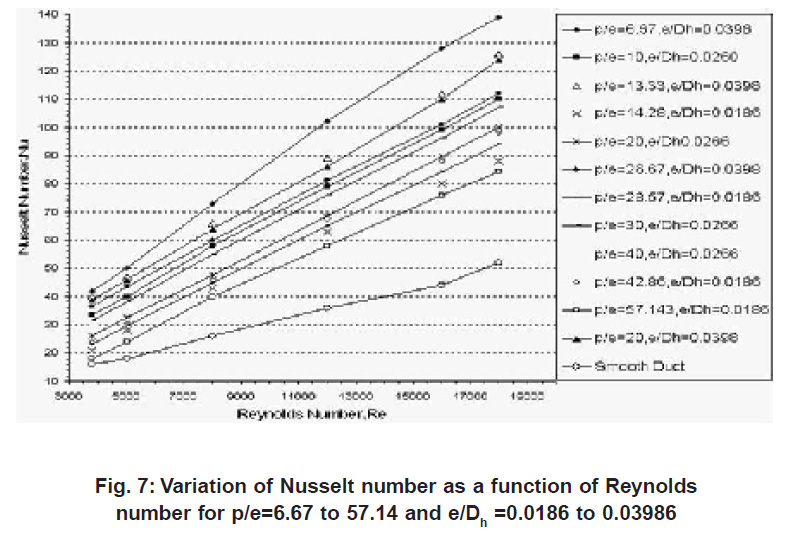 |
Figure 7: Variation of Nusselt number as a function of Reynolds number for p/e=6.67 to 57.14 and e/Dh =0.0186 to 0.03986 |
Friction loss
It is seen that the friction factor decreases with increasing Reynolds number in all cases due to the suppression of viscous sub-layer with the increase of Reynolds number. The friction factor for air flowing in the turbulator roughened channel with small p/e ratio is found to be higher than that with large ratio. The friction factor decreases with the increase of p/e ratio and thus, the p/e=6.67 provides maximum friction factor.
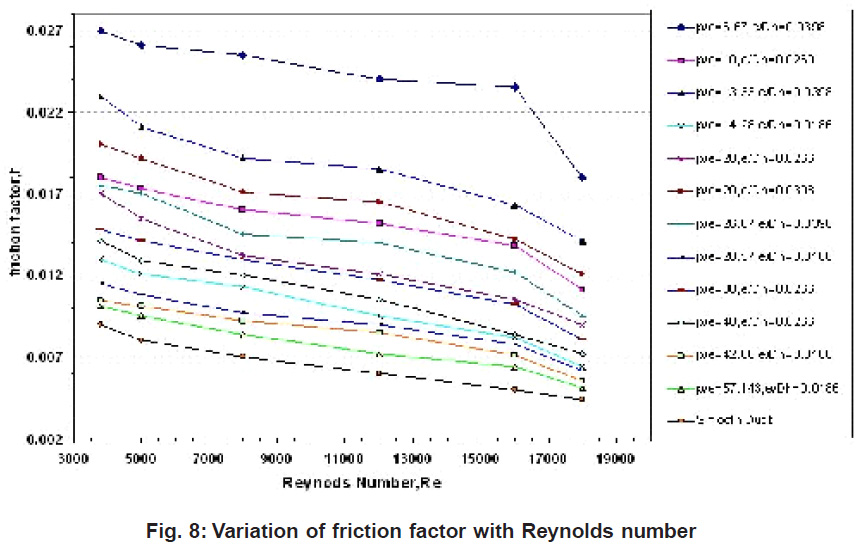 |
Figure 8: Variation of friction factor with Reynolds number
Click here to view figure |
Conclusion
Provision of ribs completely obstructs the viscous sub-layer adjacent to the hot wall, which generates eddies/recirculation zones upstream and downstream, Eddies not only reduce the heat transfer but also increase the pressure drop. With opening the passage downstream the rib, intensity of eddies formation can be reduced. A thin inclined U-turbulator geometry with a passage underside could definitely prevent totally the formation of eddies and also the redevelopment of two boundary layers at the reattachment point in between two adjacent ribs.
Value of the Nusselt number increases sharply at low Reynolds number and this becomes constant or increases very slightly in comparison to low Reynolds number; This also satisfied our aim of solar collector application at low Reynolds number.
In the inter-rib region, the model predicts well near the central high heat transfer area but it under predicts around ribs.
Results shows that peak of local heat transfer are found at the reattachment points. Experiments also confirm it.
Results also shows that turbulence intensity is found maximum at peak of the local heat transfer coefficient in the inter-rib regions. This is maximum for p/e = 6.67
Tabulator is having more number of sharp edges in order to shear more the viscous boundary layer. The turbulences generated only in the viscous sub-layer region of boundary layer results in better thermo-hydraulic performance i.e. maximum heat transfer at affordable friction penalty.
CFD analysis is completed after performing validity test and grid independence test. Also validated from literature (reference data) .
Future Work
CFD based 3D analysis in Solar Air heater, this improve accuracy.
CFD based analysis of solar air heater by using radiation model for outdoor solar air heater and thus help to provide efficient use of energy.
Application of the solar air heater for hot air, such as refrigeration air conditioning field , whole model can be made and analyze by CFD software and articulate saving in energy
References
-
Han J. C. “Heat transfer and friction in channels with two opposite rib- roughened walls.” ASME/J Heat Transfer. 1984;106:774–781.
-
Bhagoria J. L., Saini J. S., Solanki S. C. “Heat transfer coefficient and friction factor correlations for rectangular solar air heater duct having transverse wedge shaped rib roughness on the absorber plate.” Renewable Energy . 2002;25:341–369.
-
Sahua M. M., Bhagoria J. L., “Augmentation of heat transfer coefficient by using 90° broken transverse ribs on absorber plate of solar air heater.” Renewable Energy. 2005; 30:2057–2073.
-
Ebrahim Momin Abdul-Malik., Saini J. S., Solanki S.C. “Heat transfer and friction in solar air heater duct with V-shaped rib roughness on absorber plate.” International Journal of Heat and Mass Transfer . 2002;45:3383– 3396.
-
Harris D. J., Helwig N. “Solar chimney and building ventilation”. Applied Energy. 2007; 84:135– 146.
-
Saini S. K., Saini R. P., “Development of correlations for Nusselt number and friction factor for solar air heater with roughened duct having arc-shaped wire as artificial roughness”. Solar Energy. 2008;82:1118–1130.
-
Eiamsa-ard Smith., Promvonge Pongjet., “Thermal characteristics of turbulent rib-grooved channel flows”. International Communications in Heat and Mass Transfer. 2009;36:705–711.
-
Kamali R., Binesh A. R., “Heat transfer and frictional characteristics optimization with compound turbulator roughened duct”. Department of Mechanical Engineering Shiraz University Zand Street, School of Engineering, Shiraz, Iran. 71: 348-51154.
-
Layek Apurba., Saini J. S., Solanki S. C. “Effect of chamfering on heat transfer and friction characteristics of solar air heater having absorber plate roughened with compound turbulators”. Renewable Energy. 2009;34:1292–1298.
-
Karmare S. V.,Tikekar A. N.,”Experimental investigation of optimum thermohydraulic performance of solar air heaters with metal rib grits roughness”. Solar Energy. 2009;83: 6–13.
-
Gupta M. K., Kaushik S.C., “Performance evaluation of solar air heater for various artificial roughness geometries based on energy, effective and exergy efficiencies”. Renewable Energy . 2009;34:465–476.
-
Bopche Santosh B., Tandale Madhukar S., “Experimental investigations on heat transfer and frictional characteristics of a turbulator roughened solar air heater duct”. International Journal of Heat and Mass Transfer . 2009;52:2834-2848.
-
Aharwal K. R., Gandhi Bhupendra K., Saini J. S., “Heat transfer and friction characteristics of solar air heater ducts having integral inclined discrete ribs on absorber plate”. International Journal of Heat and Mass Transfer. 2009;52:5970-5977.
-
Saini R. P.,Verma Jitendra., “Heat transfer and friction factor correlations for a duct having dimple-shape artificial roughness for solar air heaters”. Energy. 2008;33:1277-1287.
-
Eiamsa-ard Smith., Promvonge Pongjet., “Numerical study on heat transfer of turbulent channel flow over periodic grooves”. International Communications in Heat and Mass Transfer. 2008;35:844-852.
-
Chaube Alok., Sahoo P. K., Solanki S. C., “Analysis of heat transfer augmentation and flow characteristics due to rib roughness over absorber plate of a solar air heater”. Renewable Energy. 2006;31:317–331.
-
Kumar Sharad., Saini R. P. “CFD based performance analysis of a solar air heater duct provided with artificial roughness”. Renewable Energy. 2009;34:1285-1291.
-
Sukhatme S. P. “Solar Energy Engineering”. Printice Hall Inc., New Jersey .1986
-
Kern J., Harris I., “On the optimum tilt of a solar collectors”. Solar energy. 1975;17:79-80.
-
Garg H. P., Gupta C. L., “Flat plate collector experimental studies and design data for India”, Proc. ISEC Congress, New Delhi. 1978;2:733-738.
-
Launder B. E., Spalding D. B. “Lectures in Mathematical Models of Turbulence. Academic Press, London, England. 1972.
-
Yakhot V., Orszag S. A., Renormalization Group Analysis of Turbulence: I.Basic Theory. Journal of Scientific Computing. 1986;1(1):1-51.
-
Shih T. H., Liou W. W., A Shabbir., Yang Z., Zhu J., “A New k-å Eddy-Viscosity Model for High Reynolds Number Turbulent Flows - Model Development and Validation. Computers Fluids”. 1995;24(3):227-238.
-
Choudhury D. “Introduction to the Renormalization Group Method and Turbulence Modeling”. Fluent Inc. Technical Memorandum. 1993;2-107.
-
Wilcox D. C. Turbulence Modeling for CFD. DCW Industries, Inc., La Canada, California. 1998.


