Identification of Ambient Air Pollution Prevention Zones Using Remotesensing and GIS:A Model Study
SS. Asadi1 * , B.V.T. Vasantha Rao2 , M.V. Raju3 and M. Anand Sagar4
1
Department of Civil Engineering,
KL University,
Green Fields,
Vaddeswaram,
522 502
India
2
Department of Civil Engineering,
P.V.P. Siddhardha Institute of Technology,
Kannure,
Vijayawada,
India
3
Department of Civil Engineering,
Vignan University,
Vadllamudi,
Guntur,
India
4
4 Research Scholar,
Jawaharlal Nehru Technological University,
Hyderabad,
500 072
India
Corresponding author Email: asadienviron.asadi@gmail.com
DOI: http://dx.doi.org/10.12944/CWE.6.2.02
The present study has been carried out Air pollution zones and Risk area map for Air pollution Activities in nine mandals namely Nakkapalli ,Elamanchilli,S. Rayavaram, Achchutapuram, Rambilli, Anakapalle, Munagapaka, Kasimkota, Paravada of Visakhapatnam District, covering an area of 1355 Sq.km. The study area is located between north latitudes 17° 19’ and 17° 46’”and east longitudes 82°35’ and 83°10’ and is covered in the survey of India topographical map numbers 56H65 K/10,11,13,14,15M 65 O/1, 65O/2.The IRS-P6, LISS-IV geo coded Remote sensing Satellite data and the above top sheets from Survey of India (SOI) are acquired for primary analysis. Using Visual Interpretation technique different thematic maps are prepared like base map, drainage map, Geomorphology map. These thematic maps were scanned and digitized using AutoCAD and converted into GIS. Air samples are collected from sampling stations were established in the study area using this sampling analysis was carried out as per the national ambient air quality standards (NAAQS), with respect to RSPM, TSPM, NOx, Sox. Based on the above data Topology is created by linking the spatial data file and attribute data file. GIS overlay analysis derived maps has been developed like Air pollution sensitivity map, Air quality map, Dispersion sensitivity map,Aerial sensitivity Mapwas carried out to find out the above parameters pollution lodes in the study area, Finally integrating of the all the above maps based on this maps Risk area map for Air pollution activities maps has developed. This kind of studies is very useful for Pollution Prevention in industrial areas and also useful for the planners decision makers for management and monitoring of industrial areas.
Copy the following to cite this article:
Asadi SS, Vasantharao BVT ,Raju MV, Sagar MA. Identification of Ambient Air Pollution Prevention Zones Using Remotesensing and GIS: A Model Study. Curr World Environ 2011;6:207-215 DOI:http://dx.doi.org/10.12944/CWE.6.2.02
Copy the following to cite this URL:
Asadi SS, Vasantharao BVT ,Raju MV, Sagar MA. Identification of Ambient Air Pollution Prevention Zones Using Remotesensing and GIS: A Model Study. Curr World Environ [serial online] 2011;6:207 -215. Available from: http://www.cwejournal.org/?p=193
Download article (pdf)
Citation Manager
Publish History
Select type of program for download
| Endnote EndNote format (Mac & Win) | |
| Reference Manager Ris format (Win only) | |
| Procite Ris format (Win only) | |
| Medlars Format | |
| RefWorks Format RefWorks format (Mac & Win) | |
| BibTex Format BibTex format (Mac & Win) |
Article Publishing History
| Received: | 2011-10-02 |
|---|---|
| Accepted: | 2011-11-18 |
Introduction
The high density of population and industries in the cities lead to allied vehicular, industrial and domestic emissions affecting, adversely the health and property of inhabiting citizens. Keeping the air quality acceptable has become an important task for decision makers as well as for non-governmental organizations. Particulate matter and gaseous emissions of pollutant emission from industries and auto exhausts are responsible for rising discomfort, increasing airway diseases and deterioration of artistic and cultural patrimony in urban centers. Emergence of remote sensing as a powerful technology for Mapping and modeling of pollution studies.Proper planning, management and monitoring of the pollution status depend on the availability of accurate information. The integration of data generated in the areas of etc. can lead to identification of pollution stress zones having unique combination of characteristics and hence specific suitability in terms of scientific methods to decrease the pollution load without compromising long term action plans for the environmental quality.In order to achieve the above-mentioned goal, a baseline environmental study has been conducted within the study area and interpreted with the help of GIS tools. GIS is best utilized for integration of various data sets to obtain a homogeneous composite land development units which helps in identifying the problem areas and suggest conservation measures. This study will set a new trend in the industrial sector with concern for sustainable development and clean environment.
Study Area
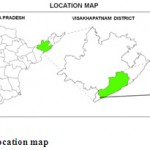
The study area is the part of the Visakhapatnam district, one of the nine coastal districts of Andhra Pradesh, is located in the north-eastern part of the State situated adjacent to the coast and where rapid development will take place in terms of industrialization. The study area is located between north latitudes 17° 19’ and 17° 46’”and east longitudes 82°35’ and 83°10’ and is covered in the survey of India topographical map numbers 56H65 K/10,11,13,14,15M 65 O/1 and O/2. The area is under influence for fast development of urban agglomeration and industrial growth with mega industries for petroleum, Pharma parks. The study area is covered in Narsipatnam and Visakhapatnam revenue divisions. The study area is situated along the coastline from Nakkapalli mandal to Paravada mandal where the future development for industrialization will take place. It also includes the Anakapalli, Kasimkota, Munagapaka, Achchutapuram, Rambilli, Elamanchili and S.Rayavaram Mandals. Out of 246 revenue villages, Anakapalle (Class-II) and Elamanchilli (Class-III) are the major towns in the study area. The study area is covered an area of 1314 Sq.Km.
 |
Figure 1: Location map Click here to View figure |
Study Objectives
- Preparation of thematic maps using survey of India toposheet and satellite imagery using visual interpretation Technique.
- Colleation of Air samples from air sampling stations analyze the samples as per the national ambient air quality standards (NAAQS), with respect to RSPM, TSPM, NOx,
- Collection of collateral data from different departments and creation of attribute data of thematic maps using GIS tools.
- Preparation of Air quality map.
- Identification of Air pollution sensitivity Map and Risk area map for pollution activities.
Methodology
Data Used
Different data products required for the study include the56H65 K/10,11,13,14,15M 65 O/1 and O/2 toposheets which are obtained from Survey of India (1:50,000) and fused data of IRS – 1D PAN and LISS-III satellite imagery from National Remote Sensing Centre (NRSC), Hyderabad.
Database Creation
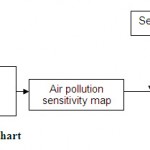
IRS-ID PAN and LISS-III satellite imageries are georeferenced using the ground control points with SOI toposheets as a reference and further merged to obtain a fused, high resolution (5.8m of PAN) and colored (R,G,B bands of LISS-III) output in EASI/PACE v6.3 Image processing software. The study area is then delineated from the fused data based on the latitude and longitude values and a final hard copy output prepared which is further interpreted visually for the generation of the matic maps. These thematic maps (Raster data) are converted to vector format by scanning using an A0-Flatbed Deskjet scanner and digitized in AUTOCAD 2000. The map is further edited in ARC/INFO and final hardcopy output is prepared using ARC/VIEW GIS software. The methodology adopted for creation of database is given in Fig. 2.
Spatial Database
Thematic maps like base map and drainage network maps are prepared from the SOI toposheets on 1:50,000 scale using AutoCAD and Arc/Info GIS software to obtain a baseline data. All the maps are scanned and digitized to generate a digital output was prepared using visual interpretation technique from the fused satellite imagery (IRS-ID PAN + LISS-III) and SOI toposheets along with ground truth analysis.
Attribute database
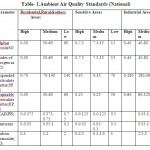
Fieldwork was conducted and Air samples were collected from predetermined locations based on the Landuse/Land cover map of the study area. The Air samples were then analyzed as per the national ambient air quality standards (NAAQS), with respect to RSPM, TSPM, NOx. The Air quality data thus obtained forms the attribute database for the present study (Table 1).
Integration of Spatial and Attribute Database
The spatial and the attribute database generated are integrated for the generation of Ground water pollution sensitivity map of selected Air quality parameters like RSPM, TSPM, NOx. The risks due to high density of population and industries in the cities leads to associate vehicular, domestic and industrial emissions affecting, adversely, the health and property of inhabiting citizens. The Air pollution sensitivity is determined based on the influencing factors of Aerial sensitivity, Dispersion Sensitivity, Air pollution Sensitivity, Air quality. The procedure involved is preparation of Air quality, Dispersion Sensitivity and Air pollution Sensitivity integrating them to arrive at the Air pollution sensitive zone map which depicts the areas of High-risk, zones Medium risk zones, and Low risk zones (CPCB, 1996). The procedure followed for integration of the theme maps to finally arrive at the Risk area map for Air polluting areas is given in the following flow chart.
 |
Figure 2: Methodology Flow chart Click here to View figure |
Results and Discussion
Base Map
A topographic map is a representation of the shape, size, position and relation of the physical features of an area (IMSD Technical Guidelines 1995). The base map is prepared using SOI toposheet on 1:50,000 scale and updated with the help of satellite imagery. It consists of various features like the road network, settlements, water bodies, canals, railway track, vegetation etc. delineated from the toposheet. The map thus drawn is scanned and digitized to get a digital output. The information content of this map is used as a baseline data to finalize the physical features of other thematic maps. Since the topo sheets are very old all the features like roads, railways, settlements etc are updated with the help of rectified and scaled satellite imageries of the area. The major settlements in the present study area are Nakkapalli, Elamanchilli, S. Rayavaram, Achchutapuram, Rambilli, Anakapalle, Munagapaka, Kasimkota, Paravada etc.
Drainage Network map
The drainage pattern in the study area is mostly dendritic to sub-dendritic patterns controlled by fracture. The drainage map network of the study area is taken from SOI topo sheets. All the rivers, tributaries and water bodies shown on the toposheet are considered for preparation of the drainage map. Further these water bodies are updated from the latest satellite imageries for delineating the water spread in the tanks, reservoirs and rivers.
Geomorphology
The main geomorphic units in the study area are Structural Hills, Pediment Inselberg Complex (PIC), Shallow weathered Pediplain (PPS), moderately weathered Pediplain (PPM) Coastal Plains and associated coastal land forms.
Air Quality Map
This map is prepared based on the ambient air quality data taken from State Pollution Control Board and analysis of samples collected from filed. The air quality map provides information about the status of ambient air quality. The ambient air quality is depicted as high, medium and low quality zones by describing the quantitative data in normative terms. ‘High’ air quality indicates that the level of concentration of pollutants in the ambient air quality is very well within standards and as such there is no air pollution problem. ‘Medium’ air quality indicates that the level of concentration of pollutants in the ambient air does not exceed the required standards but is very close to the standards. ‘Low’ air quality indicates that the level of concentration of pollutants exceeds the permissible limits prescribed and hence is polluted. The steps involved in the preparation of Air Quality Map are:
Located the sources of air pollution on the base map viz. Industries, Industrial estates, Industrial clusters etc. The collected ambient air quality monitoring data analysis of samples collected from filed and taken from APPCB with details of RSPM, TSPM, SOX, NOX.
Less than 50% of permissible limit is categorized as Low
50-100 % of permissible limit is categorized as Medium
> 100 % of permissible limit is categorized as High
The quality around industrial clusters at Paravada is under low due high air polluting industrial activities (NTPC, Visakha Steel Plant etc) up to Anakapalli and Quality is medium around Elamanchili due to Vehicular pollution.
 |
Table 1: Ambient Air Quality Standards (National) |
Dispersion Sensitivity Map
Dispersion sensitivity describes the ability of an area to disperse and dilute the air pollutants owing to its ventilating capacity, climate, vegetative cover and nature of the earth surface. Generally, micrometeorology doesn’t play a major role in determining the dispersion sensitivity. It is rather the climate that is more important in regional planning. The plain areas have very good circulation of air and hence dispersion is normal. Well-ventilated regions can have relatively wholesome air, even though the rate of pollution is high, whereas poorly ventilated areas deteriorate with only moderate rate of pollution:
The dispersion sensitivity map is prepared based on the Hypsography map. The dispersion sensitivity is categorized into ‘High’, ‘Medium’ and ‘Low’, AS per (CPCB, 1996) as under:
High
- Areas up to 4.5 H around isolated hills (H is the height of the hill);
- Up to 5 km from hill stretches (‘High’ Physiography areas) that act as barriers for dispersion of pollutants;
- Areas with frequent inversion conditions or having extreme climatic conditions.
Medium
- Areas falling with in a distance of 5 to 15 km from the hill stretches (‘High’ Physiography areas).
Low
- Areas beyond 15 km from the hill stretches (‘High’ Physiography area)
The Dispersion sensitivity map is prepared by buffering the ‘high’ Physiography zones as per the following guidelines:
In the study area only Isolated Hills were available, no Hill stretches, and Areas with frequent inversion conditions or having extreme climatic conditions are available.For isolated Hills the relative Height of the hills with respect to the near by area is calculated (not MSL). A buffer of 4.5 times the height of the hill, around isolated hills is considered and categorized as High sensitive area. The hill stretches are along the western portion of the study area having high and medium dispersion sensitive areas. Hillocks are spread all the study area having only high dispersion sensitive zones. West of Elamanchili and Anakapalli is covered with high dispersion due to hill ranges. These hill ranges are running parallel to the national highway towards west direction.
Aerial (Land Use) Sensitivity Map
The aerial (Land use) sensitivity of an area indicates the likely impacts on the receiving environment due to air pollution. The aerial sensitivity map is prepared based on the sensitive zone map and the air quality map.
The aerial (land use) sensitivity based on impact on the receiving environment is classified as High, Medium and Low risk zones. It is prepared using the buffering and overlay techniques of GIS. The coverage is prepared by taking the features such as Forests. National parks, Tribal settlements etc. from the Sensitive zone map. These features are copied from the Sensitive Zones map, buffer is created for each of the said features with a buffer distance of <2 km, 2-5 km and >5 km. For specific features such as National park, a buffer of 25 km is provided. (CPCB, 1996) The details of buffering are given below.
High-Risk Zones
- Up to 2 km to sensitive zones (forests, monuments and other legally restricted areas, socially sensitive areas such as scenic areas, religious places, hill resorts etc.).
- Areas having very low air quality (exceeding standards)
Medium risk zones
- Areas which are falling within a distance of 2 to 5 km from the sensitive zones; and
- Areas where the level of pollutants, although not exceeding, is close to the permissible standards i.e. areas having medium air quality.
This map has been generated by creating buffers for different sensitive zone classes such as monuments, forests etc. The majority of the area is covered with high aerial sensitivity due to forest and low air quality. A patch of medium aerial sensitivity is observed in and around Nakkapalli, Elamanchili, S.Rayavaram and Achutapuram villages and low aerial sensitivity towards south portion of S.Rayavaram and it is shown in Aerial sensitivity map.
Air Pollution Sensitivity Map
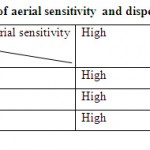
The air pollution sensitivity map is arrived at from integration of the aerial sensitivity map and dispersion sensitivity map. The overlay or decision matrix used for preparing this map guidelines is given below:
 |
Table 3: (Overlay of aerial sensitivity and |
The logic and the rationale behind the results of the matrix can be explained thus:
- Areas with ‘High’ aerial sensitivity will have ‘High’ air pollution sensitivity
irrespective of the dispersion sensitivity. - Areas with ‘High’ dispersion sensitivity will have ‘High’ air pollution
sensitivity irrespective of the aerial sensitivity. - Areas with ‘Low; aerial sensitivity and ‘Low’ dispersion sensitivity will definitely have ‘Low’ air pollution sensitivity.
- Areas where either of the two parameters i.e. the aerial sensitivity or dispersion sensitivity is ‘Medium’ and the other is ‘Low’ or when both parameters are ‘Medium’ will have ‘Medium’ air pollution sensitivity.
- This overlay is done using GIS package to arrive at the Air pollution sensitivity map.
- The Air pollution sensitivity map is prepared using the utilities of Geographic Information System like ‘overlay analysis’. Air pollution sensitivity is resultant overlay (union) coverage of aerial sensitivity and dispersion sensitivity map.
This map has been generated by using overlay analysis of Dispersion sensitivity and Aerial sensitivity maps. Due to high aerial and dispersion sensitivities in the study area the major portion is occupied with high air pollution sensitivity. The decision matrix is shown above for considering high, medium and low sensitive zones and it is shown in Air Pollution Sensitivity Map.
Risk Area Map for Air Polluting Activities
In the air pollution sensitivity map the areas of High, Medium and Low air pollution sensitivity are delineated without considering the ‘sensitive zones’ that are unsuitable for developmental activities due to legal restrictions, physical constraints etc. By eliminating the sensitive zones from the air pollution sensitivity map, the ‘High’ ‘Medium’ and ‘Low’ risk areas for air polluting activities are obtained in the ‘Risk area map for air polluting activities’ correspondingly from the areas of High, Medium and Low air pollution sensitivity.In the High-risk areas which are very sensitive to air pollution, only very small air polluting activities may be allowed. The Medium risk areas may be considered for medium polluting activities whose impact is not likely to exceed 2 km as per (CPCB, 1996). The Risk area map for air polluting activities is the union of the sensitive zones map and the air pollution sensitivity map. Only small patches of low risk for air pollution potential is available in the study area towards North West of Anakapalli. A big patches of medium risk for air pollution potential is observed in and around Anakapalli, Kasimkota, Elamanchili, S.Rayavaram, Achchutapuram.
References
- Horton, R.e. (1932). Drainage Basin Characteristics. Trans. Am. Geophys. Union, 13 : 350 – 361.
- Horton, R.E. (1945). Erosional Development of Streams and their Drainage Basins : Hydrophysical Approach to Quantitative Morphology. Geol. Soc. Am. Bull., 56 : 275 – 370.
- Nag, S.K. and Chakraborthy, S. (2003). Influence of Rock Types and Structures in the Development of Drainage Network in Hard Rock Area. J. Indian Soc. Remote Sensing, 31 (1) : 25-35.
- Srivastava, V.K. and Mitra, D. (1995). Study of Drainages Pattern of Raniganj Coalkfield (Burdwan District) as observed on Landsat – TM/IRS LISS II Imagery. J. Indian Soc. Remote Sensing, 23(4) : 225 – 235.
- Clarke, J.I. ( 1966). Morphometry from Maps. Eassys in Geomorphology . Elsevier Publ.Co., New York, pp.235-274.
- Central Pollution Control Board ( CPCB), 1996 - Zoning Atlas for siting of industries based on environmental considerations – EMAPS 1996-97, New Delhi.
- Barrow, Chris ( 1987) .Water resources and Agricultural Development in Tropics, Longman Scientific and Technical Publications, Essex, U.K.
- NRSA, ( 1995) . Integrated Mission for Sustainable Development , Technical guidelines , National Remote Sensing Agency, Department Of Space, 127 .
- NRSA (2000). Technical guidelines for preparation of Ground water prospect map, Rajiv Gandhi National Drinking Water Mission. National Remote Sensing Agency, Hyderabad.
- NRSA (1995). Integrated Mission for Sustainable Development (IMSD) – Technical guidelines, National Remote Sensing Agency, Hyderabad.
- Reddy, P.R., Balu Rao, P. & Prakash Gound, P.V. (1988) Evaluation of IRS – 1A data for Geological, Geomorphic and Groundwater Studies, Nat. Sem. On Indian Remote Sensing Satellite – 1A Mission and its Application Potential NRSA, Hyderabad.India.
- Central Pollution Control Board ( CPCB), 1996 - Zoning Atlas for siting of industries based on environmental considerations – EMAPS 199
- Anjaneyulu Y., Jayakumar, I, Madhav T., .H. Rao, T., “Online air pollution monitoring - Strategies for monitoring air pollution in Hyderabad” ICIPACT, 324- 328, 2001. 6-97, New Delhi.
- J.M. Baldasano, E. Valera, P. Jimenez (2003), Air quality data from large cities, The Science of the Total Environment 307, 141–165
- Jes Fenger (1999), Urban air quality, Atmospheric Environment 33, 4877}4900
- Karen Bickerstaff (2001) Public understandings of air pollution: the & localization of environmental risk, Global Environmental Change 11 (2001) 133}145
- Sharma, M., Maheshwari, M., Sengupta, B., and Shukla, B.P., 2003 “Design of a website for dissemination of air quality index in India”, Environmental Modeling & Software 18, 405 – 411.
- William. Bachman, Wayne. Sarasua,, Shauna. Hallmark., and Randall Guensler, (2000), Modeling regional mobile source emissions in a geographic information system framework Transportation Research Part C: Emerging Technologies Volume 8, Issues 1-6, Pages 205-229.


