Physico- Chemical Analysis of Well Water at Eloor Industrial Area- Seasonal Study
Divya Rani Thomas1 , B. Sunil2 and C. Latha2
1
Department of Veterinary Public Health,
College of Veterinary and Animal Sciences,
Mannuthy,
Thrissur,
680651
India
2
Kerala Veterinary and Animal Science University,
Kerala
India
http://dx.doi.org/10.12944/CWE.6.2.08
Seasonal variation on physico-chemical quality of well water at Eloor industrial area, Kerala was studied. A total of 100 samples, 25 each during four different seasons, viz. summer, pre- monsoon, monsoon and post monsoon were collected during the year 2009 and analyzed for temperature, pH, total hardness, Chemical Oxygen Demand, concentration of nitrate, fluoride, iron, heavy metals like lead, mercury, zinc, and cadmium. Significant difference between seasons was observed for temperature, Chemical Oxygen Demand, concentration of nitrate, zinc and cadmium. Highest temperature (28.96±0.16) was recorded during pre- monsoon. Chemical Oxygen Demand and zinc concentration was recorded maximum during summer (150.56±14.07, 0.21±0.04 mg/l respectively). Highest nitrate (5.96±1.10 mg/l) and cadmium (0.05±0.005 mg/l) concentrations were recorded during post monsoon and monsoon respectively The results were compared with WHO guidelines, 2006 and IS: 10500, 1991, desirable limits for drinking water and found that pH, total hardness, concentration of iron, lead and cadmium were not within the acceptable rage.
Copy the following to cite this article:
Thomas DR, Sunil B, Latha C. Physico- Chemical Analysis of Well Water at Eloor Industrial Area- Seasonal Study. Curr World Environ 2011:6;259-264 DOI:http://dx.doi.org/10.12944/CWE.6.2.08
Copy the following to cite this URL:
Thomas DR, Sunil B, Latha C. Physico- Chemical Analysis of Well Water at Eloor Industrial Area- Seasonal Study. Curr World Environ [serial online] 2011;6:259-264. Available from: http://www.cwejournal.org/?p=1368
Download article (pdf) Citation Manager Publish History
Introduction
Water is most essential for existence of life on earth and is a major component for all forms of lives, from micro-organism to man. Various physico- chemical parameters have a significant role in determining the potability of water. As per World Health Organization, safe and wholesome drinking water is a basic need for human development, health and well being, and it is an internationally accepted human right.1 Water intended for human consumption must be free from harmful microorganisms, toxic substances, excessive amount of minerals and organic matter. Over burden of the population pressure, unplanned urbanization, unrestricted exploration and dumping of the polluted water at inappropriate place enhance the infiltration of harmful compounds to the ground water.2 Application of fertilizers, prolonged discharge of industrial effluents, domestic sewage and solid waste dump also add to groundwater pollution, causing adverse health effects in human beings and animals. Quantitative parameters such as volume of water and qualitative parameters are affected also by climatic conditions, particularly temperature and precipitation which vary throughout the year. Considering these facts the study was conducted to assess the seasonal variation in physico- chemical quality of well water at Eloor industrial area, Kerala.
Materials and Methods
Study Area
Eloor, industrial hub of Kerala, is an island spread over an area of 14.21 km2, located in Ernakulam district, between north latitudes 9º 3´ and 10º 6´ and east longitudes 76º 20´ and 76º 28´. Soil of this area is sandy loam type. This area is well known for large and small-scale industrial units, which account for 25% of industries of the state. Major industrial units in the area include Fertilizers and Chemicals Travancore Limited (FACT), Hindustan Insecticides Limited (HIL), Indian Rare Earths Limited (IRE), Merchem Limited etc.
Wells were randomly selected for the study from the area which is falling within 1.5 km radius of industrial units. Samples were taken directly from wells in sterile glass bottles of 250 millilitre capacity, after rinsing the bottles three times with water. In order to collect the samples directly from well, bottle with a string attached to neck was used. Another long clean string was tied to the end of sterile string and the bottle was lowered into the water and allowed to fill up. Then the bottle was raised and stoppered. The collected samples were transported to laboratory in ice within an insulated container and analyzed within 24 hours of collection.
A total of 100 well water samples, 25 each during four different seasons of the year viz. summer (February), pre-monsoon (March-May), monsoon (June-September) and post monsoon (October-November) were collected during the year 2009 and analyzed for physical parameters like temperature and pH and chemical parameters like total hardness, Chemical Oxygen Demand (COD), concentration of nitrate, fluoride, iron and heavy metals like lead, mercury, zinc and cadmium. Study was carried out in such a way that, same 25 wells were sampled during four seasons.
Temperature and pH of each sample was measured using mercury filled glass thermometer and digital pH meter respectively.3 Total hardness of the samples was estimated using Total hardness test kit (Hi-media, India). Measurement of COD was made photometrically in Spectroquant NOVA 60 (Merck, Germany) after digesting the samples in preheated Thermoreactor TR 320 (Merck, Germany). Concentration of nitrate, fluoride, iron, lead and mercury in water samples was measured photometrically in Spectroquant NOVA 60 and expressed in mg/l.Estimation of zinc and cadmium was carried out using Atomic Absorption Spectrophotometer.4
Statistical Analysis
Analysis of variance (ANOVA) was done for comparing data5 using SPSS package (version 10).
Results and Discussion
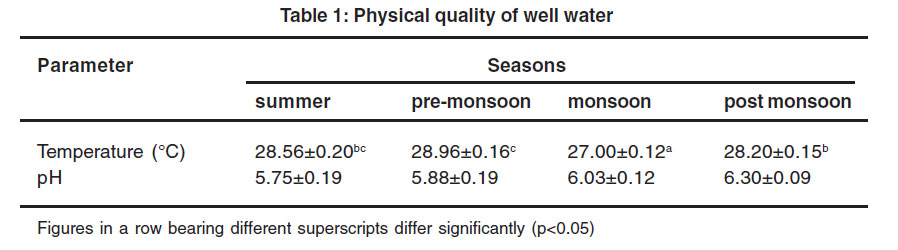
Results of analysis are shown in table 1 and 2. Temperature ranged from 27-28.96 oC. Lowest temperature was recorded during monsoon and highest temperature was recorded during pre- monsoon, which was in accordance with ambient temperature pattern.6,7,8
pH of well water was in the range of 5.75±0.19-6.30±0.09, and significant difference between seasons was not observed. pH is mainly influenced by volume of water,9 soil type,10 presence of chemicals and application of acidic fertilizers. Even though the soil type of Eloor is sandy loam, of higher pH,11 pH of well water was towards acidic side. It could be due to discharge industrial effluents, which of acidic pH12 to surface water bodies, which in turn percolate in to well water. Even in the absence of significant seasonal variation, pH was higher during monsoon and post monsoon and lower during summer and pre-monsoon seasons. The higher pH values during rainy season could be due to high photosynthesis of micro and macro vegetation resulting in production of high CO2, shifting the equilibrium towards alkaline side.13 This could be attributed to the presence of luxuriant vegetation inside most of the wells during rainy season. Acid pH of water may be due to dissolved carbon dioxide and organic acids such as fulvic and humic acids which are derived from decay and subsequent leaching of plant materials.14 During dry seasons there may be death and decay of plants due to lack of sufficient water which increases the organic acid content of water in turn causing acidity. In addition great reduction in water volume in the wells also decreases the pH during dry season.9 Acceptable range of pH for drinking water is 6.5-8.5.15 In the present study, pH was not within this limit. Low pH of groundwater can cause gastrointestinal disorders especially hyperacidity, ulcers and burning sensation.16 Water having pH below 6.5, causes corrosion of metal pipes, resulting in the release of toxic metals such as zinc, lead, cadmium, copper etc. Higher values of pH hasten scale formation in water heating apparatus and decrease germicidal potential of chlorine.
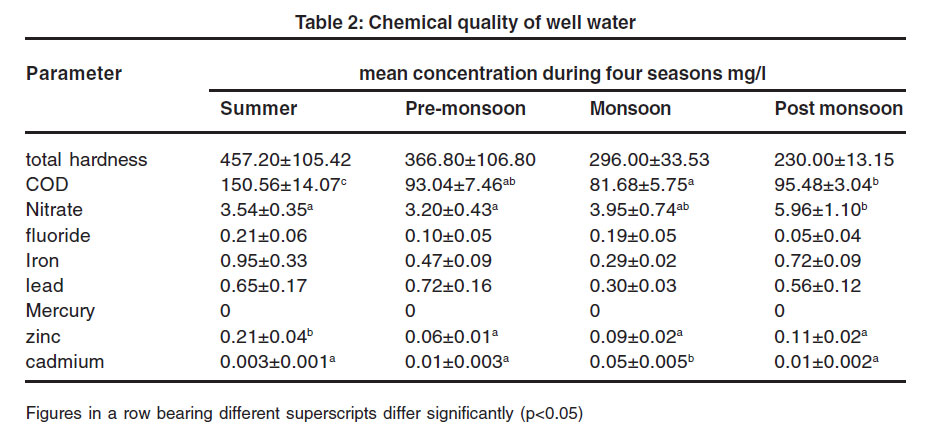
Total hardness was in the range of 230.00±13.15 - 457.20±105.42 mg/l, with no significant seasonal variation. Higher total hardness could be due to discharge of effluents and untreated waste17 from polluting industries to nearby surface water sources. Highest value of total hardness was observed during summer. It could be due to the low water level and high rate of evaporation during summer.18 Bureau of Indian Standards desirable limit for total hardness in drinking water is 300 mg/l.15 Well water from Eloor had total hardness above this limit during summer and pre- monsoon. Hardness prevents lather formation with soap and increases the boiling point of water. Normally water hardness does not cause any direct health problems, but may cause economic problems. Hardness below 300 mg/l is considered potable but beyond this limit produces gastrointestinal irritation. Extremely hard water may lead to increased incidences of urolithiasis.
COD ranged from 81.68±5.75 to 150.56±14.07, and showed significant difference between seasons. Lowest and highest values were observed during monsoon and summer respectively. Higher values of COD indicate the presence of oxidizable organic matter.19 The entry of sewage water, industrial effluents and the agricultural runoff might be responsible for increased level oxidizable organic matter.18 The higher COD could be due to death and decay of plants and subsequent increase in organic matter during summer.13 The lower COD observed during monsoon could be due to the effect of dilution.
 |
Table 1: Physical Quality of Well Water Click here to View table |
 |
Table 2: Chemical Quality of Well Water Click here to View table |
Mean nitrate concentration of well water was in the range of 3.20±0.43- 5.96±1 mg/l, which were within WHO guidelines (2006) for nitrate in drinking water (50 mg/l)20 and Bureau of Indian Standards desirable limit (45 mg/l).15 Usually nitrate is not present in pure water. However, nitrate detected in well water samples might have originated from decaying organic matter,21 discharge of sewage and industrial wastes and runoff from agricultural fields containing nitrate fertilizers.22 Mean nitrate concentration was lowest during pre- monsoon and highest during post monsoon. The highest concentration during post monsoon might be due to application of nitrogenous fertilizers to agricultural land during rainy season and subsequent seepage through soil. Nitrate in drinking water as such are not toxic to health and about 85 per cent of ingested nitrate are rapidly adsorbed from gastrointestinal tract and excreted by kidney. When nitrates are converted to nitrites, toxic effects are encountered and may cause potential health hazards. Higher level of nitrate may cause methaemoglobinemia or blue- baby syndrome in infants. It may react with creatinine present in vertebrate muscles to form nitrosarcosine which is carcinogenic.23
Mean fluoride concentration of well water was in the range of 0.05±0.04- 0.21±0.06 mg/ l and showed no significant difference between seasons. The values were within WHO guidelines, 2006 for fluoride in drinking water (1.5 mg/l) and IS: 10500, 1991, desirable limit (1 mg/l). Detectable level of fluoride was present in wells located near to FACT. Fluoride is released into air in gaseous state and in particulate matter from factories producing phosphatic fertilizers.24 This might cause contamination of soil, water and forage not only in the vicinity of the plant, but several kilometres from the factory.25 FACT in Eloor was such a unit, manufacturing phosphatic fertilizers. Gypsum produced in the factory as a by product during the manufacturing of fertilizers, contains fluoride.12 This could be one of the sources of fluoride in well waters of Eloor. Significant seasonal difference was not observed in fluoride concentration which could be attributed to continuous industrial activities. From the first hand information from the people, it was understood that gypsum was accumulated in the factory premises. This favoured leaching during monsoon season increasing the concentration in well water during monsoon. A small amount of fluoride is beneficial for human health to prevent dental caries. However when consumed in higher doses (>1.5 mg/l) it leads to dental fluorosis and excessively high concentration (>3 mg/l) may lead to skeletal fluorosis. Crippling skeletal fluorosis can occur in water supply containing more than 10 mg/l of fluoride. During the survey, it was understood that 6.9 per cent animals were having lameness. This could be attributed to fluoride toxicity through ingestion of contaminated water and forage.
Mean iron concentration ranged between 0.29±0.02 and 0.95±0.33mg/l. The value was within the desirable limit (0.3mg/l) (IS: 10500, 1991), only during monsoon season. Higher iron content observed in Eloor might be due to the influence of industrial units, discharging iron containing waste products. Analysis of waste products12 generated by HIL, Merchem Limited and FACT showed that significant amount of iron is generated by these industrial units. These industries discharge their waste products into nearby surface water bodies which ultimately leads to ground water contamination. Some of the people complained that their water often gets red colour and taste of rust. Significant difference between mean iron concentrations of four seasons could not be observed. However, iron concentration was highest during summer (0.95±0.33 mg/l) and lowest during monsoon (0.29±0.02 mg/l). Higher level of iron in groundwater during summer might be due to concentration effect.26 Toxic effect due to exposure to iron leads to abdominal discomfort, lethargy and fatigue. Liver is the major site of iron storage. Excess iron deposition leads to shrinkage of liver, followed by fibrosis and cirrhosis. Ingestion accounts for most of the toxic effect of iron because iron is absorbed rapidly in gastrointestinal tract.
Mean lead concentration was in the range of 0.30±0.03- 0.72±0.16 mg/l, and was above WHO guidelines, 2006 (0.01 mg/l) and IS: 10500, 1991 (0.05 mg/l) for lead in drinking water. Eloor being an industrial area is subjected to the discharge of effluent containing lead to nearby water bodies. Analysis of waste products12 generated by HIL, Merchem Limited and FACT showed that significant amount of lead is generated by these industrial units in their waste products. The effluents rich in lead are discharged to water bodies nearby and subsequently affect the groundwater quality of the area. Even though there was no significant seasonal variation, monsoon samples showed lowest concentration and pre-monsoon season showed highest concentration. In Eloor, water bodies were exposed to continuous discharge of effluents irrespective of season. This may be the reason for lack of significant seasonal variation. Combined effect of decreased amount of water and slight leaching during pre-monsoon shower might have contributed to higher lead concentration during pre-monsoon. Lowest lead concentration observed during monsoon season could be attributed to dilution. Exposure to lead is cumulating over time. High concentration of lead in body can cause death or permanent damage to central nervous system and kidneys. This damage commonly result in behaviour and learning problems, memory and concentration problems, high blood pressure, hearing problem, headache, reproductive problem, digestive problems, muscle and joint pain. Lead poisoning stunts a child’s growth, damages the nervous system and cause learning disabilities. It was noted that a school for mentally retarded children is functioning in the panchayath. In animals lead poisoning causes neurological signs preceded or accompanied by gastrointestinal malfunctions. Death of cattle, following nervous signs as reported by one farmer might be attributed to lead poisoning. Abortion in cattle at 5 to 6 month of gestation was also reported by some farmers suggestive of lead toxicity.27 Gastroenteritis is also associated with lead toxicity due to the caustic action of lead on alimentary mucosa.26
Throughout the study no mercury could be detected in well water samples.
Mean zinc concentration was in the range of 0.06±0.01- 0.21±0.04 mf/l, and was within the limit of 5 mg/l as prescribed by Bureau of Indian Standards (IS: 10500, 1991). Analysis of waste products generated by HIL, Merchem Limited and FACT was conducted by environment impact assessment on Eloor- Edayar Industrial Belt.12 The analysis report pointed out that significant amount of zinc is generated by these industrial units, which inturn deteriorate the ground water quality. The concentration was highest during summer season. During summer, depletion of water leads to greater concentration of metals.26
Mean cadmium concentration varied from 0.003±0.001- 0.05±0.005 mg/l, and showed significant difference between seasons. Analysis of waste products generated by Hindustan Insecticides Limited (HIL), Merchem Limited and Fertilizers and Chemicals Travancore Limited (FACT) was conducted by Environment Impact Assessment on Eloor- Edayar Industrial Belt,12 and found that these industries discharged some amount of cadmium in their waste products, deteriorating the groundwater quality. Cadmium concentration was found to be highest during monsoon, which might be due to leaching during monsoon. It was found that mean cadmium concentration s exceeding the WHO guideline (0.003 mg/l) during pre- monsoon, monsoon and post monsoon and IS: 10500, 1991 (0.01 mg/l) desirable limit during monsoon. Cadmium is bio accumulative and persistent in the environment. Cadmium has no biochemical and nutritional function and is highly toxic to human being, plants and animals. In human beings and animals cadmium causes kidney damage. In lower doses cadmium can produce coughing, headache and vomiting. In larger doses cadmium can accumulate in liver and kidneys and can replace calcium in bones, leading to painful bone disorders and renal failure. Kidney is considered to be the critical target organ in humans chronically exposed to cadmium by ingestion.
Ground water quality in the study area showed seasonal variation for temperature, COD, concentration of nitrate, zinc and cadmium, and exceeded the limits, WHO guidelines and IS: 10500, 1991. In order to improve quality of groundwater and to protect people and animals from the perils of groundwater contamination, it is essential to initiate measures to check the pollution from industrial effluents through strict enforcement of legislation for industries. Regular groundwater quality monitoring network stations should be established. Replacement of damaged pipelines and lining of sewer drains is necessary to prevent the leakage of sewage in pipes and seepage through unlined channels and prevent the mixing of sewage with groundwater. Education of public on safe handling and use of drinking water is also recommended.
References
1. WHO. 2001. Water Health And Human Rights, World Water Day 2001 [online]. Available: htt p: //ww w. worldwaterday.org /thematic/ hmnrights. Html #n4 [10 April 2010].
2. Pandey, Sandeep K, Tiwari, S.: Nature and Sci..7: 17 (2009).
3. Chapman, D. and Kimstach, V. Selection of water quality variables. In: Chapman, D. (ed.), Water Quality Assessment – A Guide to Use of Biota, Sediments and Water in Environmental Monitoring –World Health Organization. (1996).
4. Lokeshwari, H. and Chandrappa, G.T.: J. Environ. Sci. Engng. 48: 183 (2006).
5. Snedecor, G.W. and Cochran, W.G. Statistical Methods. The Iowa State University Press, Ames, Iowa, U.S.A. 564 (1994).
6. Kaplay, R. D. and Patode, H. S. Environ. Geol. 46: 871 (2004).
7. Agbaire, P. O. and Obi, C. E.: J. Appl. Sci. Environ. Manage. 13: 55 (2009).
8. John, N. and Thanga, V. S. G. In: Yesodharan, E. P. (ed.), Proceedings of the Twentysecond Kerala Science Congress; Peechi. Kerala State Council for Science, Technology and Environment, Government of Kerala. pp. 577(2010).
9. Mahasim, N. W., Saat, A., Hamzah, Z., Sohari, R. R. and Khali, K. H. A. Presented at SKAM 18, 12-14 September, 2005, Johr Bharu. (2005).
10. CESS. 1984. Resource atlas of Kerala, Centre for Earth Science Studies, Thiruvananthapuram, Kerala.
11. Malik, R. N., Husain, S. Z. And Nazir, A. I.: Pak. J. Bot. 42: 291 (2010).
12. Local Area Environment Committee. Report submitted to Supreme Court Monitoring Committee.114 (2006).
13. Kumar, K. K. S., Hakeem, A. A. A. and Kumar, S. S.: In: Yesodharan, E. P. (ed.), Proceedings of the Twentysecond Kerala Science Congress; Kerala State Council for Science, Technology and Environment, Government of Kerala. (2010).
14. Langmuir, D. Aqueous Environmental Chemistry, Prentice-Hall. Inc., New Jersey, 600 (1997).
15. BIS. 1992. Drinking water specifications IS: 10500: 1991, First revision, Bureau of Indian Standards. India.
16. Laluraj, C. M. and Gopinath, G. Environ. Monit. Assess. 117: 45: (2006).
17. Ullah, R., Malik, R. N. and Quadir, A. Afr. J. Environ. Sci. Technol. 3: 429 (2009).
18. Sisodia and Moundiotiya, C.: J. Environ. Hydrol. 14: 23 (2006).
19. Garge, S. K. Sewage disposal and air pollution engineering. Khanna Publications. pp. 188 (1998).
20. WHO. 2006. Guidelines for drinking water quality. World Health Organization, Geneva.
21. Subrahmanyam, K. and Yadaiah, P. Hydrogeol. J. 9: 297 (2001).
22. Kumar, S., Gupta, R. K. and Gorai, A.C.: Asian J. Exp. Sci. 22:161 (2008).
23. Simmons, I.G.. The Ecology of Natural Resources. Edward Arnold Publishers Limited, London. 586 (1974).
24. Sharma, R. and Parvez, S. J. Scient. Ind. Res. 3: 985 (2004).
25. Radostits, C. M., Gay, C. C., Hinchcliff, K. W. and Constable, P. D. Veterinary Medicine. A Text Book of the Diseases of Cattle, Horses, Sheep, Pigs and Goats.. Elsevier, Noida, 2156 (2007).
26. Buragohain, M., Bhuyan, B. and Sarma, H. P. Environ. Monit. Assess. (2009).
27. Sandhu, H. S. and Brar, R. S. Text book of Veterinary Toxicology. Kalyani Publishers, New Delhi, 327 (2000).


