Spatial distribution of ground water quality in some selected parts of Pune city, Maharashtra, India using GIS
Suvarna Tikle1 * , M. J. Saboori2 and R. Sankpal2
1
EME, Division, Mitcon Consultancy and Engineering Services ltd.,
Pune,
411 005
India
2
Department of Environmental Science,
University of Pune,
Pune,
411 007
India
DOI: http://dx.doi.org/10.12944/CWE.7.2.13
Copy the following to cite this article:
Tikle S, Saboori M.J, Sankpal R. Spatial Distribution of Ground water Quality in Some Selected parts of Pune city, Maharashtra, India using GIS. Curr World Environ 2012;7(2):281-286 DOI:http://dx.doi.org/10.12944/CWE.7.2.13
Copy the following to cite this URL:
Tikle S, Saboori M.J, Sankpal R. Spatial Distribution of Ground water Quality in Some Selected parts of Pune city, Maharashtra, India using GIS. Curr World Environ 2012;7(2):281-286. Available from: http://www.cwejournal.org/?p=2875
Download article (pdf) Citation Manager Publish History
Select type of program for download
| Endnote EndNote format (Mac & Win) | |
| Reference Manager Ris format (Win only) | |
| Procite Ris format (Win only) | |
| Medlars Format | |
| RefWorks Format RefWorks format (Mac & Win) | |
| BibTex Format BibTex format (Mac & Win) |
Article Publishing History
| Received: | 2012-07-12 |
|---|---|
| Accepted: | 2012-09-17 |
Groundwater resources are dynamic in nature. These are affected by factors such as, the expansion of irrigation activities, industrialization and urbanization. Hence, monitoring and conserving this important resource is essential. The quality of water is defined in terms of its physical, chemical and biological parameters. Ascertaining the quality of groundwater is crucial before its use. Water may be used for various purposes such as drinking, agricultural, recreational and industrial activities.3,4 Groundwater assessment has been based on laboratory investigation, but the advent of Satellite Technology and Geographical Information System (GIS) has made it very easy to integrate various databases.5
Material and Methods
The study area includes Aundh, Baner, Pashan and Sutarvadi. The Base map of study area was drawn from Survey of India topographic map no. Toposheets 41F/14. The bore well locations were identified. The samples were collected from 29 boreholes from selected locations. As part of the study, groundwater samples were collected from 29 bore wells. The samples collected during December 2011 were analyzed for various physico-chemical parameters. Physico-chemical analysis was carried out as per the standard procedures prescribed by American Public Health Association (APHA), to determine Electrical Conductivity (EC), Total Dissolved Solids (TDS), Total Hardness (TH) , pH, HCO3-, Mg2+, Ca2+, K+, Na+, Cl-, SO42-, NO3- and F-. The results were compared with standard values recommended by World Health Organization WHO (2006 and 2008) guidelines for drinking water quality.
GIS technology proved to be very useful for enhancing the accuracy. We obtained the location of the well by using the GPS and Arc GIS software. The IDW was applied to find out the spatial distribution of groundwater quality. In interpolation with the spatial analyst method of IDW, a weight is attributed to the point to be measured. The amount of this weight is dependent on the distance of the point to another unknown point.6 These weights are controlled on the bases of power of ten. With increase of power of ten, the effect of the points that are farther diminishes. Lesser power distributes the weights more uniformly between neighboring points. In this method the distance between the points count, so the points of equal distance have equal weights.7 The advantage of IDW is that it is intuitive and efficient. This interpolation works best with evenly distributed points. Similar to the SPLINE functions, IDW is sensitive to outliers. Furthermore, unevenly distributed data clusters result in introduced errors.6
Results and Discussion
Understanding the groundwater quality is important as it is the main factor determining its suitability for drinking use.8 The groundwater quality maps were prepared for each selected parameter.
Electrical Conductivity (EC)
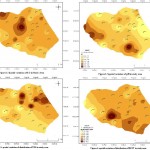
The importance of EC is its measure of salinity; which greatly affects the taste. Thus EC has a significant impact on determining the potability of water.9 The EC of water at 25°C is due to the presence of various dissolved salts. The EC varies with water sample and ranges between 469.2μS/cm and 1173μS/cm with an average of 800μS/cm. Knowing that the maximum limit of EC for drinking water is prescribed as 1,500μS/cm at 25°C, all the values are within the permissible limit. Figure 1 shows the spatial distribution of EC in the study area.
pH
In general, pH is the measure of acidity or alkalinity of water. It is one of the most important operational water quality parameters with the optimum pH required often being in the range of 7.0-8.5.10 The maximum permissible limit for pH for drinking water as given by the WHO is 9.2. The pH values in the groundwater samples collected varied from 7.05 to 7.76 with an average value of 7.27. This shows that groundwater of the study area is mainly neutral to slightly alkaline in nature. Spatial distributions of pH concentrations are shown in Figure 2. The values of pH show that all of the samples displayed a pH value within the maximum permissible limit.
Total Dissolved Solids (TDS)
TDS in water are represented by the weight of residue left when a water sample has been evaporated to dryness WHO (2006). TDS are compounds of inorganic salts (principally Ca, Mg, K, Na, HCO3-, Chlorides and SO42-) and of small amounts of organic matter that are dissolved in water. The TDS amount ranges between 50mg/l to 650mg/l with an average of 367 mg/l. In this study, 3 samples (BW7, BW12 and BW18) showed the concentration of TDS exceeds the permissible limits. Figure 3 shows the spatial distribution of TDS in the study area.
Carbonates and Bi-Carbonates
With respect to HCO3-96.5 % of the sampling stations are exceeding the permissible limit set by the WHO (2006) Guidelines for drinking water limit of 240mg/l. The values of HCO3- range between minimum 196 mg/l to maximum 855 mg/l with an average of 423 mg/l. Figure 4 shows the spatial distribution of HCO3-.
Calcium(Ca) And Magnesium (Mg)
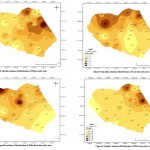
Ca and Mg are from natural sources like granitic terrain which contain large concentration of these elements. The result shows that Mg is exceeding the permissible limit of 30mg/l in more than 82% of the sampling stations, while Ca is within the permissible limits of 75 mg/l except one station (BW 15) where it is exceeding the permissible limit. Ca and Mg are ions of total hardness and hence they are interrelated. The values of Mg varies from 12 mg/l to maximum 125 mg/l with an average of 50 mg/l while the minimum value of Ca is 6 mg/l and maximum 80 mg/l with an average of 34 mg/l. Spatial distribution of Mg and Ca in the study area are represented in figures 5 and 6.
 |
Figure 1: Spatial variation of EC in study area Figure 2: Spatial variation of pH in study area Figure 3: Spatial variation of distribution of TDS in study area Figure 4: Spatial variation of distribution of HCO3- in study area Click here to View figure |
 |
Figure 5: Spatial variation of distribution of Mg in study area Figure 6: Spatial variation of distribution of Ca in study area Figure 7: Spatial variation of distribution of Chloride in the study area Figure 8: Spatial variation of distribution of TH in the study area Click here to View figure |
 |
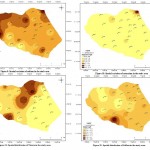
Figure 9: Spatial variation of distribution of sodium in study area Figure 10: Spatial variation of distribution of potassium in study area Figure 11: Spatial variation of distribution of Nitrate in the study area Figure 12: Spatial variation of distribution of Sulfate in study area Click here to View figure |
 |
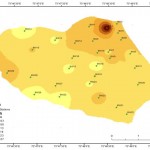
Figure 13: Spatial Fluoride distribution in the study area Click here to View figure |
Chloride (Cl)
Chloride occurs naturally in all types of water. Chloride in natural water may results from agricultural activities, industries and chloride rich rocks. The results obtained shows that all the sampling stations are well within the permissible limit of 250 mg/l guided by WHO (2008) guidelines for drinking water quality. The values vary from 21 mg/l minimum to 87 mg/l maximum with an average of 43 mg/l. Spatial distribution of Chloride concentration in the study area is shown in figure 7.
Total Hardness (TH)
The TH is an important parameter of water quality whether it is to be used for domestic, industrial or agricultural purposes. It is due to the presence of excess of Ca, Mg and Fe salts. The carbonate and bicarbonate concentrations are useful to determine the temporary hardness and alkalinity. Since the analysis of carbonate in this study has given negative results for most of the samples, the alkalinity is mainly due to bicarbonates. Figure 8 indicates the TH obtained shows that 25% of the samples are exceeding the permissible limit of 200 mg/l set by WHO (2008). The values vary from minimum 116 mg/l to maximum 590 mg/l with an average of 292 mg/l.
Sodium (Na) and Potassium (K)
Na and K are the most important minerals occurring naturally. The major source of both the cations may be weathering of rocks11 besides the sewage and industrial effluents. Their values of study area show that both Na and K are well within the permissible limits. The values varies from minimum 45mg/l to maximum 77 mg/l with an average of 62 mg/l and 0.188 mg/l minimum to 10.73 mg/l maximum with an average of 0.88 mg/l respectively. Figure 9 and 10 shows the spatial variation of Na and K in the study area respectively.
Nitrate (NO3-)
The high nitrogen content is an indicator of organic pollution. It may results from the added nitrogenous fertilizers, decay of dead plants and animals, animal urine, or feces. They are all oxidized to nitrate by natural process and hence nitrogen is present in the form of nitrate. The increase in one or all the above factors is responsible for the increase of nitrate content.12 The ground water contamination is due to the leaching of nitrate present on the surface with percolating water. Figure 11 shows the spatial distribution of Nitrate in the study area. The values of nitrate in the study area vary from minimum 1.858 mg/l to 111 mg/l maximum with an average of 31 mg/l. The results show that 21% of the sampling stations are exceeding the permissible limit of 50 mg/l guided by WHO (2008).
Sulphate (SO42-)
Sulphate is found in small quantities in ground water. Sulphate may come into ground water by industrial or anthropogenic additions in the form of Sulphate fertilizers. The results show that the values from the study area are all within the permissible limit of 250 mg/l guided by WHO (2008) for drinking water purpose. The values of sulfate ranges from 73 mg/l minimum to 77 mg/l maximum with an average of 74 mg/l (Figure 12).
Fluoride (F)
Fluoride occurs as fluorspar (fluorite), rock phosphate, triphite, phosphorite crystals etc. in nature. The factors which control the fluoride concentration includes the climate of the area and the presence of accessory minerals in the rock mineral assemblage through which the ground water is circulating.13 In the present study the concentration of fluoride is within the permissible limits of WHO (2008). They range from 1.094 mg/l minimum to maximum 1.128 mg/l with average of 1.1029 mg/l. from the results obtained it can be noticed that the values of fluoride are exceeding the desirable limit of 1 mg/l. with the increase anthropogenic activities the concentration of fluoride may have an increasing trend, as Bhosle et al., 200114 has noted that the discharge of domestic wastes from the surrounding industries increases fluoride values. Fluoride distribution in the study area is shown in figure 13.
Conclusion
Spatial variations in ground water quality in the study area were studied successfully by using geographic information system (GIS). The results obtained in this case study and the spatial database established in GIS shows the same approach can be used for determining, monitoring and managing ground water quality and its pollution for wide areas. The database formed can be very useful for future research and reference.
Acknowledgements
Authors sincerely acknowledge support provided by GSDA pune.
References
- WHO, Guidelines of drinking water quality Recommendation: the 3rd edition. Geneva: World Health Organisation. Vol. II, 2006.
- APHA.Standard methods for examination of water and waste water, 19th Edition. Washington, DC:American Public Health Association, 1995.
- Khan, F., Husain T., and Lumb A., Environmental Monitoring and Assessment, (88): 221-242. 2003. http://dx.doi.org/10.1023/A:1025573108513
- Sargaonkar, A. and V. Deshpande, Environmental Monitoring and Assessment, (89): 43-67., 2003. http://dx.doi.org/10.1023/A:1025886025137
- MounaKetata-Rokbani, MoncefGueddari and RachidaBouhlila, Iranica Journal of Energy & Environment 2 (2): 133-144, 2011.
- Balakrishnan P., Abdul Saleem and Mallikarjun, N. D., African Journal of Environmental Science and Technology, Vol. 5(12), pp. 1069-1084, December 2011
- Burrough PA, McDonnell RA, Principles of Geographical Information Systems Oxford: Oxford University Press, p. 333. (1998)
- Sivasankar, K., Gomathi, R. Water Quality Exposure Health,Vol. 1, pp. 123–134., 2009. http://dx.doi.org/10.1007/s12403-009-0008-5
- Pradeep Jain, K., Poll. Res. 17(1), 91–94., 1998
- Dahyia, S., Datta, D., Kushwaha, H. S., Environmental Geology, Vol. 8, pp. 158–165, 2005
- Singh, T. B., IndhuBala and D. Singh, Poll. Res. 18(1), 111–114., :1999
- Rahman:,‘Groundwater quality of Oman’, Groundwater Quality, London, pp. 122–128, 2002
- Handa BK, Ground Water 13:275–28, (1975). http://dx.doi.org/10.1111/j.1745-6584.1975.tb03086.x
- Bhosle, A. B., Narkhede, R. K., BalajiRao and Patil, P. M., Eco. Env.&Conserv.7(3), 341–344, 2001


