Document on fluoride accumulation in ground and surface water of Mysore, Karnataka, India
S. V Mamatha1 and Devendra J. Haware1
1
Food Safety and Analytical Quality Control Laboratory,
CSIR-Central Food Technological Research Institute,
Mysore,
570020
India
DOI: http://dx.doi.org/10.12944/CWE.8.2.11
Copy the following to cite this article:
Mamatha S.V, Devendra J. H. Document on fluoride accumulation in ground and surface water of Mysore, Karnataka, India. Curr World Environ 2013;8(2) DOI:http://dx.doi.org/10.12944/CWE.8.2.11
Copy the following to cite this URL:
Mamatha S.V, Devendra J. H. Document on fluoride accumulation in ground and surface water of Mysore, Karnataka, India. Curr World Environ 2013;8(2). Available from: http://www.cwejournal.org/?p=4374
Download article (pdf) Citation Manager Publish History
Select type of program for download
| Endnote EndNote format (Mac & Win) | |
| Reference Manager Ris format (Win only) | |
| Procite Ris format (Win only) | |
| Medlars Format | |
| RefWorks Format RefWorks format (Mac & Win) | |
| BibTex Format BibTex format (Mac & Win) |
Article Publishing History
| Received: | 2013-04-18 |
|---|---|
| Accepted: | 2013-06-07 |
Mysore covers the geographical area of 6763.82 Sq Km. The district comprises of 1203 inhabited villages with 236 grama panchayats and 9 townships. Mysore is divided into 7 taluks namely H.D Kote, Hunsur, K.R.Nagar, Mysore city, Nanjangud, Periyapatna and T. Narasipura. Mysore district fall in the survey of India degree sheet nos. 48P, 57H and 58A. The district is situated between north Latitudes 11°45' – 12°40' and east Longitudes 75°59' -77°5' covering an area of 6269 Sq.km. The district is one of the southern most districts of the Karnataka state and is borderd by kodagu district in the west, Cannanore district of Kerala state in the south west, Chamarajanagar district in the south and south east, Mandya district in the north and Hassan district in the north west.There are 5 perennial rivers in the district namely Cauvery, Kabini, Nugu, Gundal and Lakshmanathirtha which are the major source for drinking and irrigation purpose .1 Groundwater is the only source for drinking water in rural areas due to the lack of water supply facility from surface water sources. Natural water is supplied only in the city limit and in some taluks, yet not extended to the nearby villages. The purity of water cannot be judged by visibility and odour of water sample and even visibly pure water can contain some toxic metals, pesticide residues, and high levels of nitrate, chloride and fluoride. Fluoride has a negative effect on human health below 0.5ppm and above 1.0ppm whereas in the range of 0.5-1ppm, it shows a positive effect. Fluoride is the key aspect of water quality in water supply system. Fluoride has shown to cause a significant effect on human health. A correct proportion of fluoride has a beneficial role in the formation of teeth.2 Too low concentration (<0.5ppm) of fluoride intake may be insufficient for preventing dental caries in the early ages of children.3,4,5 High concentration of fluoride exceeding 1.5 ppm leads to teeth mottling viz dental fluorosis.6
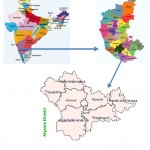 |
Figure 1: Location of Mysore District, India. Click here to View figure |
Excess of fluoride in drinking water above 4 ppm causes chronic skeletal fluorosis which causes stiffness in joints, increase in bone mass and osteoporosis in the old ages. In extreme cases, paralysis and premature aging may happen. Recent research has shown chronic fluoride toxicity can cause adverse health effects such as increase lipid peroxidation and myocardial damage.7,8 Fluoride can also damage the fetus, if the mother consumes water and food, with high concentrations of fluoride during pregnancy.9 The amount of fluoride in water is governed by climate, composition of rocks and hydrogeology.10 Accumulation of fluoride in ground water is due to the presence of minerals fluorspar, fluorapalite, topaz and cryolite.11 Higher concentrations of fluorine are present in alkaline volcanic, hydrothermal, sedimentary, and other rocks derived from evolved magmas and hydrothermal solutions.12 In processed food and beverages, fluoride can come from pesticides (like Trifluralin, Benefin), Cryolite (a naturally occurring inorganic substance), Sodium Fluoride (used as rodenticide) and Superphosphate fertilizer. Mishra et al., (2009) have conducted a study on fluoride content in plant leaf, rice crop showing the concentration upto 12.6ppm and 43.9ppm respectively.13 The excess accumulation of fluoride in vegetation leads to visible leaf injury, damage to fruits and less yield.14 Dry tea leaves have significantly high levels of fluoride of upto 400 ppm.15 In one study, it was shown that 37% of the fluoride in Black tea remains in oral cavity. Soil also showed different amounts of fluoride, as it is adsorbed to soil particles. Fluoride has an adequate sensitivity to cycle in the environment including plants, animals and human beings thereby causing toxicity.16 Fluoride is also absorbed by plants as the water is also used for irrigation. Thus fluoride can even enter food chain causing higher concentration of fluoride in food materials. Therefore, in the present study, the level of fluoride in various water bodies in Mysore district were determined to identify the areas with higher fluoride contamination.
Materials and Method
A total of 130 samples of 500ml water were collected from different locations of Mysore district in clean PET bottles after rinsing with same water. The sampling points were hand pumps, open wells, tube wells, rivers, canals, ponds and lakes. The water samples were analyzed by Zirconyl- SPADNS Method.17 The SPADNS colorimetric method is based on the reaction between fluoride and a zirconium dye lake. Fluoride reacts with the dye lake, dissociating a portion of it into a colorless complex anion (ZrF62-); and the dye. As the amount of fluoride increases, the color produced becomes progressively lighter. The reaction rate between fluoride and zirconium ions is influenced greatly by the acidity of the reaction mixture. If the proportion of acid in the reagent is increased, the reaction can be made almost instantaneous. For better results, it is necessary to maintain a constant temperature throughout the color development period.18
Procedure
The sample (50 ml) was taken in a flask and 5ml each of zirconyl-acid reagent and SPADNS solution were added. Preparation of calibration curve from standard fluoride solutions of concentrations 0.5, 1.0, 1.5, 2.0, 2.5 and 3.0 ppm was done. Readings of water samples were taken at 570 nm (UV-Visible Spectrophotometer, UV-1601, Shimadzu, Japan) after setting absorbance of reference solution as zero. The graph of Concentration of fluoride V/S Absorbance was plotted to find out the concentrations of fluoride in unknown water samples.
Results
Method validation plays an important role in the selection of an appropriate method for analysis. This method is well suited between the concentration range of 0.25ppm to 3ppm. In case of higher concentration, the sample has to be diluted. This method determines the analyte specifically even in the presence of other components like Na, K, Ca giving a confirmation of showing specificity.19 Totally, eight trials were done to standardise the method in which all the graphs have shown a linearity (Fig 2). In each trial, one spiked sample was taken. So it can be concluded that this method gives an accurate results in the laboratory.20
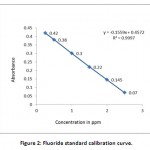 |
Figure 2: Fluoride standard calibration curve. Click here to View figure |
Usually in the surface water bodies, the level of fluoride is below 0.5ppm, whereas in Dalvoy lake, Kukkarahalli Lake, Karanji Lake and Ummathur Lake, the concentration is above 1.5ppm.The fluoride concentration was ranged from 0.3pm-2.9ppm in BoreWell water with the highest fluoride level at LingambudiPalya (2.9ppm) & the lowest at Suttur (0.2ppm). In Surface Water bodies, the fluoride levels were accounted from 0.25 to 3ppm with the highest at dalvoy Lake & the lowest at Kabini & Kaveri River (Table-1). Usually fluoride level is below 0.5 ppm in stagnant water and running water whereas in groundwater, the concentration varies from 1ppm to 48 ppm.21,22 Digging up of deeper aquifers for irrigation results in the higher level of fluoride (Gupta,1995). Muktsar city in Punjab state shows the highest fluoride concentration of 42.5 ppm standing at the top place in India, which is followed by 32.5ppm of fluoride level in Delhi.
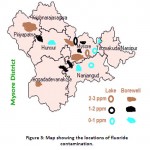 |
Figure 3: Map showing the locations of fluoride contamination. Click here to View figure |
In bore well water, only 28% of the water samples come under the recommended fluoride intake range of 0.5-1 ppm, 6% of the samples occupy 0-0.5 ppm range, 40% of the water samples lie in 1-1.5 ppm level, 15% of the water samples shared 1.5-2 ppm level, and 11% of the samples with the highest concentration of fluoride between 2-3 ppm (Fig 4a).
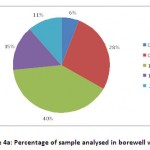 |
Figure 4a: Percentage of sample analysed in borewell water. Click here to View figure |
In surface water, 11% of the water samples between 0-0.5 ppm, 52% of the samples between 0.5-1 ppm, 23% of the samples in the range of 1-1.5 ppm, 9% of the samples occupied 1.5-2 ppm and 5% of the samples occupied 2-3 ppm range (Fig 4b).
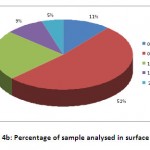 |
Figure 4b: Percentage of sample analysed in surface water. Click here to View figure |
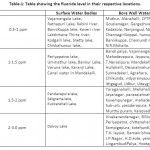 |
Table 1: Table showing the fluoride level in their respective locations. Click here to View table |
There are maximum number of 48 samples in the range of 1-1.5ppm, 35 samples in the range of 0.5-1ppm, 18 samples in the of 0-0.5ppm, 17 samples in the range of 1.5-2ppm, 10 samples in the range of 2-2.5ppm and 2 samples in the range of 2.5-3 ppm (Fig 5).
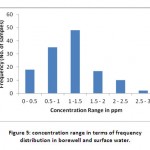 |
Figure 5: concentration range in terms of frequency distribution in borewell and surface water. Click here to View figure |
Discussion
Hydrogeologically, the area of sampling points forms a part of hard rock terrain comprising of granites, gneisses, charnockites amphibolites. As the groundwater occurs in weathered zones of granites and gneiss at deeper level in the district, the fluoride content is high in this region. This being the preliminary studies, more elaborate studies should be taken up to establish the fluoride content of this region. The groundwater occurs under phreatic conditions in weathered zones of granites and gneiss, and under semi-confined to confined conditions in joints and fractures of these rocks at deeper level in the district. Physico-Chemical Parameters of water samples such as pH, temperature, colour, turbidity are correlated with the concentration of fluoride as all these parameters are interrelated to each other.
Temperature
A rise in temperature of water leads to the speeding up of chemical reactions in water, reduces the solubility of gases and amplifies the tastes and odours. The average temperature of the present study ranged from 27.85-29.17° C.
pH
It is known that pH of water (6.5 to 8.5) does not has no direct effect on health. But lower value below 5.0 produce sore taste and has higher value above 8.5 are of alkaline taste. The pH values of the present investigation were within the BIS standards (6.5 – 8.5). Conductivity varies with the season as well as ions present in water. Temperature also affects the pH values; therefore the temperature at the time of analysis should be reported.
Colour
Colour in water may be due to the presence of inorganic ions such as iron and manganese, humus and peat materials, planktons, weeds and industrial waste. Very slight amount of turbidity, pH interferes with the colour. Filtering may result in removal of some of the colour, leading to erroneous results. All the water samples used in the present study are colourless.
Turbidity
Turbidity occurs in all surface water bodies such as lakes, streams and canals. The high values of turbidity is considered as an indication of pollution by finely divided organic matters, particulate matter such as clay or silt, plankton or other microscopic organisms. Turbidity values obtained in the study are found to be less than 2 NTU. Colour and Turbidity of the samples play an important role in the determination of the fluoride. As they cause interferences, water samples should be colourless and less turbid. Alkalinity is also one of the parameter that interferes in fluoride analysis, hence should be neutralized by adding Hydrochloric acid. Veeraputhiran and Alagumuthu (2010) have produced a report on the highest fluoride concentration of 4.34 ppm in the ground water of Ottapidaram, Tamil Nadu.23 Borah and Saikia (2011) found increased concentration of fluoride in ground water of Tinkusia district, Assam. Puneeth and Ashish (2012) have assessed the levels of fluoride in Tap water and bottled water in Agra city, India.24 Abu Zeid (1998) et al have studied the impact of fluoride in drinking water and listed the defluoridation techniques.25 Murray (1986) have estimated fluoride concentration in dry leaves upto 400 ppm and canned fish may contain upto 370 ppm. A survey study by Rajesh kumar and Yadav (2010) have shown the levels of fluoride in different cereals, vegetables and fruits with the highest levels in Rice of about 5.9 ppm and Apple of about 5.7 ppm.26
Conclusion
This present investigation identifies the areas having higher concentration of fluoride in the lake, river and groundwater. The results have shown that the level of fluoride has crossed a warning limit in the Borewell water of southern part and western part of urban areas, southern part of H.D.Kote (Remote areas), Bilikere of HunsurTaluk and some areas of Periyapatna taluk namely Chittenahalli, Periyapatna. From the fluoride level found in ground water samples of the study area it can be concluded that the ground water is not safe for drinking purpose, but can be used for irrigation. High fluoride in water may cause dental fluorosis among the children and pain in joints and backbone in the aged persons. As most of the water samples do not meet the water quality standards for fluoride concentration. Defluoridation is needed as the naturally occurring fluoride level exceeds recommended limits, the work on development of simple and cost effective methods to reduce fluoride content is required. Conjuctive use of both surface and ground water practice in the canal command areas would improve the quality of ground water.
References
- Central Ground Water Board (CGWB), Groundwater Information Booklet, Mysore District, Karnataka, 2009.
- Simpson A. et al., Journal of Dentistry, 29(1), 15-21, 2001.
- Ruan J.P., “Dental fluorosis in children in areas with fluoride-polluted air, high-fluoride water, fluoride air: a study of deciduous and permanent teeth in the shaanxi province, China”. Acta. Odontol.Scand., 65(2), 65-71, 2007.
- Sumalatha S. et al, curr.sci., 76,730-734, 1999.
- Susheela A.K., Fluorosis management programme in India. Current science, 77(10), 1250-6, 1999.
- Featherstone J.D., Dental caries: a dynamic disease process. Aust. Dent. J, 5, 2008.
- Verma R.J. and Guna-Sherlin D.M., Food. Chem. Toxicol., 40, 1781-1788, 2002.
- Mahaboob Pasha P. and Sujitha N.S., Toxicol. Int., 18(2), 99-104, 2011.
- Cronin S.J. and Sharp D.S., Int.J .Env. Health. Res., 12(2),109-23, 2002.
- Gupta S. et al, Fluoride 39, 318-320, 2006.
- Jitumoni Borah, Deepjyoti Saikia, Arch. Appl.Sci. Res., 3(3),202-206, 2011.
- Handa B.K., Groundwater, 25, 255-264, 1975.
- Mishra P.C. et al, Afr. J. Environ. Sci. Technol., 3, 260-264, 2009.
- Anil K.K. and Bhaskara R.A.V., Physiological responses to fluoride in two cultivars mulberry. World. J. Agric. Sci., 4(4), 463-466, 2008.
- Murray J.J., editor, Appropriate use of Fluorides for Human Health, WHO, Geneva, 1986.
- Dash M.C. and Mishra P.C., Manand. Environ. Macmillan. India Limited, Chennai, 293p, 2001.
- Andreae M.O., Methods of Seawater Analysis, Verlag Chemie Weinheim, West Germany, 2,218, 1983.
- APHA, Standard Methods For Examination of Water and Wastewater 21th Ed., American Public Health Association, Washington, D.C ., 2005.
- AOAC peer verified methods programManual on policies and procedures, Arlington, VA, 1993.
- Fleming J. et al, Accred.Qual.Assur. I., 87, 1996.
- Shivashankara A.R. et al, Fluoride ,33(2), 66-73, 2000.
- Gupta S.K. and Sharma P., An approach to tackling fluoride problem in drinking water. Current Science, 68, 774, 1995.
- Veeraputhiran V., Alagumuthu G., A report on Fluoride distribution in drinking Water. Int. Jour. Env. Sci., 1(4), 2010.
- Puneet Gupta and Ashish Kumar, Research report ,Fluoride ,45(3), 307-310, 2012.
- Abu-Zeid Khaled M., Environmental Management and Health Journal,Vol-9, 2-3, 1998.
- Rajesh Kumar and Yadav S.S., S.S.M & R.A.E, 2010.


