Estimation of Heavy Metal in Vegetables from Different Market Sites of Tribal Based Ranchi City through Icp-Oes and to Assess Health Risk
Ratna Ghosh1 * , Reshma Xalxo1 and Manik Ghosh2
1
Department of Home Science (Division of Nutrition),
Ranchi University,
Ranchi,
834001
India
2
Birla Institute of Technology,
Mesra,
Ranchi,
835215
India
DOI: http://dx.doi.org/10.12944/CWE.8.3.13
Copy the following to cite this article:
Ghosh R, Xalxo R, Ghosh M. Estimation of Heavy Metal in Vegetables from Different Market Sites of Tribal Based Ranchi City through Icp-Oes and to Assess Health Risk. Curr World Environ 2013;8(3) DOI:http://dx.doi.org/10.12944/CWE.8.3.13
Copy the following to cite this URL:
Ghosh R, Xalxo R, Ghosh M. Estimation of Heavy Metal in Vegetables from Different Market Sites of Tribal Based Ranchi City through Icp-Oes and to Assess Health Risk. Curr World Environ 2013;8(3). Available from: http://www.cwejournal.org/?p=5268
Download article (pdf) Citation Manager Publish History
Select type of program for download
| Endnote EndNote format (Mac & Win) | |
| Reference Manager Ris format (Win only) | |
| Procite Ris format (Win only) | |
| Medlars Format | |
| RefWorks Format RefWorks format (Mac & Win) | |
| BibTex Format BibTex format (Mac & Win) |
Article Publishing History
| Received: | 2013-11-03 |
|---|---|
| Accepted: | 2013-11-28 |
Introduction
Heavy metals are important environmental pollutants, particularly in areas with high anthropogenic pressure. Their presence in the plants, atmosphere, soil and water, even in traces, can cause serious problems to all organisms. The presence of heavy metals in sewage sludge, used as agricultural fertilizer is a major problem for crop and environmental qualities and their impact on human health, because most of the heavy metals are persistent due to their immobile nature (Devkota et al., 2000; Itanna, 2002; Keller et al., 2002; McBride, 2003). The transfers of metals from bio solids to soil and subsequently to plants pose potential health risks because they can enter the food chain and the environment (Ghaedi et al., 2008). Plant uptake is one of the major pathways by which sludge-borne heavy metals enter the food chain (Chaney, 1990). Inputs of heavy metals to agricultural soils generate negative impact on soil fertility and accumulate in the human food chain (McLaughlin et al., 1999). Food contamination by heavy metals depends both on their mobility in the soil and their bioavailability. Though some of the mobility and bioavailability factors are easy to measure, determination of the food risk contamination is tricky. Regulation, handling and bioremediation of hazardous materials require an assessment of the risk to some living species other than human being, or assessment of hazard to the entire ecosystem. Heavy metal accumulation in soils is of concern in agricultural production due to the adverse effects on food quality (safety and marketability), crop growth (due to phytotoxicity) (Ma et al., 1994; Msaky and Calvert, 1990; Fergusson, 1990) and environmental health (soil flora/fauna and terrestrial animals). The mobilization of heavy metals into the biosphere by human activity has become an important process in the geochemical cycling of these metals. This is acutely evident in urban areas where various stationary and mobile sources release large quantities of heavy metals into the atmosphere and soil, exceeding the natural emission rates (Nriagu, 1989; Bilos et al., 2001) and it is often caused by accidental releases of chemicals or the improper disposal of hazardous waste. Increased inputs of metals and synthetic chemicals in the terrestrial environment due to rapid industrialization coupled with inadequate environmental management in the developing country like India, has led to large-scale pollution of the environment. These chemicals in the terrestrial environment clearly pose a significant risk to the quality of soils, plants, natural waters and human health. Heavy metal content of soil is of major significance in relation to their fertility and nutrient status (Gowd et al., 2010).
However, high concentrations of these metals become toxic. Other metals, which are not included in the group of essential elements, such as Pb or Cr, may be tolerated by the ecosystem in low concentration, but become harmful in higher concentrations. Soluble metal compounds and metals held in exchange complexes are considered to be available to vegetation uptake. Prolonged exposure to heavy metals such as cadmium, copper, lead, nickel can cause deleterious health effects in humans (Reilly 1991).
In this study, we estimated the concentrations of Cd, Co, Cr, Cu, Pb, Ni and As in vegetables collected from different market sites of Ranchi city (tribal dominated population). The study was conducted around Ranchi (23°21’ N latitude 85°20’ E longitude and 729 m (2,392 ft) above the sea level) city in Jharkhand eastern plains of India. Various small scale industries situated in this city. A large area around industries have no access to clean water resources, so farmers use treated and untreated wastewater for irrigation. The long term uses of treated and untreated wastewater for irrigation may also increase the uptake and accumulation of the heavy metals in the vegetables. From the cultivated sites these vegetables are supplied to the wholesale vegetable market and the rest enter the local markets. The levels of contamination were compared with the PFA and ASTDR guidelines to assess the potential hazards of heavy metals to public health. The hypothesis behind the present study is that the irrigation with waste water, transportation and marketing site of vegetables in contaminated environment may elevate the levels of heavy metals in vegetables through surface deposition.
Material and Methods
Study Area
Thirteen vegetables were collected randomly from the different market sites of urban and suburban area of Ranchi, Jharkhand to estimate the total heavy metal content in these samples. Ranchi City (23°21’ N latitude 85°20’ E longitude and 729 m (2,392 ft) above the sea level) is Capital of Jharkhand, India. Eight Road side Markets viz. Site-1 (Lalpur Market), Market Site-2 (BIT More Market), Site-3 (Daily Market), Site-4 (Kanke Road Market), Site-5 (Booti More Market), Site-6 (RIMS Market), Site-7 (Morabadi Stadium Market), Site-8 (Bahu Bazar Market) and two organized Markets i.e. Site-9 (Reliance Mart and Site-10 (Big Bazar) were demarcated for vegetable purchasing. A report related to Site-1 to Site-4 has already been discussed in one of the previous study (Ghosh et al., 2011). The present study was focused on Site-5 to Site-10 only.
Sampling
The freshly mature vegetables were brought to the laboratory and washed primarily with running clean tap water to remove the soil particles. After removing the extra water from the surface of vegetables with blotting paper, samples were cut into pieces, packed into separate bags, and kept in an oven until a constant weight was achieved. Sample were dried in oven at 70 °C for 48 h and then ground to powder. The grinded samples were passed through a sieve of 2 mm size and then kept at room temperature for further analysis.
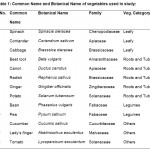 |
Table 1: Common Name and Botanical Name of vegetables used in study Click here to View table |
Analytical Procedure
Digestion
Dried and sliced vegetable samples were grounded into powder with an electric blender and stored in polythene bags until analysis. Approximately 0.5 grams of samples were digested in replicate (along with a blank) with 7 ml HNO3 and 0.5 ml H2O2 in a MultiwaveTM 3000 Microwave digestion system (Anton Paar). This is an industrial type microwave oven which can be equipped with various accessories to optimize the sample digestion. In this case, pre cleaned HF-100 vessels were used in an 8-position rotor. A pressure / Temperature (P/T) Sensor Accessory, which simultaneously measures temperature and pressure for one vessel, was also used. All vessels temperature were monitored with the IR Temperature Sensor Accessory. This device gives thermal protection to the reactions in all of the vessels by measuring the temperature remotely on the bottom surface of each vessel liner during the digestion process. The digestion program consisted of 30 minutes of heating and 15 minutes of cooling as shown in Table 2.
The samples were completely dissolved, resulting in clear solution. After cooling, the digested sample was filtered using Whatman® Quantitative Filter paper, Ashless Grade No. 44 and the filtrate was finally maintained to 100 ml with Millipore water.
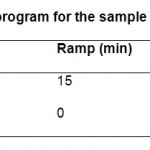 |
Table 2: Microwave digestion program for the sample preparation Click here to View table |
All reagents used were Merck, analytical grade (AR) including Standard Stock Solutions of known concentrations of different heavy metals. Heavy metal concentrations of vegetable samples were estimated by Inductively Coupled Plasma Optical Emission Spectrometer (ICP-OES) (Model Optical 2100DV ICP-OES, Perkin Elmer, USA) with argon laser. The Spectral range was of 160 nm to 900 nm and resolution of 0.009 nm at 200 nm. The instrument was fitted with UV sensitive dual backside – illuminated CCD array detector.
Concentrations of heavy metals were calculated on a dry weight basis. All analyses were replicated six times. To assess the contamination level of heavy metals, mean, median, minimum, maximum and standard deviation of vegetable samples were performed by using Microsoft Excel (Version 2007).
Data Analyses
Metal Pollution Index (MPI)
To examine the overall heavy metal concentrations in all vegetables, metal pollution index (MPI) was computed. This index was obtained by calculating the geometrical mean of concentrations of all the metals in the vegetables (Usero et al, 1997).
MPI (µg/g) = (Cf1 x Cf2 x . . . x Cfn)1/n
Where, Cfn = concentration of metal n in the sample.
Estimate Daily Intake of Heavy Metals
Data of the average diet per person per day were collected from a survey .The average daily vegetable intake was calculated by conducting a survey where 50 people having average body weight of 60 kg and age group 18 years to 70 years were asked for their daily intake of particular vegetable from the each experimental area in every sampling. Daily intake was calculated by the following equation:
Daily intake of metal (DIM) = Cmetal x Dfood intake / Baverage weight
Where, Cmetal, Dfood intake andBaverage weight represent the heavy metal concentrations in vegetables (µg g-1), daily intake of vegetables and average body weight respectively (Singh et al., 2010).
Health Risk Index (HRI)
The health risk index was calculated as the ratio of estimated exposure of test vegetables and oral reference dose (Cui et al., 2004). Oral reference doses (RfDo) were 4 x 10⁻² and 1 x 10⁻³ mg kg-1 day-1 for Cu and Cd, respectively (USEPA, 2002) and 0.004, 0.02 and 1.5 mg kg-1 day-1 for Pb, Ni and Cr, respectively (USEPA, 1997). Estimated exposure is obtained by dividing daily intake of heavy metals by their safe limits. An index more than 1 is considered as not safe for human health (USEPA, 2002).
Therefore, Health Risk Index = DIM/RfDo,
Statistical Analysis
Concentrations of heavy metals were calculated on a dry weight basis. All analyses were replicated six times. To assess the contamination level of heavy metals, mean, median, minimum, maximum and standard deviation of vegetable samples. The Metal Pollution Index of the vegetables of different sites (Site-1 to Site-10) were subjected to two way analysis of variance (ANOVA) test for assessing the significance of differences in heavy metal concentrations due to different sites, irrigation practices, environmental pollutants, etc. All analysis was performed by using Microsoft Excel (Version 2007) and GraphPrism 5.
Results and Discussion
Concentration levels of heavy metals
In present study, the concentration range of various heavy metals such as Cadmium (Cd), Cobalt (Co), Copper (Cu), Chromium (Cr), Nickel (Ni) and Lead (Pb) in different vegetables collected from road side market and organized market were estimated. The mean concentrations of Cd, Ni and Pb found in vegetables collected from local markets were summarized in graphical form (Figure 1 to 3). All sites showed quite a few higher concentrations of Lead (Pb), than the permissible PFA limit. Among thirteen vegetables, Beet, Cucumber, Pea, Beans, Lady’s finger, Corriender and Tomato showed high levels of Pb in vegetables collected from all sites. Within the selected vegetables, the highest concentrations of Pb were noticed in Peas collected from Site-5 followed by Site-7 and Site-8. Cadmium (Cd) was found in fair amount in Cucumber collected from Site-6 and Site-8 and Spinach from Site-6. Nickel (Ni) was found to be in higher concentrations in Pea and Beans collected from all sites. Lady’s finger also contains fair amount of Ni. The concentration levels of these three heavy metals (Pb, Cd and Ni) in vegetables were found to contain beyond than the permissible PFA limit. The high contamination found in vegetables might be closely related to the pollutants in irrigation water, farm soil or due to pollution from the highways traffic (Igwegbe et al., 1992; Qiu et al., 2000).
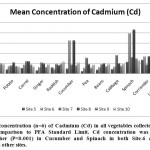 |
Table 1 Click here to View figure |
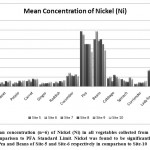 |
Figure 2: Mean concentration (n=6) of Nickel (Ni) in all vegetables collected from Site-5 to Site-10 in comparison to PFA Standard Limit. Nickel was found to be significantly higher (P<0.001) in Pea and Beans of Site-5 and Site-6 respectively in comparison to Site-10 Click here to View figure |
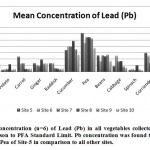 |
Figure 3: Mean concentration (n=6) of Lead (Pb) in all vegetables collected from Site-5 to Site-10 in comparison to PFA Standard Limit. Pb concentration was found to be significantly higher (P<0.01) in Pea of Site-5 in comparison to all other sites. Click here to View figure |
The concentration of Cadmium (Cd) ranges from 0.116 ppm to 2.150 ppm in various vegetables. The maximum concentration of Cd 2.150 ppm was found in spinach collected from Site-8, while minimum concentration 0.116 ppm was found in Pea collected from Site-5. Cd concentration was found to be significantly higher (P<0.001) in Cucumber and Spinach in both Site-6 and Site-8 in comparison to all other sites. Health Risk Index (HRI) was found more than 1.64 and 2.38 in Cucumber from Site-6 and Site-8 respectively. In Spinach the HRI was 2.19 and 2.15 respectively for Site-6 and Site-8 (Figure 4). HRI more than 1 is considered as not safe for human health (USEPA, 2002). Acute doses of Cadmium can cause severe gastrointestinal irritation, vomiting, diarrhea, and excessive salivation, and doses of 25 mg of Cd/kg body weight can cause death. Low-level chronic exposure to Cd can cause adverse health effects including gastrointestinal, hematological, musculoskeletal, renal, neurological, and reproductive effects. The main target organ for Cd following chronic oral exposure is the kidney (ATSDR 1999a).
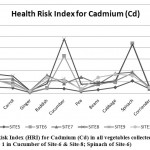 |
Figure 4: Health Risk Index (HRI) for Cadmium (Cd) in all vegetables collected from Site-5 to Site-10. (HRI Cd > 1 in Cucumber of Site-6 & Site-8; Spinach of Site-6) Click here to View figure |
The Cobalt (Co) content varies from 0.300 ppm to 1.466 ppm. The lowest concentration 0.300 ppm of Co was observed in Carrot collected from Site-5. On the other hand, Beet from Site-7 showed highest concentration of Co i.e. 1.466 ppm but was less than what observed in Site-3 (1.633 ppm) (Ghosh et al, 2011). Health risk index was found more than 1 in Cabbage (All sites except Site-5; 1.46 in Site-6), Tomato (Site-6, 8 and 10), Potato (Site-9 and Site-10; 1.57 in Site-10) and Spinach (Site-7 and Site-10) (Figure 5). Higher concentrations of Co were observed in Beet of Site-3 and Spinach of Site-4 which were significantly higher (P<0.05) than all other sites (Ghosh et al, 2011). Overdose of Co may lead to angina, asthma, cardiomyopathy, polycythemia and dermatitis. The safety limit for human consumption of Co is 0.05 to 1 mg/day in humans (ATSDR 1994).
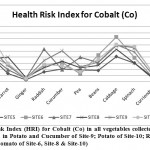 |
Figure 5: Health Risk Index (HRI) for Cobalt (Co) in all vegetables collected from Site-5 to Site-10. (HRI Co > 1 in Potato and Cucumber of Site-9; Potato of Site-10; Raddish, Spinach, Cabbage of Site-7; Tomato of Site-6, Site-8 & Site-10) Click here to View figure |
Present investigation reveals that Copper (Cu) varies from 3.933 ppm to 22.300 ppm. The highest concentration of Cu was found in Tomato collected from Site-8 (22.300 ppm), while lowest concentration 3.93 ppm was recorded in Potato collected from Site-7. Chromium (Cr) concentration varies from 0.266 to 7.833 ppm. The highest concentration of Cr was found in Tomato collected from Site-6 (7.833 ppm), while lowest concentration 7.833 ppm was recorded in Radish and Cabbage collected from Site-7. The presence of Nickel (Ni) ranges from 0.200 to 5.833 ppm in various vegetables. Peas from Site-5 and Beans from Site-6 showed high content of Nickel 5.833 ppm, while Ginger from Site-5 contains low value of Ni 0.200 ppm. Nickel was found to be significantly higher (P<0.001) in Pea and Beans of Site-5 and Site-6 respectively in comparison to Site-10. Excess intake of Ni leads to hypoglycemia, asthma, nausea, headache, and epidemiological symptoms like cancer of nasal cavity and lungs. During the present study, the concentration of Lead (Pb) content varies from 0.466 ppm to 12.066 ppm. High concentration of Pb was found in Peas collected from Site-5 (12.066 ppm) but less than what observed in Site-1 (13.733 ppm) (Ghosh et al, 2011). The concentration of Lead was found to be significantly higher (P<0.01) in Tomato, Pea and Cucumber of Site-5 in comparison to Site-2, Site-3, Site-9 and Site-10. Spinach collected from Site-10 showed low concentration of Pb (0.466 ppm). Health risk index for Pb was found more than 1 in Cucumber (All sites; 3.54 in Site-8), Pea (All sites except Site-10; 2.45 in Site-7), Beans (All sites; 1.38 in Site-9), Lady’s finger (All sites; 2.03 in Site-7), and Tomato (All sites except Site-10; 2.79 in Site-8) (Figure 6). Todd (1996) emphasized that most of the accumulated Lead is sequestered in the bones and teeth. This causes brittle bones and weakness in the wrists and fingers. Lead that is stored in bones can reenter the blood stream during periods of increased bone mineral recycling (i.e., pregnancy, lactation, menopause, advancing age, etc.). Mobilized lead can be redeposited in the soft tissues of the body and can cause musculoskeletal, renal, ocular, immunological, neurological, reproductive, and developmental effects (ATSDR 1999b).
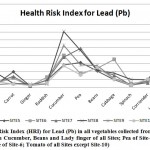 |
Figure 6: Health Risk Index (HRI) for Lead (Pb) in all vegetables collected from Site-5 to Site-10. (HRI Pb > 1 in Cucumber, Beans and Lady finger of all Sites; Pea of Site-5, Site-7, Site-8 & Site-9; Cabbage of Site-6; Tomato of all Sites except Site-10) Click here to View figure |
Metal Pollution Index (MPI)
is suggested to be a reliable and precise method for metal pollution monitoring. Among different vegetables pea showed highest value of MPI followed by Cucumber. Seven vegetables out of thirteen showed higher MPI i.e. more than 2. These were pea, cucumber, tomato, beans, spinach, lady finger and cabbage. Higher MPI suggests that these vegetables may cause more human health risk due to higher accumulation of heavy metals in the edible portion. Metal Pollution Index of various vegetables from all sites (Site-1 to Site-10) was reported in Figure 7. Site-6 and Site-8 can be classified as high risk sites as the MPI of all vegetables were higher than 1. Among the vegetables Pea, Beans. Beet and Cucumber were found to be highly contaminated with the heavy metals. The results of the Anova (Two-Factor without Replication) suggests that in case of vegetables, the P value (1.12E-38) was found to be less than the significance level (0.05), and F (50.513) was more than F crit (1.843) i.e. there is significant difference between MPI among the vegetables. Similarly, in case of Sites, the P value (4.65E-10) was less than the significance level (0.05), so we can reject the null hypothesis that the means are equivalent. F (9.017) was observed more than F crit (1.968) so we can reject the null hypothesis i.e. there is a significant difference between MPI among the Sites.
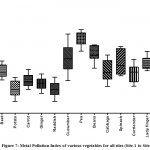 |
Figure 7: Metal Pollution Index of various vegetables for all sites (Site-1 to Site-10) Click here to View figure |
Conclusion
The heavy metals not only affect the nutritive values of vegetables but also have deleterious effect on human beings using these food items. The value of HRI more than 1 indicates considerable risk of negative impact on human health. National and International regulations on food quality have lowered the maximum permissible levels of toxic metals in human food; hence, an increasingly important aspect of food quality should be to control the concentrations of trace metals in food (Radwan et al., 2006). The residues of the heavy metals still appear as pollutants in vegetables as well as in the environment. Their occurrence and long-range transport at local, regional and global scales has been recently investigated. In developing countries heavy metal contamination is receiving increasing attention from the public as well as governmental organization. There are few major pathways for human exposure to heavy metal contamination in vegetables. Data here demonstrates that Pb, Cd and Co in vegetables may pose health risk to consumer. The present study provides additional data on heavy metals contamination in Ranchi, Jharkhand. It is suggested that regular survey of heavy metals should be done on all food commodities in order to evaluate whether any health risks from heavy metal exposure do exist, to assure food safety and to protect the end user from food that might injure their health.
Acknowledgment
The authors are thankful to the Head, Department of Pharmaceutical Sciences, Birla Institute of Technology, Mesra for providing the facilities to carry out this work and Dr. Sanjay Swain, Central Instrumentation Facility, Birla Institute of Technology, Mesra Ranchi for his constant help during the analytical work.
Reference
- Agency for Toxic Substances and Disease Registry (ATSDR), Toxicological Profile for Zinc and Cobalt, US Department of Health and Human Services, Public Health Service, 205-88-0608 (1994).
- Agency for Toxic Substances and Disease Registry (ATSDR), Toxicological Profile for Cadmium and Nickel, Agency for Toxic Substances and Disease Registry, US Department of Health and Human Services, Public Health Service, 205-93-0606 (1999a).
- Agency for Toxic Substances and Disease Registry (ATSDR)., Toxicological Profile for Lead, Agency for Toxic Substances and Disease Registry, US Department of Health and Human Services, Public Health Service, 205-93-0606 (1999b).
- Bilos, C., Colombo, J.C., Skorupka, C.N., Rodriguez Presa, M.J., Source, distribution and variability of airborne trace metals in La Plata City area, Argentina. Environ. Pollut. 111: 149-158 (2001).
- Chaney, R..L., Public health and sludge utilization, Biocycle 30: 68–73 (1999).
- Devkota, B., Schmidt, G.H., Accumulation of heavy metals in food plants and grasshoppers from the Taigetos Mountains, Greece, Agric. Ecosyst. Environ. 78: 85–91 (2000).
- Fergusson, J.E., The Heavy Elements: Chemistry, Environmental Impact and Health Effects. Pergamin Press, Oxford, pp. 382-399 (1990).
- Ghaedi, M., Shokrollahi, A., Kianfar, A.H., Mirsadeghi, A.S., Pourfarokhi, A., Soylak, M., The determination of some heavy metals in food samples by flame atomic absorption spectrometry after their separation-preconcentration on bis salicyl aldehyde 1,3 propan diimine (BSPDI) loaded on activated carbon. J. Hazard. Mater. 154: 128–134 (2008).
- Ghosh, R., Xalxo, R., Gope, M.C., Mishra, S., Kumari, B., Ghosh, M., Estimation of Heavy Metals in locally available vegetables collected from road side market sites (1-4) of different areas of Ranchi City. PHARMBIT XXIII and XXIV: 68-73 (2011).
- Gowd, S.S, Reddy, M.R,. Govil, P.K., Assessment of heavy metal contamination in soils at Jajmau (Kanpur) and Unnao industrial areas of the Ganga Plain, Uttar Pradesh, India. J. Hazard. Mat. 174: 113–121 (2010).
- Igwegbe, A.O., Belhaj, H., Hassan, T.M., Gibali, A.S., Effect of a highways traffic on the level of lead and cadmium in fruits and vegetables grown along the roadsides. J. Food Safety 13: 7–18 (1992).
- Itanna F., Metals in leafy vegetables grown in Addis Ababa and toxicological implications, Ethiop. J. Health Dev. 6: 295–302 (2002).
- Keller, C,. McGrath, S.P,. Dunham, S.J,, Trace metal leaching through a soil grassland system after sewage sludge application. J. Environ. Qual. 31: 1550–1560 (2002).
- Ma, Q.Y., Traina, S.J., Logan, T.J., Effect of aqueous Al, Cd, Fe(II), Ni and Zn on Pb immobilization by hydroxyapatite. Environ. Sci. Technol., 28: 1219-1228 (1994).
- McBride, M.B., Toxic metals in sewage sludge-amended soils: has promotion of beneficial use discounted the risks. Adv. Environ. Res. 8: 5–19 (2003).
- McLaughlin, M.J., Parker, D.R., Clarke, J.M,. Welch, R.M,. Graham, R.D., Sustainable field crop systems for enhancing human health: agricultural approaches to balanced micronutrient nutrition. Field Crops Res. 60: 143–163 (1999).
- Msaky, J.J., Calvert, R., Adsorption behavior of copper and zinc in soils: influence of pH on adsorption characteristics. Soil Sci., 150: 513-522 (1990).
- Nriagu, J.O., 1989. A global assessment of natural sources of atmospheric trace metals. Nature, 338: 47-49 (1989).
- Qiu, X.X., Huang, D.F., Cai, S.X., Chen, F., Ren, Z.G., Cai, Y.C., Investigation on vegetables pollution and the pollution sources and its control in Fuzhou, Fujian Province (China). Fujian J. Agric. Sci. 15: 16–21 (2000).
- Radwan, M.A., Salama, A.K., Market basket survey for some heavy metals in Egyptian fruits and vegetables. Food Chem. Toxicol. 44: 1273–1278 (2006).
- Reilly, C., Metal contamination of food, 2nd edn. Elsevier Applied Science, London, p. 110 (1991).
- Singh, A., Sharma, R.K., Agrawal, M., Marshall, F.M., Health risk assessment of heavy metals via dietary intake of foodstuffs from the wastewater irrigated site of a dry tropical area of India. Food Chem. Toxicol. 48: 612 (2010).
- Todd, G.C. Vegetables grown in mine wastes. Environ. Toxicol. Chem. 19: 600-607 (1996).
- USEPA (US Environmental Protection Agency), Exposure Factors Handbook, Office of Research and Development. National Center for Environmental Assessment. US Environmental Protection Agency. Washington, DC. http://www.epa.gov/ncea/pdfs/efh/front.pdf (1997).
- USEPA (US Environmental Protection Agency), Region 9, Preliminary Remediation Goals. http://www.epa.Gov/region09/waste/sfund/prg (2002).
- Usero, J., Gonzalez-Regalado. E., Gracia. I., Trace metals in the bivalve mollusks Ruditapes decussates and Ruditapes phillippinarum from the Atlantic Coast of Southern Spain. Environ. Int. 23: 291–298 (1997).


