An Evaluation of Water Quality From Siahrod River, Haraz River and Babolrood River by NSFWQI Index
Javad Noorbakhsh1 , Ehsan Sadati Seyedmahalleh2 * , Gholamreza Darvishi3 , Farshad Golbabaei Kootenaei4 and Nasser Mehrdadi4
1
Department of Chemistry,
Payame Noor University,
Sari Branch,
Sari,
Iran
2
Aras International Campus,
Tehran University,
Tehran,
Iran
3
Department of Civil Engineering,
Qaemshahr Branch,
Islamic Azad University,
Qaemshahr,
Iran
4
Faculty of Environment,
University of Tehran,
Tehran,
Iran
http://dx.doi.org/10.12944/CWE.9.1.09
Copy the following to cite this article:
Noorbakhsh J, Seyedmahalleh E. S, Darvishi G, Kootenaei F. G, Mehrdadi N. An Evaluation of Water Quality From Siahrod River, Haraz River and Babolrood River by NSFWQI Index. Curr World Environ 2014;9(1) DOI:http://dx.doi.org/10.12944/CWE.9.1.09
Copy the following to cite this URL:
Noorbakhsh J, Seyedmahalleh E. S, Darvishi G, Kootenaei F. G, Mehrdadi N. An Evaluation of Water Quality From Siahrod River, Haraz River and Babolrood River by NSFWQI Index. Curr World Environ 2014;9(1). Available from: http://www.cwejournal.org/?p=5940
Download article (pdf) Citation Manager Publish History
Introduction
The increased use of water resources, unnatural manipulation and changes in river water quality have been increased. In all around the world, human activities have profound effects on rivers and lakes. Rivers are exposed to large amounts of household wastewater, industrial swages, agricultural swages, mine wastes, urban wastewater, radioactive materials, pesticides and numerous other contaminants (Wongsupapa, C., et al., 2009)
The first step for keeping river water quality and purification of polluted parts is obtaining information on the qualitative changes of river water in dimensions of time and place and also, determination of major sources and various water pollutants (Oguchi, T., 2009, SahaP., 2010).
Analysis of measured parameters alone or in combination, give incomplete information on water quality because of variety of parameters, samples and stations. Mathematical-computer qualitative modeling of river water also needs broad hydrodynamic and hydrological information (Silva f., et al., 2000, Ormsbee, L., 2006). Water quality index (WQI) is developed to solve this problem. WQI is first represented by Brown in 1970.
WQI is a mathematical and statistical tool for conversion of quantitative values of large quantity of water quality data into a single number. It provides a simple and understandable tool for managers and policy makers to obtain information on water quality and decide to allow the permitted uses of water. Also, application of WQI specifies the process of variations and qualitative trends of water resources (Brian O., 2005) and also allows the classification of water quality. Published indicators have various types that developed according to specific methods of each region and available standard in it, such as NSFWQI, OWQI and etc.Among the various indexes which are applicable for water quality zoning, NSFWQI was selected because of high precision, simplicity and availability of the required parameters (Shamsai et al., 2006).
According to previous studies, Mirmoshtaghi in 2011, studied the water quality of Sefidrood River by investigation of 20 samples at 5 sampling stations according to NSFWQI index and compared the results with OWQI index. The results showed that maximum and minimum values of NSF were 57 and 32, respectively. And the average value of NSFWQI along with Sefidrood River was obtained equals to 47.5, which is placed at bad region. Also, calculation of OWQI index showed the very bad quality of Sefidrood River during the study period (Mirmoshtaghi, 2012).
In this study, classification of three river‘s water quality in Mazandaran province is investigated by NSFWQI index.
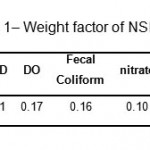 |
Table 1: Weight factor of NSFWQI
Click here to View table |
Materials and Methods
NFSWQI
After measuring of 9 above mentioned factors, each sub-index is obtained according to the conversion curves (appendix). The following equation (1) is applied for calculation of final index.
NSFWQI = €in=1KI ..(1)
Where, “n” is the number of sub-index, “k” is weighting factor and “I” is sub-index obtained from conversion curves according to Table 1.
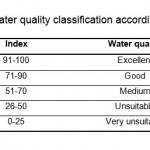 |
Table 2: Water quality classification according to NSFWQI
Click here to View table |
To determine the NSFWQI index, 9 parameters are measured for reasons as described below: Biological oxygen demand (BOD)
BOD test gives an approximate estimation of the amount of biodegradable waste materials in the water. Biodegradable waste materials are usually consists of organic waste such as leaves, grass and fertilizers.
Dissolved Oxygen (DO)
DO test specify the amount of required dissolved oxygen for continuity of life in water. This oxygen is available for fishes, invertebrates and all animals living in the water. Decrease of dissolved oxygen is a sign of probable pollution in water (Abraham W.R., 2011, Yau, J., 2003).
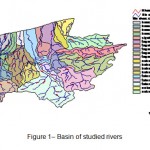 |
Figure 1: Basin of studied rivers |
Fecal coliform
Fecal coliform is a bacterium available in human and animal waste.
Nitrate
Nitrate is one of the major pollutantsin water. Nitrates are harmful for human because oxidize into nitrite and affects on the ability of red blood cells that carry oxygen. Nitrites also cause very acute disease in fish.
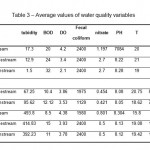 |
Table 3: Average values of water quality variables |
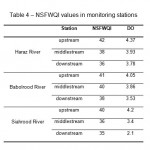 |
Table 4: NSFWQI values in monitoring stations |
pH
Most of aquatic organisms are very sensitive against the pH. Appropriate pH for survival in river is usually from 6.5 to 8.5 (Nwajei, G., et al., 2012; Kowalkowskiab T., et al., 2007)
Temperature
Most of the physical, chemical and biological are directly under influence of temperature. Most of the aquatic animals and plants survive in a certain range of temperatures and tolerate extreme changes.
Total dissolved solids (TDS)
TDS is dissolved materials in river water includes salts, some of organic materials and wide range of nutrients, toxic materials and etc. Very high or low concentration of dissolved materials affects on the growth and lead to death of aquatic life (Parihar, S., et al., 2012; Murhekar H., et al., 2012)
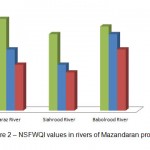 |
Figure 2: NSFWQI values in rivers |
Total phosphate
Phosphate is essential for the growth of animals and plants. total phosphate shows the available values of phosphate in aquatic resources.
Turbidity
Turbidity is calculated by using light scattering in water column due to suspended solids. High turbidity will cause more water darkness (Muthusamy P., et al. 2012). If water became very dull, its ability in maintaining most of plants and microorganisms will be removed.
NSFWQI index is a reduction index namely it is decreases with increasing of water pollution. This index has a value between 0 to 100 and is classified according to Table 2 (Khadem, I.M., et al., 2006; Banjaka D., et al., 2012).
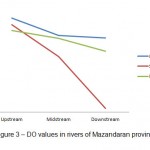 |
Figure 3: DO values in rivers of Mazandaran province |
Sampling method and analysis of factors
Samples were collected seasonally from stations at upstream, middle stream and downstream of rivers (Siahrod River, Haraz River and Babolrod River) in a 2 years interval of 2012-2013 and analyzed in laboratory of Environmental Protection Agency of Mazandaran, Iran according to the standard methods (APHA, 2005).
Results
The obtained results in a 2 years of 2012-2013 from stations of upstream, middle stream and downstream is calculated and measured and are as follows (Table 3):
The obtained values of NSFWQI at stations are as follows, which shows that the water quality at all stations are unsuitable according to Table 4 and Figure 2.
Figure 2 shows that downstream of Babolrood River had a much worse situation than other rivers, due to discharge of numerous factories swages in to the river. Babolrood River condition was relatively more appropriate than Siahrood River due to placement of upstream at a more pristine region relative to other up streams and less villages and residential cities around the river.
Selection of monitoring stations in Department of Environmental Protection was so that upstream stations were determined at appropriate distance before the entrance of cities, middle stream at city center and downstream near the sea entrance. Figure 3 shows that DO in all rivers are decreased because of industrial and agricultural drainage. It also shows thatself-purification capacity of the rivers is not enough for purifying of the rivers.
Conclusion
According to the obtained results, it is required that each river be investigated more closely as case study and with selection of more stations to specify the sources of pollutants. And by investigation of other available indexes and matching them with hydrological and climatic conditions of Mazandaran‘s Rivers, design the convenient and reliable index.
The obtained results showed that qualitative condition of Mazandaran‘s Rivers is unsuitable and appropriate management measures such as population load and excess urban activity in the basin of this river, industrial activities, excessive consumption of chemical fertilizers and pesticides, discharge of rural, urban and industrial wastewater and also solid wastes into the river which have a continuous increasing trend are the main source of river pollution.
So, human factor is the main cause of river pollution. Besides human factors, natural factors such as low rainfall, water consumption for agricultural and industrial purposes, development of agricultural lands at the expense of natural lands wastefulness and finally, all increased the physical and chemical pollution of the river and leads to natural disruption of its biological and bioavailability capacity.
The values of NSFWQI (water quality index of America’s national health organization) were calculated for all stations and all of the stations were located on the level of unsuitable conditions. According to NSFWQI, the best condition was related to the upstream of Haraz River and the worst condition was related to the downstream of Siahrood River.
References
-
Abraham W.R., Megacities as Sources for Pathogenic Bacteria in Rivers, Inter. J. Micro. (2011)
-
APHA, Standard Methods for the Examination of Water and Wastewater. 21st ed, American Public Health Association/ American Water Works Association/Water Environment Federation, Washington, DC, USA,(2005).
-
Banjaka D., J. Nikolic, Hydrochemical characteristics and water quality of the Musnica River catchment, Bosnia and Herzegovina, Hydrological Sciences Journal, 57(3), 562-575,(2012).
-
Brian O., Calculating NSF Water Quality Index, Wilkes University Center for Environmental Quality GeoEnvironmental Sciences and Engineering Department, (2005).
-
Khadem, I.M., Kaluarachchi, J.J., Water quality modeling under hydrologice variability and parameter uncertainty using erosion- scaled export coefficients, Journal of Hydrology, May (2006).
-
Kowalkowskiab T., E. Cukrowskaa, B. HlobsileMkhatshwac, B. Buszewski, Statistical characterisation of water quality in Great Usuthu River (Swaziland), Journal of Environmental Science and Health, Part A. Toxic/Hazardous Substances and Environmental Engineering, 42(8): 1065-1072,(2007).
-
MirMoshtaghi, M., Qualitative investigation of Sefid-rood river water and its zoning according to NSFWQI and OWQI. Journal of Wetlands. 9: (2012).
-
Murhekar H., Assessment of Physico-Chemical Status of Ground Water Samples in Akot city., Research Journal of Chemical Sciences, 1(4), 117-124, July (2011).
-
Muthusamy P., Murugan S. and ManothiSmitha., Removal of Nickel ion from Industrial Waste Water using Maize Cob., ISCA Journal of Biological Sciences, 1(2), 7-11, (2012).
-
Nwajei G. E., Obi–Iyeke G.E. and Okwagi P. Distribution of Selected Trace Metal in Fish Parts from the River Nigeria., Research Journal of Recent Sciences, 1(1), 81-84 Jan. (2012).
-
Oguchi, T., River water quality in Humber catchent: an introduction using GIS – based mapping and analysis, Elsevier, The science of the total environment, 561 9- 29- (2000).
-
Ormsbee, L., Object-oriented modeling approach to surface water quality management, Environmental Modelling & Sofware, 21(5): 689-698 (2006).
-
Parihar S.S., Kumar Ajit, Kumar Ajay, Gupta R.N., Pathak Manoj, ShrivastavArchana and Pandey A.C., Physico- Chemical and Microbiological Analysis of Underground Water in and Around Gwalior City, MP, India, Research Journal of Recent Sciences, 1(6):62-65 (2012).
-
SahaP., Assessment of Water Quality of Damodar River by Water Quality Index Method, Indian Chemical Engineer, 52(2): 145-154, (2010).
-
Silva f., Use of water quality indices to verify the impact of Cordoba city on suquia river, Elsevier , Britain, (2000).
-
Shamsai A, Urei S, Sarang A., Comparative of qualitative indexes and qualitative zoning of Karoon river and Dez river. Journal of Water and Wastewater. 16: 88-97(2006).
-
Wongsupapa C., S. Weesakula, R. Clementea, A. Das Gupta, River basin water quality assessment and management: case study of Tha Chin River Basin, Thailand, Water International, 34(3): 345-361,(2009).
-
Yau, J., Chemical and microbiological qualities of The East River (Dongjiang) water, with particular reference to drinking water supply in Hong Kong, Inter. J. Micro, 52(9): 1441–1450 (2003).


