Carbon Percent in Different Components of Tree Species and Soil Organic Carbon Pool Under These Tree Species in Kashmir Valley
Nasir Rashid Wani1 * and Khwaja Naved Qaisar1
1
Faculty of Forestry,
Sher-e-Kashmir University of Agricultural Sciences and Technology of Kashmir,
Shalimar,
Jammu and Kashmir
India
http://dx.doi.org/10.12944/CWE.9.1.24
Copy the following to cite this article:
Wani N. R, Qaisar K. N. Carbon Per Cent in Different Components of Tree Species and Soil Organic Carbon Pool Under These Tree Species in Kashmir Valley. Curr World Environ 2014;9(1) DOI:http://dx.doi.org/10.12944/CWE.9.1.24
Copy the following to cite this URL:
Wani N. R, Qaisar K. N. Carbon Per Cent in Different Components of Tree Species and Soil Organic Carbon Pool Under These Tree Species in Kashmir Valley. Curr World Environ 2014;9(1). Available from: http://www.cwejournal.org/?p=5867
Download article (pdf)
Citation Manager
Publish History
Trees play a vital role in mitigating the diverse effects of environmental carbon degradation and increasing concentration of carbon dioxide in the atmosphere. Trees promote sequestration of carbon into soil and plant biomass. Therefore tree based land use practices could be viable alternatives to store atmospheric carbon dioxide due to their cost effectiveness, high potential of carbon uptake and associated environmental as well as social benefits (Dhruw et al., 2009). Increasing levels of carbon dioxide in the atmosphere during the past few decades has drawn the attention of the scientific community towards the process of carbon storage and soil organic carbon store. Concentration of atmospheric carbon dioxide can be lowered either by reducing emissions or by enabling the storage of carbon dioxide in the terrestrial ecosystem. Soil plays an important role in the carbon cycle by storing it in the form of soil organic carbon. Most of the carbon enters the ecosystem through the process of photosynthesis in the leaves. After the litter fall, the detritus is decomposed and forms soil organic carbon by microbial process (Post and Kwon, 2000). Soils under tree canopies were found to have greater levels of organic matter and other nutrients. The global forest ecosystem has been reported to account for approximately 90 per cent of annual carbon flux between atmosphere and soil carbon. The carbon held in the upper profile is often the most chemically decomposable and directly exposed to natural and anthropogenic disturbances (IPCC, 2003). Because the input of organic matter is largely from aboveground litter, forest soil organic matter tends to concentrate in the upper soil horizons with roughly half of the soil organic carbon of the top 100 cm of mineral soil being held in the upper 30 cm layer. Therefore estimation of soil organic carbon (SOC) up to the depth of 30 cm is attached with enormous importance. Soil storesmore carbon than is contained in plants and theatmosphere combined. As a matter of fact the world’ssoil contains 4.5 times the amount of carbon held inthe vegetation (Lal, 2004). Gupta and Rao (1994)made first estimate of the organic carbon stock inIndian soils was 24.3 Pg (1 Pg = 1015 g) based on 48soil samples. Worldwide the top soil layer of first 30cm holds 1500 Pg carbon whereas for India it is 9Pg (Bhattacharya et al., 2000). There isa significant proportion of carbon in forest litterlayer. Lower rates of decomposition in the forestscould increase soil organic carbon (SOC) storage insurface soil. The storage of soil organic carbon iscontrolled by balance of carbon input from plantproduction and output through decomposition. Thetotal soil organic content increases with precipitationand clay content decreases with temperature (Jobbagyand Jakson, 2000). The climate affects the soil organiccarbon storage in shallow layer, while the claycontent affects storage in deeper layer of the soil. Theeffect of vegetation type is more important than theprecipitation in the distribution of carbon. Soil onsouth facing slopes at lower elevation containedsignificantly less total organic carbon compared withsoil from north facing slope at higher elevation (Schmidt et al., 1993).
Soil organic matter retains the largest terrestrial reservoir of carbon in the global carbon cycle. Soils store 2.5 to 3.0 times as much carbon that is stored in plants and 2 to 3 times more than the atmospheric carbon as CO2(Davidson et al., 2000). As much it plays a major role in the control of carbon dioxide levels in the atmosphere (Follett et al., 2007). Soil organic matter is in a state of dynamic balance between inputs and outputs of organic carbon. Inputs are largely determined by the forest productivity, the decomposition of litter and its incorporation into the mineral soil whereas rates of organic matter decay and the return of carbon to the atmosphere through respiration control outputs (Pregitzer, 2003). Other losses of soil organic carbon occur through erosion. Deforestation can contribute a large volume of carbon to the atmosphere either by reducing the amount stored in aboveground biomass or increasing the oxidation of soil organic carbon.
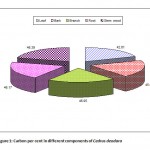 |
Figure 1: Carbon per cent in different components of Cedrus deodara Click here to View Figure |
Forests act as one of the largest carbonsinks and helps to control atmospheric CO2 concentrations (Zhou et al., 2006). Forestsoil contains a globally significant amount of carbon approximatelyhalf of earth’s terrestrial carbon is in forests (1146×1015 g), and of thisamount, about two-thirds is retained in soil pools (Dixon et al., 1994). Temperateforests ecosystems contain a significant amount of soil organic carbonboth globally and regionally (Rasmussen et al., 2006).It has been estimated that present carbon stock in the world’s forestsis 861 ± 66 Pg C, of which 383 ± 30 Pg (44%) is in soil to a depth of 1meter. Temperate forests contribution to world forest carbon stockis 14 % (119 ± 6 Pg), (Pan et al., 2011). Based on average global or regional soil carbondensities estimated in Indian forest soils, it has been calculated thatour soil organic carbon pool ranges from 5.4 to 6.7 Pg (Ravindemath et al., 1997) whileChhabraet al., 2003 had estimated that the total soil organic pool inIndian forests in the top 50 cm and top 1 m soil depth were 4.13 and6.81 Pg, respectively.Soil organic carbon is normally estimated to a depth of 0-30 cm since most of it is present in the top layers and root activity is also concentrated in this horizon (Ravindranath and Ostwald, 2008).
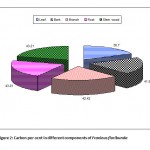 |
Figure 2: Carbon per cent in different components of Fraxinus floribunda Click here to View Figure |
Thus the quantity of SOC in the 0-30cm layer is about twice the amount of carbon in atmospheric carbondioxide (CO2) and three times that in global above ground vegetation(Powlson et al., 2011). It is estimated that the global stock of SOC to a depth of 30 cmis 684-724 Pg (Batjes, 1996). A small change in soil carbon results in a largechange in atmospheric concentration (IPCC, 2000). It is essential to studythe mechanisms and changes of forest SOC to better understand andmitigate climate change (Fang et al., 1996).Mountainous cold-temperate areas like Kashmir have high SOC content butlarge spatial variability, due to variable climate and vegetation (Li et al., 2010). Thisspatial variability has made it difficult to predict the spatial distributionof SOC in forest soils (Fahey et al., 2005).Various studies have reported the influenceof topography, climatic conditions , soil composition , litter quality and its decomposition rate and species compositionor vegetation type on the spatial distribution of SOC (Schulp et al., 2008). Since no scientific systematic study has been undertaken to estimate the carbon per centin different tree components of Cedrus deodara, Fraxinus floribunda and Ulmus wallichiana an importanttree species of Kashmir valley and also soil organic carbon pool under these tree species. Therefore an attempt was made with the objective to estimate the carbon percent of tree components (leaves, branches, wood, bark and roots) and also soil organic carbon pool under temperate conditions of Kashmir.
Materials and Methods
Study Area
The experimental site is located between 74.89oEast longitude and 34.08oNorth latitude at an altitude of about 1600 meters above mean sea level. It is roughly 15 km south east to the Srinagar city and the soil of the site is silt loam and is well drained. The climate is generally temperate with severe winter extending from December to March. The region faces a wide temperature range from a minimum of -4oC in winter to a maximum of 33oC in the summers. The annual precipitation of the area is about 676 mm and most of the precipitation is received in the form of snow during winter months. The present study was carried out in Plantation Block of Faculty of Forestry during the year 2009 and 2010 at Sher-e-Kashmir university of Agricultural sciences and technology of Kashmir (SKUAST-K), Shalimar and was planted during March 1990 having 19 years of age. The tree species planted were Cedrus deodara, Fraxinus floribunda and Ulmus wallichiana were selected for the study.
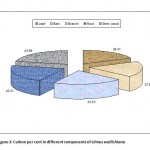 |
Figure 3: Carbon per cent in different components of Ulmus wallichiana Click here to View Figure |
Demarcation and enumeration for measurements
After survey of the entire area, trees of Cedrus deodara, Fraxinus floribunda and Ulmus wallichiana were enumerated according to diameter at breast height at SKUAST-Kashmir. In total 72 trees were enumerated in order to determine the diameter at breast height (DBH). These trees were then classified into three diameter classes viz; 10-20 cm 20-30 cm and 30-40 cm except Fraxinus floribunda whose first diameter class was 0-10 cm owing to their small diameter. The total numbers of trees in three diameter classes were 24 in a quadrat of size 10 x 10 m having spacing of 2 x 2 m. The layout plan of experimental site at SKUAST-Kashmir, Shalimar is given as in (Table 1).
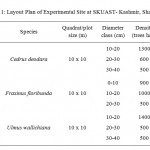 |
Table 1: Layout Plan of Experimental Site at SKUAST- Kashmir, Shalimar Click here to View table |
Estimations Estimation of carbon per cent in different tree components
Carbon per cent was estimated by ash content method described by Negi et al. (2003). In this method oven dried plant components (bark, leaves, stem wood and root) were burnt into muffle furnace at 400oC temperature. The ash content left after burning was weighed and carbon content was calculated by using the following equation: Carbon % = 100 – (ash weight + molecular weight of O2 (53.3) in C6H12O6
Soil analysis
Soil samples were collected by dividing each main plot (10 x 10 m) areainto three sub-areas. Representative soil samples from each sub-area were collected by digging 3 pits of 30 cm wide, 30 cm deep and 50 cm in length. Composite samples from all three sub-areas were obtained. Soil samples were air dried in shade, ground with wooden pestle, passed through a 2 mm sieve mesh and stored in cloth bags for further analysis. The following physico-chemical attributes of the soil samples were determined.
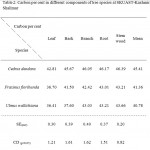 |
Table 2: Carbon per cent in different components of tree species at SKUAST-Kashmir, Shalimar Click here to View table |
Bulk Density (gcm-3)
It was determined by core method (Wilde et al., 1964). In this method, a cylindrical metal sampler was pressed or driven into the soil to the desired depth and was carefully removed to preserve a known volume of sample. The sample was dried at 105oC to 110oC and weighed. Bulk density is the oven dried mass divided by the field volume of the sample.
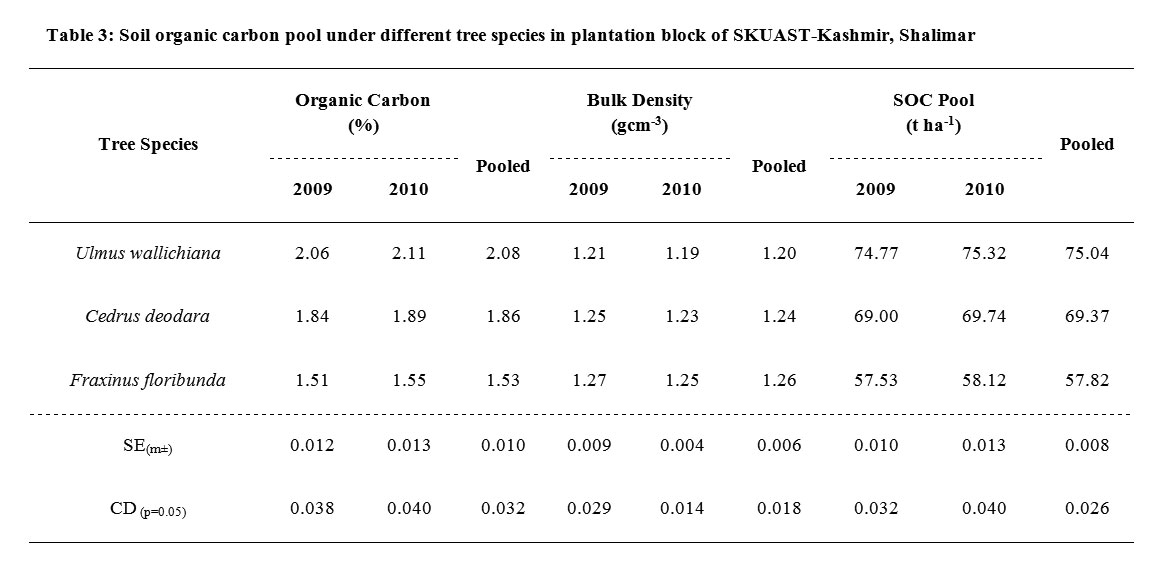 |
Table 3: Soil organic carbon pool under different tree species in plantation block of SKUAST-Kashmir, Shalimar Click here to View table |
Organic Carbon (%)
Organic carbon was determined by Walkley and Black (1934) rapid titration method. In this method 1.0 g soil was digested with a mixture of potassium dichromate (10 ml) and concentrated sulphuric acid (20 ml). The excess of potassium dichromate not reduced by the organic matter of the soil was determined by titration using standard ferrous ammonium sulphate solution in the presence of ortho-phosphoric acid using diphenylamine as an indicator.
Soil Carbon Inventory
The soil organic carbon pool inventory expressed as mega grams per hectare (Mg ha-1) for a specific depth was computed by multiplying the soil organic carbon (g kg-1) with bulk density (g cm-3) and depth in cm (Joao Carlos et al., 2001).
Statistical Analysis
The data were statistically analysed by analysis of variance technique (ANOVA).
Results
Carbon Percent of different Tree Species
The data on carbon per cent in different components of tree species in plantation block of SKUAST-Kashmir is depicted in Table 2 (Fig. 1-3). The data indicates that carbon per cent was significantly more in Cedrus deodara (45.41%) as compared to Fraxinus floribunda (41.36%) and Ulmus wallichiana (40.78%). Moreover, the highest carbon per cent was recorded in stem wood of Cedrus deodara (46.39%) followed by Ulmus wallichiana (43.66%) and Fraxinus floribunda (43.21%), respectively. However, the lowest carbon per cent was observed in leaves of Ulmus wallichiana (36.41%), Fraxinus floribunda (36.7%) and Cedrus deodara (42.81%). Further, carbon per cent in leaf and bark of Fraxinus floribunda was comparatively higher than Ulmus wallichiana.
Soil Organiccarbon Pool under different Tree Species
Perusal of the data presented in (Table 3) reveals that organic carbon content was recorded significantly more in case of Ulmus wallichiana (2.08%) as compared to Cedrus deodara and Fraxinus floribunda which was 1.86 and 1.53 per cent, respectively. However, organic carbon content registered an increasing trend from 2009 to 2010. Similarly the maximum bulk density was observed in case of Fraxinus floribunda (1.26 g cm-3) as compared to rest of the species. Moreover, bulk density demonstrated a decreasing trend from 2009 onwards till 2010. Further the pooled data reveals that soil organic carbon pool was significantly higher in Ulmus wallichiana (75.04 t ha-1) followed by Cedrus deodara (69.37 t ha-1) and Fraxinus floribunda (57.82 t ha-1), respectively. Soil organic carbon pool depicted an increasing trend from 2009 to later half of the study.
Discussion
Carbon Percent of different Tree Species
The data on carbon per cent in different components of tree species (Table 2) indicates that carbon per cent was significantly higher in Cedrus deodara (45.41%) as compared to Fraxinus floribunda (41.36%) and Ulmus wallichiana (40.78%). Negi et al. (2003) has reported that carbon content in different parts of various species depends upon the ash content and the ash content depends upon the amount of structural components. More the structural tissue higher will be the ash content and lower will be the carbon content. Since Cedrus deodara contains less ash content as compared to Fraxinus floribunda and Ulmus wallichiana so its carbon per cent was more as compared to other tree species. Several other workers also support our findings (Shephered and Montagnini, 2001; Dhruw et al., 2009 and Jana et al., 2009). Moreover, carbon per cent was recorded higher in stem wood in all the tree species and it was followed by root, branch, bark and leaf, respectively. Kraenzel et al. (2003) have reported that woody tissues like trunk, roots, branches and twigs have higher carbon concentration than soft tissues like leaves, flowers and fine roots. The results are also in conformity with the findings of Navar (2009) and Fonseca et al. (2012).
Soil Organic Carbon Pool of different Tree Species
The perusal of the data presented in (Table 3) reveals that organic carbon was recorded significantly more in Ulmus wallichiana (2.08%) as compared to Cedrus deodara and Fraxinus floribunda. The higher amount of organic carbon under Ulmus wallichiana trees may be due to addition of more litter fall on the ground surface which keeps on decomposing and adds organic matter to the soil as this species is fast growing as compared to Cedrus deodara and Fraxinus floribunda and also the rate of decomposition is fast (Berthold and Beese, 2002). The results are in line with the findings of Kater et al. (1992), Rhodes (1995) and Sood (1999). The bulk density showed a decreasing trend from 2009 onwards till 2010 and was recorded significantly more in Fraxinus floribunda (1.26 g cm-3) as compared to Cedrus deodara and Ulmus wallichiana. The increase in bulk density under Fraxinus floribunda may be due to decrease in organic carbon which decreases soil porosity resulting in the increase in bulk density. Thus the higher value of bulk density in the soils can also be ascribed to lower soil organic carbon content. These findings are in line with that of Karan et al. (1991), Sharma et al. (1995) and Cihacek and Ulmer (1997). The soil organic carbon pool was significantly higher in Ulmus wallichiana (75.04 t ha-1) as compared to Cedrus deodara (69.37 t ha-1) and Fraxinus floribunda (57.82 t ha-1). The higher amount of soil organic carbon pool under Ulmus wallichiana may be explained in the sense that there is continuous accumulation of leaf litter on the surface which keeps on decomposing and thus enriches the soil surface. The values in the present study are well within the reported range. Chhabra and Dadhwal (2005) reported the soil organic carbon pool in the range of 38.9-181.7 t ha-1 in Kashmir valley and similar results have also been reported earlier by many other workers (Negi and Gupta, 2010; Gupta and Sharma, 2010 and Gupta, 2011).
Conclusion
In light of the present investigations following conclusions could be drawn:
- Cedrus deodara among the three tree species recorded the maximum carbon percent and it was followed by Fraxinus floribunda and Ulmus wallichiana respectively.
- Cedrus deodara being a slow growing conifer will provide a long term carbon fixation capacity as compared to fast growing species like Fraxinus floribunda and Ulmus wallichianawhich provide revenues in the short term.
- Thus it can be said that conifers are more efficient in carbon accumulation than deciduous tree species.
- The pooled results revealed that organic carbon was significantly higher in Ulmus wallichiana as compared to Cedrus deodaraand Fraxinus floribunda. However the bulk density was significantly higher in Fraxinusfloribunda as compared to Cedrus deodaraand Ulmuswallichiana. Moreover the results further revealed that soil organic carbon pool was significantly higher in Ulmus wallichianaas compared to Cedrus deodaraand Fraxinus floribunda.
References
- Batjes, N.H. 1996. Total carbon and nitrogen in the soils of the world. European Journal of Soil Science.47: 151-163.
- Bhattacharya, T., Pal, D.K., Mondal, C. and Velayutham, M. 2000. Organic carbon stock in Indian soils and their geographical distribution. CurrentScience. 79(5):655-660.
- Berthold, D. and Beese, F. 2002. Carbon storage in soils after afforestation in relation to management. Forstund Holz.57(13/14):417-420.
- Cihacek, L.J. and Ulmer, M.G. 1997. Effect of tillage on profile soil carbon distribution in the northern great plains of the U.S. In:Soil Management and Green House Effect. CRC press, Boca Raton, pp 83-91.
- Chhabra, A., Palria, S. and Dadhwal, P.K. 2003. Soil organic pool in Indian forests. ForestEcology and Management.173: 187-199.
- Chhabra, A and Dadhwal, V. K. 2005. Forest soil organic carbon pool : An estimate and review of Indian studies. Indian Forester.131 (2):201-214.
- Dixon, R.K., Brown, S., Houghton, R.A., Solomon, A.M. and Trexler, M.C. 1994. Carbon pools and flux of global forest ecosystems. Science. 263: 185-190.
- Davidson, E.A., Trumbore, S.E. and Amudson, R. 2000. Soil warming and organic carbon content. Nature. 408: 789-790.
- Dhruw, S.K, Singh, L.J. and Singh, A.K. 2009. Storage and sequestration of carbon by leguminous and non-leguminous trees on red lateritic soil of Chhattisgarh. Indian Forester.135 (4):531-538.
- Fang, J.Y., Liu, G.H. and Xu, S.L. 1996. Soil carbon pool in China and its global significance. Journal of Environmental Sciences. 8: 249-254.
- Fahey, T.J., Siccama, T.G., Driscoll, C.T., Likens, G.E. and Campbell, J. 2005.The biogeochemistry of carbon at Hubbard Brook. Biogeochemistry. 75: 109-176.
- Follett, R.F., Paul, E.A. and Pruessner, E.G. 2007. Soil carbon dynamics during a long term incubation study involving C13 and C14 measurements. Soil Science. 172(3): 189-208.
- Fonseca, W., Alice, F.E. and Benayas, J. M. R. 2012. Carbon accumulation and aboveground and belowground biomass and soil of different age native forest plantations in the humid tropical low lands of Costa Rica. New Forests. 43:197-211.
- Gupta, R.K. and Rao, D.L.N. 1994. Potential of wastelands for sequestering carbon by reforestation. Current Science.66(5): 378-380.
- Gupta, M.K. and Sharma, S.D. 2010. Soil organic carbon pool under different land uses in Champawat district of Uttarakhand. Annals of Forestry.18(2):189-196.
- Gupta, M.K. 2011. Soil organic carbon pool under different land uses in Haridwar district of Uttarakhand. Indian Forester.137(1):105-112.
- IPCC, 2000. Land use, land-use change and forestry, IPCC Special Report. Cambridge university Press, United Kingdom.
- IPCC, 2003. Good Practice Guidance for Land use, Land use Change and Forestry. Published by the institute for global environmental strategies for the IPCC. Publishers institute for global environmental strategies, Japan.
- Jobbagy, E.G. and Jackson, R.B. 2000. The vertical distribution of soil organic carbon and its relation to climate and vegetation. Ecological Applications.10(2):423–436.
- Joao carlos, M.S., Carlos, C.C., Warren, A.D. and Rattan, L. 2001. Organic matter dynamics and carbon sequestration rates for a tillage chronosequence in a Brazilian oxisol. Soil Science Society of American Journal.65:1486-1499.
- Jana, B.K, Biswas, S, Majumder, M, Roy, P.K and Mazumdar, A. 2009. Carbon sequestration rate and aboveground biomass carbon potential of four young species. Journal of Ecology and Natural Environment. 1(2):15-24.
- Karan, S., Bhandari, A.R. and Tomar, K.P. 1991. Morphology genesis and classification of some soils of Northwestern Himalayas. Journal of Indian Society for Soil Science.39:139-146.
- Kater, L.J.M., Kante, S. and Budelman, A. 1992. Karite (Vitellaria paradoxa) and Nere (Parkia biglobosa) associated with crops in south Mali. Agroforestry Systems.18:89-105.
- Kraenzel, M., Castillo, A., Moore, T. and Potuin, C. 2003. Carbon storage of harvest age-teak (Tectona grandis) plantations, Panama. Forest Ecology and Management173: 213-225.
- Lal, S. 2004. Studies on biomass production of Khair (Acacia catechu) grown in the mid hills of Himachal Pradesh. M.Sc. thesis UHF, Nauni, Solan(H.P), India.
- Li, P., Wang, Q., Endo, T., Zhao, X. and Kakubari, Y. 2010. Soil organic carbon stock is closely related to aboveground vegetation properties in cold-temperatemountainous forests. Geoderma. 154: 407-415.
- Negi, J.D.S., Manhas, R.K. and Chauhan, P.S. 2003. Carbon allocation in different components of some tree species of India : A new approach for carbon estimation. Current Science. 85(11):1528-1531.
- Navar, J. 2009. Allometric equations for tree species and carbon stocks for forests of Northwestern Mexico. Forest Ecology and Management.257:427-434.
- Negi, S.S. and Gupta, M.K. 2010. Soil organic carbon store under different land use systems in Giri catchment of Himachal Pradesh. Indian Forester.136(9):1147-1154.
- Post, W.M. and Kwon, K.C. 2000. Soil carbon sequestration and land use change, process and potential. Global Change Biology. 6: 317-327.
- Pregitzer, K.S. 2003. Woody plants, carbon allocation and fine roots. New Phytologist.158 (3):421-424.
- Pan, Y., Birdsey, R.A., Fang, J., Houghton, R. and Kauppi, P.E. 2011. A large and persistent carbon sinks in the world’s forests. Science. 333: 988-993.
- Powlson, D.S., Whitemore, A.P. and Goulding, K.W.T. 2011. Soil carbon sequestration to mitigate climate change: a critical re-examination to identify the true and the false. European Journal of Soil Science. 62: 42-55.
- Rhodes, C. 1995. Seasonal pattern of nitrogen mineralization and soil moisture beneath Faidherbia albida in central Malawi. Agroforestry Systems. 29:133-145.
- Ravindernath, N.H., Somashekhar, B.S. and Gadgil, M. 1997. Carbon flows in Indian forests. Climate Change. 35: 297-320.
- Rasmussen, C., Southard, R.J. and Horwath, W.R. 2006. Mineral control of organic carbon mineralization in a range of temperate coniferous forests. Global Change Biology.12: 834-847.
- Ravindranath, N.H. and Ostwald, M. 2008. Carbon Inventory Methods Handbook for greenhouse gas inventory, carbon mitigation and round-wood production projects. Springer. 165-166.
- Schmidt, M.G., Schreier, H. and Shah, P.B. 1993. Factors affecting the nutrient status of forest sites in a mountain watershed in Nepal. Journal of Soil Science. 44: 417-425.
- Sharma, P.K., Verma, T.S. and Bhagat, R.M. 1995. Soil structure improvement with the addition of Lantana camara biomass in rice wheat cropping. Soil Use and Management.11:199-203.
- Sood, R. 1999. Tree-crop interaction studies in Agri-horticulture system. M.Sc. thesis, Dr. Y. S. Parmar University of Horticulture and Forestry, Nauni, Solan, H.P, India.
- Shepherd, D. and Montagnini, F. 2001. Aboveground carbon sequestration in the humid tropics. Journal of Tropical Forest Science.13 (3):450-459.
- Schulp, C.J.E., Nabuurs, G.J.,Verburg, P.H. and Waal, R.W. 2008. Effect of tree species on carbon stocks in forest floor and mineral soil and implications forsoil carbon inventories. Forest Ecology and Management. 256: 482-490.
- Walkey, A. and Black, C.A. 1934. An examination of the method for determining soil organic matter and a proposed modification of the chromic acid titration method. Soil Science.37(16): 29-39.
- Wilde, S.A., Viogt., G.K. and Iyer, J.G. 1964. Soil and plant analysis for tree culture. Oxford publishing house, Calcutta, India.
- Zhou, G.Y., Liu, S.G., Li, Z., Zhang, D.Q. and Tang, X.L. 2006.Old-growth forests can accumulate carbon in soils. Science. 314: 1417.


