Distribution of Sand Particles along the shoreline of Lake Biwa in Shiga Prefecture and Considerations from Lake Biwa and Seto Inland Sea, Japan
Kunio Ueda1 *
1
Department of Environmental Science,
The University of Shiga Prefecture,
Hikone,
522-8533
Japan
DOI: http://dx.doi.org/10.12944/CWE.9.1.03
The development of sand littoral zones is critical to supporting specific species in lakes and oceans. The construction of dams on rivers changes the distribution of sediments in littoral zones, and the relationship between dam construction on rivers, the inflow of small particles and increased eutrophication and red tide occurrences was demonstrated for Lake Biwa using public data. Many dams were constructed on rivers around Lake Biwa after the Second World War, and the old and new Araizeki dams were constructed on the outflowing Seta River, restricting flow and increasing the tendency of small particles to be deposited on the floor of Lake Biwa. Inouchi (J. of Geol. Society of Japan, Vol. 88, No. 8, 1982, pp. 665-681) reported the distribution of seafloor sediment particle sizes in the Seto Inland Sea. Inouchi showed several fan-shaped distributions of sediment particles centered at the mouths of rivers. After many dams were constructed on the rivers in the period following the Second World War, particles smaller than MdΦ 4 to 6 were thought to increase in the rivers, and these smaller particles were deposited farther offshore from the river mouth if tidal currents were faster than 0.5 to 1.0 knots. Areas of the Seto Inland Sea in 1975 that were affected by silting and subsequent red tide blooms include Hiroshima Bay, Hiuti-nada, Harima-nada and Osaka Bay. These findings and similar patterns between the Seto Inland Sea and Lake Biwa support my hypothesis that the influx of mud due to the construction of dams brings about eutrophication and red tides.
Copy the following to cite this article:
Ueda K. Distribution of Sand Particles along the shoreline of Lake Biwa in Shiga Prefecture and Considerations from Lake Biwa and Seto Inland Sea, Japan. Curr World Environ 2014;9(1) DOI:http://dx.doi.org/10.12944/CWE.9.1.03
Copy the following to cite this URL:
Ueda K. Distribution of Sand Particles along the shoreline of Lake Biwa in Shiga Prefecture and Considerations from Lake Biwa and Seto Inland Sea, Japan. Curr World Environ 2014;9(1). Available from: http://www.cwejournal.org/?p=5725
Download article (pdf) Citation Manager Publish History
Select type of program for download
| Endnote EndNote format (Mac & Win) | |
| Reference Manager Ris format (Win only) | |
| Procite Ris format (Win only) | |
| Medlars Format | |
| RefWorks Format RefWorks format (Mac & Win) | |
| BibTex Format BibTex format (Mac & Win) |
Article Publishing History
| Received: | 2014-02-10 |
|---|---|
| Accepted: | 2014-03-03 |
Introduction
Sand beaches and sand-bottomed shallow sea areas form important habitat for fishes, shellfishes, shrimps, crabs and the larvae of some insects because these zones are rich in dissolved oxygen, which these species depend upon for respiration.1 Therefore sand beaches are important for fish and biodiversity. In contrast, bays and harbors with vertical sea walls tend to have more bottom sediments and levels of dissolved oxygen that are lower than those found in these shallow sea areas with sand.1
Sand beaches are not sufficiently researched to understand the source of the sand, formation processes, and the effects of dredging and dams. There are sand beaches along the lakeshore of Lake Biwa. The average water level of Lake Biwa decreased about 50 cm after the Seta River was dredged in 1898 to 1906 and the old Araizeki Dam was constructed in 1905. The average water level of Lake Biwa decreased about 40 cm again after 1939 when the Seta River was dredged again.2 It is thought that the present sand beaches of Lake Biwa are in the condition of those before 1898 because new particles are rarely deposited on beaches from rivers on which dams are constructed.
Here, sand beach formation was examined by collecting sand samples from the lakeshore of Lake Biwa and investigating the particle size and the influence of dam construction on siltation and red tide occurrences in Lake Biwa.
Materials and Methods
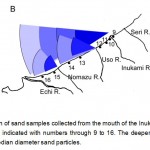
Sediment samples were collected on October 2, 2007 from along the shoreline of Lake Biwa (Figs. 1, 3 and 5). The water level at the nearest sampling sites was 0.4 m lower than the zero water level determined after the final dredging of the Seta River. Figure 3 shows the sampling locations from south of the Ane River to Hikone City and Fig. 5 shows the sampling locations from south of the Inukami River to north of the Echi River. Sand was sampled in layers from under the surface (depth of 5 cm) to a depth of 30 cm. After air-drying, 500-g samples of the collected sand were sieved through openings of 2, 1.4, 1.0, 0.5 and 0.25 mm, forming six size fractions: >2 mm, 2 to 1.4 mm, 1.4 to 1.0 mm, 1.0 to 0.5 mm, 0.5 to 0.25 mm and £0.25 mm. The weight of the each fraction was determined.
The average water level of Lake Biwa was determined from the Ministry of Land, Infrastructure, Transport and Tourism, Kinki Regional Development Bureau website2 by taking the average of the water level at five points around Lake Biwa.3 The number of red tide occurrences in Lake Biwa was obtained from a website created and maintained by the Lake Biwa/Yodo River Water Quality Preservation Organization.4 Information about dam construction in Shiga Prefecture was obtained from the website of The Japan Dam Foundation.5
The distribution of seafloor sediments in the Seto Inland Sea was obtained over the period of 1974 to 1976 from the paper by Inouchi.6 The boundaries in the sea area of the Seto Inland Sea were obtained from the International Emecs Center.7 The direction and flow rate of tides in the Seto Inland Sea were obtained from the website created and maintained by the Hydrographic and Oceanographic Department of the Japan Coast Guard.8 Information about dams in Japan was obtained from a website by The Japan Dam Foundation.5 The locations of red tide occurrences in the Seto Inland Sea in 1975 were obtained from the website of the Ministry of the Environment.9
|
|
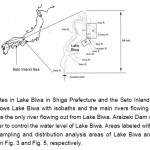
Figure 1: Study sites in Lake Biwa in Shiga Prefecture and the Seto Inland Sea in western Japan. Inset shows Lake Biwa with isobaths and the main rivers flowing into Lake Biwa. The Seta River is the only river flowing out from Lake Biwa. Araizeki Dam was constructed on the Seta River to control the water level of Lake Biwa. Areas labeled with letters A and B indicate sand sampling and distribution analysis areas of Lake Biwa and are shown in enlarged views in Fig. 3 and Fig. 5, respectively. |
Results
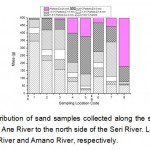
For sampling sites 1 through 5 in Fig. 4, it is clear that the proportion of particles >2.0 mm becomes greater for sampling locations nearer the mouth of the Ane River. In contrast, the proportion of particles in the 2.0 to 0.25 mm and £0.25 mm diameter size classes becomes smaller nearer the mouth of the Ane River. However, for site 6, the proportion of particles in the >2 mm fraction is greater than that at site 5. As the sampling locations become more distant from the Amano River (sites 6 to 8), sand particles >2 mm occupy a smaller and smaller proportion, and sand particles of 2.0 to 0.25 mm and £0.25 mm diameter occupy larger and larger proportions. In particular, particles £0.25 mm in diameter occupy an increasing proportion from site 6 to 7 and a markedly larger proportion at site 8. The inflow of the Amano River between sites 5 and 6 is expected to disturb the distribution pattern of sand particles produced by the Ane River and form a new sand flow pattern from the Amano River.
|
|
Figure 2: The size distribution of sand samples collected along the shoreline of Lake Biwa from the mouth of the |
|
|
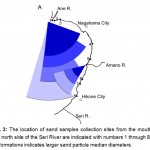
Figure 3: The location of sand samples collection sites from the mouth of the Ane River to the north side of the Seri River are indicated with numbers 1 through 8. The deeper blue of fan formations indicates larger sand particle median diameters. |
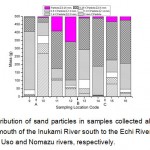
As the sampling location becomes distant from the Inukami River (sites 2 to 6 in Fig. 5), the percentage of sand particles with diameter > 2 mm becomes smaller and smaller. However, at site 5, the proportions of sand particles with a diameter of 1.4 to 1.0 mm and 1.0 to 0.5 mm became greater than at site 4. The inflow of the Uso River lies between sites 4 and 5. Similarly, the proportion of sand particles with diameter > 2.0 mm at site 7 is greater than that at lsite 6. The inflow of the Nomazu River lies between sites 6 and 7. It is thought that flow from the Uso River and Nomazu River disturbed the sand distribution pattern set up by the Inukami River. No dam was built on the Nomazu River, but the Uso River Dam was completed in 1979 with a surface area of 17 ha. However, the influence of the Uso River Dam upon the old sand littoral zones was estimated to be slight because the new zero water level of Lake Biwa was about 1.0 m lower than before the dredging of the Seta River.
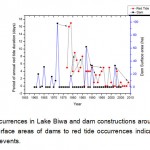
The relationship between dam construction and red tide occurrences in Lake Biwa is shown in Fig. 6. There is the tendency for red tides to occur after the completion of dams. Red tides occurred and increased 5 years after the construction of the Eigenji Dam (98 ha) in 1972 on the Echi River. Similarly, red tides increased from 1981 to 1985 after completion of the Uso River Dam (17 ha) in 1979 on the Uso River. Red tides increased in the same year as the Aozuti Dam (year of completion, surface area; 1989, 62 ha) was constructed on the Yasu River. Following construction of the Zao Dam (1990, 33 ha) on the Hino River, red tides increased from 1992 to 1996. Following construction of the Ane River Dam (2002, 33 ha), red tides increased from 2003 to 2009.
|
|
Figure 4: The size distribution of sand particles in samples collected along the shoreline of Lake Biwa from the mouth of the Inukami River south to the Echi |
|
|
Figure 5: The location of sand samples collected from |
|
|
Figure 6: Red tide occurrences in Lake Biwa and dam constructions around Lake Biwa. The arrows from the surface areas of dams to red tide occurrences indicate the relationship between these two events. |
Discussion
If a particle of sand is taken to be a spherical object, the settling velocity of the particle, Vs (m/s), is given by Stokes’ law as follows

where ρp = mass density of the particle (kg/m3), ρf = mass density of the fluid (kg/m3), μ = dynamic viscosity (Ns/m2), g = gravitational acceleration (m/s2), and R = radius of the spherical object (m). Generally, the particles of sand, silt and clay are considered to be spherical. Eq. 1 expresses that Vs becomes slower the smaller the particle radius. Sand settles faster than silt, which settles faster than clay. These particles are carried into the sea or lake with the same speed, but the smaller particles are carried farther from the river mouth before settling out of the water column.
The flow velocity of rivers shows daily variability, and likewise, the sand particles carried by the river show a range of flow velocities. Consequently, bigger particles of sand are deposited nearer the mouth of river, and the pattern of particle deposition is fan-shaped.
Based on sampling and size pattern analysis of the sediments taken along the shoreline, the particle deposition pattern can be calculated by Stoke’s Law (Fig. 3, Fig. 5). The sediment particle distribution pattern is fan-shaped but with an oval rather than a half circle shape due to the range of depths of Lake Biwa from 0 to 90 m and due to the differences in the sizes of particles. Smaller sand particles require longer to settle to the bottom and the distance carried before settling out is longer. Particles with the same radius are carried farther before settling where Lake Biwa is deeper.
Araizeki Dam on the Seta River in Shiga Prefecture was reconstructed in 1961. The new dam was different from the old dam in several aspects. Concrete walls replaced wood blocks, and the new dam could completely shut off flow in the river in only 30 min, while 2 days were required for the old dam. The new dam can control the river flow rate from zero to 600 m3/s, while the old dam controlled the river flow rate from zero to 400 m3/s.
Dams were constructed on rivers flowing into Lake Biwa after the Second World War. The main dams constructed on rivers flowing into Lake Biwa are Inukami Dam (1946, 35 ha) on the Inukami River, Yasu River Dam (1951, 50 ha) on the Yasu River, Eigenji Dam (1972, 98 ha) on the Echi River, Hino River Dam (1965, 29 ha) on the Hino River and Uso River Dam (1979, 17 ha) on the Uso River (Fig. 1). After these dams were completed, mud was readily deposited in Lake Biwa due to flow that was slow by reducing or closing the new Araizeki Dam. As the new Araizeki Dam was more effective than the old dam for closing off the Seta River, mud was more readily deposited in Lake Biwa. Mitamura et al reported in 2007 that almost the entire floor of Lake Biwa was covered by particles smaller than MdΦ 4.10 MdΦ is the median particle diameter and is defined by geology to be equal to the Log2D where D is a median diameter (mm) of particles. For D of 2-2 mm, MDΦ is 2.
In my previous paper, I showed the relationship between dam construction and red tide occurrence in four Japanese Bays.11 Similarly to these bays, eutrophication and red tides in Lake Biwa was considered to be caused by mud particles flowing in from the construction dams (Fig. 6).
Seto Inland Sea:
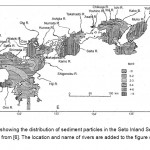
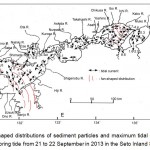
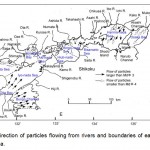
In the Seto Inland Sea, Inouchi6 determined the distribution patterns of sediment deposition (Fig. 7) and showed the distribution patterns of deposition to be fan-shaped and centered at the mouths of rivers (red lines in Fig. 8). The direction and maximum flow rates of tidal currents are indicated in Fig. 8.
In Fig. 9, the flow directions of particles larger than MdΦ 3 or smaller than MdΦ 4 are indicated, and the boundaries of the nadas in the Seto Inland Sea are indicated.
|
|
Figure 7: Map showing the distribution of sediment |
|
|
Figure 8: Fan-shaped distributions of sediment |
Suo-Nada Sea
In the Suo-nada Sea there are two fan-shaped distributions of surface sediments centered at the Hushino, Ono and/or Oita rivers (Fig. 8 and Fig. 9). Grain size of the sediments became smaller the more distant from the mouth of the rivers. No dams were constructed on the Hushino River until 1983 when the Ichinosaka Dam was constructed, followed by the Aratani Dam in 1987. Following what was learned in Lake Biwa, a large quantity of sands was estimated to have been carried into the Suo-nada Sea by the Hushino River until 1983, and a fan-shaped distribution of sand was formed in the Suo-nada Sea.
Based on the particle size distribution patterns (Fig. 7), particles sized less than MdΦ 6 flowed out from the Kotou and Koya rivers. Those particles were carried to the Buzen Sea and deposited there. From Fig. 6 and Fig. 8, it is clear that particles smaller than MdΦ 6 were carried out from the Kotou River and Koya River and reached the Buzen Sea after the completion of the Kotou River Dam (1948, 249 ha) and Koya River Dam (1955, 161 ha). However, it is estimated that when the flow velocity from the Kotou River and Koya River are slow, particles are carried to the Kanmon channel by tidal currents because there are fast tidal currents flowing from the Bungo Channel to the Kanmon Channel (Fig. 8). In the Buzen Sea, the maximum tidal current is 0.3 knots and in the center of the Suo-nada Sea, the maximum tidal current ranges from 0.6 to 1.8 knots.
In my previous paper,12 I showed that part of mud carried into the Suo-nada Sea by the Saba River after completion of the Saba River Dam (1955, 116 ha), was estimated to be concentrated to the east sea area along the coast by the longshore current. As shown by Inouchi6 in Fig. 7, particles of sizes MdΦ 4 to 6 are distributed to the east of the mouth of Saba River along the coast. This result matches the determined pattern obtained from my paper.12
The mud flowed quickly from the mouth of the Saba River and is thought to have flowed westward and/or eastward where it dissipated in the Suo-nada Sea after reaching the middle of the Suo-nada Sea.
No dams were constructed on the Yamakuni and Yakkan rivers until 1976, which is after the sample collection for the research reported by Inouchi.6 These two rivers were estimated to have carried a large amount of sand into the Suo-nada Sea until 1976, but the Hushino River is shown to have carried more sand into the Suo-nada Sea than these two rivers based on the data shown in Fig. 7. It is estimated that these sediments were cumulatively transported and deposited for the long time in this sea area by the Hushino River. The reason for this difference in results may be due to differences in the composition of rocks comprising the mountains of the basins; further consideration of the geology of the basins is needed. Two dams were constructed on Hushino River: the Ichinosaka Dam (1983, 14 ha) and Aratani Dam (1987, 25 ha).
|
|
Figure 9: Flow direction of particles flowing |
|
|
Figure 10: Locations of red tide events observed in |
Iyo-Nada Sea
There is one large fan-shaped area offshore of Beppu Bay that is centered in Beppu Bay. The fan-shaped distribution of particles is estimated to be carried into Beppu Bay by the Oita and/or Ono rivers before dam construction (Figs. 7-9).
Three dams were constructed on the Oita River before 1976: Serikawa Dam (1956, 135 ha), Shinohara Dam (1958, 21 ha) and Wakasugibousai Dam (1965, 8 ha). On the Ono River, no dams were constructed until 2000. Therefore, it is supposed that most of the particles smaller than MdΦ 4 was carried to the Iyo-nada Sea by the Oita River through these three dams prior to 1976. In Beppu Bay, particles smaller than MdΦ 6 were deposited (Fig. 7) because tidal currents were slow. But the sea current outside of Beppu Bay is very fast and flow velocities reached 1.9 to 3.0 knots near the Bungo Channel. Particles with diameters smaller than MdΦ 6 are projected to be carried outside of the Iyo-nada Sea.
Bungo Channel
In Bungo Channel, there are two fan-shaped sediment distributions centered on the Usuki and Banjo rivers. Grain size of sediments becomes smaller for locations more distant from the mouth of these rivers. No dams were constructed on these two rivers until 1976. Particles smaller than MdΦ 6 were not observed at the mouths of these rivers.
Hiroshima Bay
In Hiroshima Bay, particles smaller than MdΦ 6 are deposited (Fig. 7), and the fastest sea current is 0.3 to 0.4 knots. However, outside of Hiroshima Bay, the sea current becomes 1.2 to 1.8 knots, and particles with MdΦ <0, MdΦ 0-2 and MdΦ 2-3 are deposited. There are three big rivers that flow into Hiroshima Bay: Ota River, Oze River and Nishiki River. On the Ota River, Tarutoko Dam (1957, 180 ha), Oudomari Dam (1959, 144 ha) and Uga Dam (1959, 8 ha) were built. On the Oze River, Iinoyama Dam (1932, 36 ha), Watanose Dam (1956, 97 ha) and Ozegawa Dam (1964, 90 ha) were constructed and on Nishiki River, Sugano Dam (1965, 302 ha) and Mizukosi Dam (1965, 14 ha) were constructed before 1976. The dams on these three rivers are thought to be responsible for depositing particles smaller than MdΦ 6 in Hiroshima Bay.
It is likely that large particles were carried into Hiroshima Bay by these rivers before the construction of dams on these rivers, and the observed fan-shaped sediment distribution patterns were like those estimated in Lake Biwa by sieving sediments. Following dam construction on these rivers, particles smaller than MdΦ 6 began to be deposited in Hiroshima Bay. It is supposed that coarse particles were distributed first and particles smaller than MdΦ 6 were subsequently deposited in Hiroshima Bay. Therefore, this is demonstrated that the particles in size classes of larger than MdΦ 0, MdΦ 0 to 2 and MdΦ 2 to 3 would be observed farther south than the area where particles smaller than MdΦ 6 would be deposited (Fig. 7).
Hiuti-nada Sea, Bingo-nada Sea and Bisanseto Sea
In Hiuti-nada Sea and Bingo-nada Sea, particles smaller than MdΦ 6 are deposited. Two big rivers, the Ashida and Takahashi rivers, flow into the sea in this area. Seven dams were built on the Takahashi River, and the total surface area of dams built before 1976 on the Takahashi River reached 601 ha. Of particular note, the Nariwagawa Dam built in 1968 was the biggest with a surface area of 360 ha. Two dams were built on the Ashida River before 1976, and the total surface area of these two dams was 86 ha. It is estimated that particles smaller than MdΦ 6 were carried into the sea area and deposited after these dams were completed, based on the maximum velocity of the tidal current of 0.4 to 1.1 knots in the area offshore of the mouth of Takahashi River (Fig. 8). Particles smaller than MdΦ 6 carried by the Takahashi River are readily spread east from the river and into the Harima-nada Sea by the fast tidal current (1.4-1.7 knots) (Fig. 8). In contrast, particles carried to the west of the river mouth are soon deposited because the current velocity is slow (0.1-0.2 knots) in the Bingo-nada Sea and the Hiuti-nada Sea (Fig. 8). Particles smaller than MdΦ 6 were carried by the Ashida River into the sea in this area after the two dams were completed.
Harima-nada Sea
One fan-shaped distribution of sediments was observed in the Harima-nada Sea. The center of the fan is centered at the mouth of the Kako River. This district is similar to that of the Suo-nada Sea, as sediment grain sizes decrease for more depositions more distant from the mouth of the Kako River. On the Kako River, five dams were constructed before 1976: Kamogawa Dam (1951, 54 ha), Hunaki Dam (1959, 16 ha), First Heiso Dam (1969, 100 ha), Tubaichi Dam (1971, 9 ha), Hachimandani Dam (1973, 9 ha). A large amount of mud is hypothesized to have poured from the Kako River into the Harima-nada Sea. However, the fast tidal current (maximum, 1.6-2.0 knots at the mouth of the Kako River would carry the mud far from the mouth of the Kako River. It is thought that one pattern is going eastward into Osaka Bay through the Akashi Channel, another is going westward into Bisanseto Sea, and another is going into the southern half of the Harima-nada Sea. The tidal current in the southern half of the Harima-nada Sea is slow and becomes 0.3 to 0.5 knots at maximum, such that mud from the Kako River is deposited in the southern half of Harima-nada Sea (Fig. 7, Fig. 8). Two dams were constructed on the Ichi River before 1976 : Ikuno Dam (1972, 90 ha) and Kurokawa Dam (1974, 109 ha). Hikihara Dam (88 ha) was constructed on the Ibo River in 1957. Particles smaller than MdΦ 6 are thought to be carried into the Harima-nada Sea and reach the coasts of Shikoku and Awaji Island by the same mechanism as for the effluent of the Kako River.
Osaka Bay
Three big rivers flow into Osaka Bay: Muko River, Yodo River and Yamato River. The Yodo River is a major river with three large tributaries: Kizu River, Katura River and Uji River. The Senkari Dam was constructed on the Muko River in 1919 and has a surface area of 112 ha. Approximately 12 dams were completed on the Yodo River before 1976. On the other rivers, the Segi Dam (1951, 48 ha) was constructed on the Katura River, the Amagase Dam (1964, 188 ha) was constructed on the Uji River and the Takayama Dam (1968, 260 ha) was constructed on the Kizu River. After the construction of these dams, particles smaller than MdΦ 6 carried into Osaka Bay were soon deposited due to a maximum tidal current under 0.4 knots in the eastern half of Osaka Bay.
Relationship between particle size and red tide
The geological definition of mud is having a particle size smaller than 1/16 mm. It was estimated that nutrients associated with the mud brought about eutrophication in these sea areas. Previous papers have shown that red tide tends to occur in areas influenced by the influx of mud carried by rivers on which a dam has been newly constructed.11, 12 The results obtained in this paper are consistent with the results of these studies.
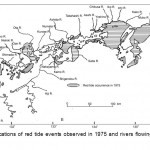
As shown in Fig. 7 and 10, red tide occurred in the areas where particles smaller than MdΦ 4 were deposited, such as in Osaka Bay, Harima-nada Sea, Hiuti-nada Sea, Hiroshima Bay, Oita Bay and Buzen Sea. These findings support my hypothesis that red tide is caused by mud carried out to sea by rivers on which dams are newly constructed11, 12 and demonstrate that heavier loading of fine particles (MdΦ < 4) is observed in the sea areas after the completion of a dam.
There are some exceptions to the pattern of sea areas with red tide occurrence coinciding with small particle size, as shown in Fig. 10. Red tide occurrences indicated by a, b, c and d in Fig. 10 coincide with areas where the primary deposits are not particles smaller than MdΦ 4. It is considered that red tide blooms observed in these areas were carried in from active blooms in other areas. The red tide indicated by e is thought to have been carried in from Hiroshima Bay. The red tides indicated by a to d were thought to have been carried from red tide occurrences farther to the north. The red tide indicated by f is thought to have been carried from the west. However, further consideration of the mechanisms is needed to explain these phenomena.
It is considered from these results that dam construction on rivers causes siltation and red tide occurrences in Lake Biwa and Seto Inland Sea.
Conclusion
An examination of sediment samples along the shoreline of Lake Biwa showed that the distribution of particles follows Stokes’ Law and forms a fan-shaped pattern centered on the river mouth. Similar patterns could be detected in Inouchi’s6 research on sediment distribution patterns in the Seto Inland Sea. Based on samples taken before and after the construction of dams on the inflowing rivers, newly constructed dams were thought to carry greater quantities of particles smaller than MdΦ 4 (geologically speaking, mud), and the deposition of these smaller particles was governed by tidal current velocity with faster current carrying the particles farther from the shore.
The locations of red tide occurrences observed in the Seto Inland Sea in 1975 largely coincided with areas in which mud had been found to be deposited by research conducted by Inouchi in 1974 to 1976. These findings support my hypothesis that red tides are caused in part by mud carried by rivers on which dams have been newly constructed.
References
- K. Ueda, Modeling of Dissolved Oxygen Concentration Recovery in Water Bodies and Application to Hypoxic Water Bodies, World Environment, 3(2), 52-59(2013), Doi: 10.5923/j.env.20130302.03
- Kinki Regional Development Bureau Biwako Office, Ministry of Land, Infrastructure, Transport and Tourism, Japan.(http://www.yodoriver.org/kaigi/biwa/1st/pdf/siryou03/pdf/biwako1-1.pdf, 2013/11/12)
- Kinki Regional Development Bureau Biwako Office, Ministry of Land, Infrastructure, Transport and Tourism, Japan. (http://www.biwakokasen.go.jp/graph2/)
- Lake Biwa-Yodo River Water Quality Preservation Organization.(http://www.byq.or.jp/kankyo/k_04.html, 2013/12/13)
- The Japan Dam Foundation. (http://damnet.or.jp/Dambinran/binran/TopIndex.html, 2013/12/13)
- Y. Inouchi, Distribution of Bottom Sediments in the Seto Inland Sea (The Influence of Tidal Currents on the Distribution of Bottom Sediments), J. of Geol. Society of Japan, 88(8), 665-681(1982). (in Japanese with English Summary)
- International EMECS Center, Environmental Conservation of the Seto Inland Sea, Asahi Print Co., Ltd. Nishinomiya, Hyogo, Japan, 3. 2007
- Hydrogaphic and Oceanographic Department, The Japan Coast Guard.(http://www1.kaiho.mlit.go.jp/KANKYO/TIDE/curr_pred/index.htm, 2013/11/12)
- The Ministry of Environment(Information on http://www.env.go.jp/water/heisa/heisa_net/index.html, 2013/11/13)
- O. Mitamura, M. Yasuno, M. Maruo and T. Goto, Introduction to environmental field work, edited by the committee for the study of environmental field work in University of Shiga Prefecture, Shouwado Publishers, Kyoto City, 110-111 (2007). In Japanese.
- K. Ueda, Relationship between Red Tide Occurrences in Four Japanese Bays and Dam Construction, World Environment, 2(6), 120-126(2012), Doi: 10.5923/j.env.20120206.03
- K. Ueda, Relationship between Dam Construction and Red Tide Occurrence in Small Bays and the Seto Inland Sea, Japan with Considerations from the Gulf of Mexico, Open Journal of Marine Science, 3(4), 201-211(2013), Doi: 10.4236/ojms.2013


