Heavy Metals in Street Dust in Sarajevo Area, Bosnia and Herzegovina
A. Razanica1 * , J. Huremovic1 , S. Zero1 , S. Gojak-Salimovic1 and M. Memic1
1
Department of Chemistry,
Faculty of Science,
University of Sarajevo, Zmaja od Bosne 33-35,
Sarajevo,
71000
Bosnia and Herzegovina
http://dx.doi.org/10.12944/CWE.9.1.06
Copy the following to cite this article:
Razanica A, Huremovic J, Zero S, Gojak-Salimovic S, Memic M. Heavy Metals in Street Dust in Sarajevo Area, Bosnia and Herzegovina. Curr World Environ 2014;9(1) DOI:http://dx.doi.org/10.12944/CWE.9.1.06
Copy the following to cite this URL:
Razanica A, Huremovic J, Zero S, Gojak-Salimovic S, Memic M. Heavy Metals in Street Dust in Sarajevo Area, Bosnia and Herzegovina. Curr World Environ 2014;9(1). Available from: http://www.cwejournal.org/?p=5969
Download article (pdf) Citation Manager Publish History
Introduction
Urban deposits, street dusts, and gully sediments are useful indicators of the level and distribution of heavy metal contamination in the surface environment (Divrikli et al., 2003, Duzgoren-Aydin et al., 2006). Road dust originates from the interaction of solid, liquid and gaseous materials which are produced from different sources and deposited on a road (Atiemo et al., 2006).Street dusts are those materials which collect on paved roads. Concentrations of heavy metals in such dust are extremely variable. Street dusts are relatively complex materials, the compositions of which are seldom constant. This is because of changes during weathering, the relatively short residence time in the environment, and because the residence time is directly related to climate (Fergusson and Kim, 1991, Akheter and Madany, 1993). Street dust investigation is of particular importance for two main reasons. First, street dust is freely being inhaled by those traversing the streets and those residing within the vicinity of the streets. The more the dusts on streets become contaminated with heavy metals, the more people are exposed to the health hazards associated with metals. Second, the street dust is one of the major mediums through which heavy metals may find their ways into soils and surface and underground water through rains and subsequently living tissues of plants, animals and human beings (Tamrakar and Shakya, 2011).
In recent years, a number of authors have suggested that elevated levels of metals in household dust, garden soil and urban street dust pose a potential human health hazard (Lynch et al., 2000, Takaro et al., 2004, Al-Momani, 2007, Dubey et al., 2013).
Heavy metal ions at trace levels play important roles in human life and are present in air, soils, sediments, dusts, and natural waters (Arslan, 2001). Metals in street dust may be derived from natural and anthropogenic sources. Road traffic, industrial activities, and weathering of materials are the dominant sources (Momani, 2006).
The main polluting source of the trace metals in Sarajevo is road traffic which is crowded in the city centre. No results are as yet available for trace elements originating from traffic pollution of Sarajevo-Bosnia and Herzegovina. We refer the Cd, Cr, Cu, Ni, Fe, Pb, Mn and Zn contents of the street dust samples as determined by flame-atomic absorption spectrometry (FAAS)
Materials and Methods
Study Area
Sarajevo is the capital and largest city of Bosnia and Herzegovina, with a population of over 400,000 people. It is located near the geometric center of the triangular-shaped Bosnia-Herzegovina and lies in the Sarajevo valley. The Miljacka river flows through the city from east through the center of Sarajevo to west part of city where eventually meets up with the Bosna river. Sarajevo has a continental climate, lying between the climates zones of central Europe to the north and the Mediterranean to the south. The proximity of the Adriatic Sea moderates Sarajevo's climate somewhat, although the mountains to the south of the city greatly reduce this maritime influence. The average yearly temperature is 9.5°C, with January (-1.3°C avg.) being the coldest month of the year and July (19.1°C avg.) the warmest.
Sampling and Procedure
A total of 30 street dust samples were collected from hospitals and local health centers, school gardens, low and high-density traffic roads, parks, industrial zones, and parking places in Sarajevo area during the period of spring 2013. Sampling locations are shown in Fig. 1. To avoid cross-sample contamination, samples were carefully collected by sweeping an area of about 2 m2 with a plastic scoop and transferred to a polyethylene bags. The samples passed through a 30 mesh sieve, and were then dried at 110°C for 20 h.
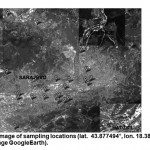 |
Figure 1: Satellite image of sampling locations (lat. 43.877494°, lon. 18.387575°, elev. 601 m; background image Google Earth). Click here to View Figure |
The procedure described by Rasmussen et al. (2001) was followed to digest the samples with some modifications. Samples were ground using a porcelain mortar and a pestle in order to homogenize the sample and to increase the surface area for contact with acids during digestion. About 2.00 g of dust samples were digested with 15 ml of aqua regia (one part concentrated HNO3 and three parts concentrated HCl) and 3 ml concentrated hydrofluoric at room temperature. After the evolution of NO2 fumes mixture was then heated to 90°C. The digest was cooled and diluted with deionized water up to 50 ml and stored in plastic bottles. Metal contents (Cd, Cr, Cu, Ni, Fe, Pb, Mn and Zn) were determined by flame atomic absorption spectrometry (Atomic absorption spectrophotometer AA240FS, Varian). The operating parameters for elements under consideration were set as recommended by the manufacturer. Blank digestions were also carried out.
A quality control program, including reagent blanks, replicate samples was used to assess data precision and accuracy. Blanks were prepared in a similar manner to that of street dust samples and were routinely analyzed before each measurement. All samples were analyzed in triplicate. The accuracy and precision of the analysis results were checked by periodic analysis of Certified Reference Material (CRM) CTA-FFA-1 (Fine fly ash). Observed concentrations were within ±10% of certified values in analyzed CRM for all determined heavy metals.
The values of the detection limits (LOD) and the limits of quantification (LOQ) are given in
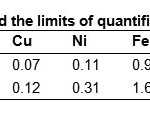 |
Table 1: Detection limits and the limits of quantification (µg/ml) Click here to View table |
Results and Discussion
Flame atomic absorption spectrometry was used to estimate and evaluate the levels of metals (Cd, Cr, Cu, Ni, Fe, Pb, Mn and Zn) in the street dust samples from Sarajevo. The concentrations of metals are summarized in Table 2. The results are means of three replicates. The street dust samples are classified in seven groups, i.e., health centres, school gardens, streets with heavy traffic, streets with moderate traffic, parking place, parks and industrial zone.
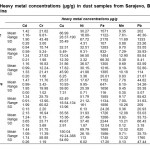 |
Table 2: Heavy metal concentrations (µg/g) in dust samples from Sarajevo, Bosnia and Herzegovina Click here to View table |
Heavy metals have been widely used in other research projects and therefore comparative data are readily available. Observed concentrations of elements were compared with those found by others in other cities. The concentrations of the metals were in most of cases similar to the mean world-wide contents of the street dust samples (Akhter and Madany 1993, Arslan, 2001, Divrikli et al., 2003, El-Hasan et al., 2006,Duzgoren-Aydin et al.,2006, Al-Momani, 2007, Zhao et al., 2009, Tamrakar and Shakya, 2011, Tanushree et al., 2011, Abdel-Latif and Saleh, 2012). The exception is Mn, the concentrations of this metal were lower in all samples then in literature mentioned.
The mean metal concentration in street dust sample varied with the sampling location. The highest levels of metals were found in the samples from industrial zone and streets with high traffic. On the other hand, the lowest levels of metals were found in the samples from health centers and also from school gardens. The decrease in order of metal abundance from the places of higher activities to the place of lower activities may probably be due to the decrease in vehicle emissions, traffic density, industrial activity and other related issues.
The highest Pb concentrations were found in the samples from industrial zone and also from streets with high traffic, which is attributed to the use of leaded fossil fuel. The mean Pb levels in two cases exceeded the intervention level of 100 mg/kg (Lacatusu et al., 2009) which could pose potential threat to humans and critical environmental media such as water bodies. The Cd levels of the dust samples were very low, around 1 – 2 µg/g, and are very similar in all samples. The highest mean Cu concentrations were found in the samples from industrial zone and heavy traffic. The source of copper in environmental samples from the roadsides such as soil and dust was indicated by the researchers as being due to corrosion of metallic parts of cars (Fergusson and Kim, 1991, Divrikli et al., 2003). The highest Zn contents were also found in the samples from streets with high traffic and from industrial zone. The mean zinc concentration in soil world-wide is 15–25 mg/g (Arslan, 2001). The reason for the highest zinc concentration in dust would be usage of zinc in accumulators of motor vehicles or in carburettors. Afterwards, zinc may come from lubricating oils and tires of motor vehicles (Arslan, 2001). The Mn levels of the dust samples were very low and similar in all samples, mean concentrations were around 10 µg/g. The values were significantly lower than in other reported studies. The highest Cr levels were found in the samples from parking places and industrial zones, two or three times higher then in other samples. The same is in the case of Ni. The main source of nickel in street dust is the combustion of diesel fuel (Tanushree, 2011).
By concentrations, the elements were arranged as the following diminishing series Fe>Zn>Pb>Cu>Ni>Cr>Mn>Cd. While the relative distributions of individual metals concentrations varied with sampling location, overall the mean concentration of metals followed the order: industry zone>heavy traffic>parking place>park>school garden>health centre (Fig. 2).
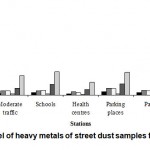 |
Figure 2: The mean level of heavy metals of street dust samples from Sarajevo area Click here to View Figure |
The correlation coefficient statistical analysis was conducted on heavy metal concentrations. A significant positive correlation relationship was found between Pb and Cu (r =0.88), and between Pb and Zn (r = 0.57). This might be explained by the presence of these metals in similar source (i.e. the bodies and tires of automobiles).
Conclusion
Urban deposits (street dusts) are reflective of a wide range of anthropogenic activities, and are a useful resource for evaluating the level and distribution of heavy metal contaminants in the surface environment. The results of the present study were found to be in agreement with earlier work reported in literature. The highest levels of metals were found in the samples from industrial zone and streets with high traffic and, the lowest levels of metals were found in the samples from health centers and also from school gardens. A good correlation was found between Pb-Cu and Pb-Zn concentrations.
References
- Divrikli, U., Soylak, M., Elci, L. and Dogan, M. Journal of Trace and Microprobe Techniques, 21(4), 713-720 (2003).
- Duzgoren-Aydin, N. S., Wong, C. S. C., Song, Z. G., Aydin, A. Li, X. D. and You M. Human and Ecological Risk Assessment, 12, 374-389 (2006).
- Atiemo, M. S., Ofosu, G.F., Kuranchie-Mensah, H. A., Tutu, O.N.D.M., Palm L. and Blankson S.A. Research Journal of Environmental and Earth Sciences, 3(5), 473-480 (2011).
- Fergusson, J. E. and Kim, N. D. Science of the Total Environment, 100, 125-150 (1991).
- Akhter, M. S. and Madany, I. M. Water, Air, and Soil Pollution, 66, 111-119 (1993).
- Tamrakar, C. S. and Shakya, R.P. Pakistan Journal of Analytical and Environmental Chemistry, 12(1 and 2), 32-41 (2011).
- Lynch, R.A., Malcoe, L.H., Skaggs, V.J. and Kegler, M.C. Environmental Health, 63, 9-15 (2000).
- Takaro, T., Krieger, J., Song, L., and Beaudet, N. Journal of Exposure Analysis and Environmental Epidemiology, 14(1), 133-143 (2004).
- Al-Momani, I. F. Soil and Sediment Contamination, 16, 485-496 (2007).
- Dubey V. K., Singh D., Singh N. Curr World Environ, 8(3), 455-461 (2013).
- Arslan, H. Journal of Trace and Microprobe techniques, 19(3), 439-445 (2001).
- Momani, K. A. Soil and Sediment Contamination, 15, 131-146 (2006).
- Rasmussen, P.E, Subramanian, K.S., Jessiman, B.J. Science of the Total Environment, 267, 125-140 (2001).
- Divrikli, U., Soylak, M., Elci, L. and Dogan, M. Journal of Trace and Microprobe Techniques, 21(2), 351-361 (2003).
- El-Hasan, T., Batarseh, M., Al-Omari, H., Ziadat, A., El-Alali, A., Al-Naser, F., Berdainer, B.W. and Jiries A.A. Soil and Sediment Contamination, 15, 357-365 (2006).
- Zhao H., Yin C., Chen M., Wang W. Soil and Sediment Contamination, 18, 173-183 (2009).
- Tanushree, B., Chakraborty, S., Bhumika, F., and Piyal, B. Research Journal of Chemical Sciences, 1(5), 61-66 (2011).
- Abdel-Latif, N. M. and Saleh, I. A. Journal of America Science, 8(6), 379-389 (2012).
- Lacatusu, R., Citu, G., Aston, J., Lungu, M. and Lacatusu, A.R. Carpathian Journal of Earth and Environmental Sciences, 4, 39-50 (2009).


