Assessment of Ambient Air Quality in Riyadh City, Saudi Arabia
B. H. Alharbi1 , M. J. Pasha1 and N. Tapper2
1
National Center for Environmental Technology,
King Abdulaziz City for Science and Technology (KACST),
Riyadh,
11442
Saudi Arabia
2
School of Geography and Environmental Science and Monash Weather and Climate Program,
Monash University,
Clayton,
Victoria
Australia
DOI: http://dx.doi.org/10.12944/CWE.9.2.01
Concentrations of airborne particulate matter with an aerodynamic diameter less than 10 µm (PM10) and five gaseous air pollutants (O3, CO, NO2, SO2 and H2S) were measured over a period of approximately six years (October 1999-June 2004) at five air quality monitoring network stations of King Abulaziz City for Science and Technology (KACST) in Riyadh city, Saudi Arabia. The main objective of this study is to evaluate the quality of ambient air in relation to its possible effects on human health in the urban area of Riyadh city using the U.S. Environmental Protection Agency (USEPA) Air Quality Index (AQI) and break down analysis of five criteria pollutants (O3, CO, NO2 and SO2 and PM10) and Hydrogen Sulphide (H2S). The concentrations of selected pollutants in ambient air has shown upward trends except for sulfur dioxide (SO2) and hydrogen sulfide (H2S), which exhibited decreasing trends over the time. Using the AQI based on a health perspective, a breakdown analysis was conducted. The results confirmed that 71% of the time Riyadh city air is of “Good” quality using the AQI and causes almost no health impacts on city inhabitants. The remaining 29% of more problematic air quality is caused by PM10 (74%) and SO2 (~24%). The study has revealed that both ozone (O3) and carbon monoxide (CO) have little contribution to Riyadh air pollution at 2% and 0.52%, respectively.
Copy the following to cite this article:
Alharbi B. H, Pasha M. J, Tapper N. Assessment of Ambient Air Quality in Riyadh City, Saudi Arabia. Curr World Environ 2014;9 (2) DOI:http://dx.doi.org/10.12944/CWE.9.2.01
Copy the following to cite this URL:
Alharbi B. H, Pasha M. J, Tapper N. Assessment of Ambient Air Quality in Riyadh City, Saudi Arabia. Curr World Environ 2014;9 (2). Available from: http://www.cwejournal.org/?p=6096
Download article (pdf) Citation Manager Publish History
Select type of program for download
| Endnote EndNote format (Mac & Win) | |
| Reference Manager Ris format (Win only) | |
| Procite Ris format (Win only) | |
| Medlars Format | |
| RefWorks Format RefWorks format (Mac & Win) | |
| BibTex Format BibTex format (Mac & Win) |
Article Publishing History
| Received: | 2014-03-10 |
|---|---|
| Accepted: | 2014-05-05 |
Introduction
Continuous monitoring and acquisition of knowledge of air pollutants are required not only to assess the air quality in a given location but also to understand and address several environmental issues. Air pollution is one issue of growing environmental concern because of its known adverse human health effects.1,2 Globally every year, 4.6 million people die because of exposure to high level of air pollutants.3 The correlations between exposure to air pollutants and the occurrence of respiratory and cardiovascular diseases and cardiopulmonary mortality are well documented in the literature.4-6 For instance, ozone (O3), a photochemical oxidant that helps to determine the atmospheric oxidizing capacity,7 can cause direct, adverse effects on human health and ecosystems.8-11 Moreover, sulfuric and nitric acids as well as sulfate and nitrate aerosols are formed as a result of oxidation of sulfur dioxide (SO2) and nitrogen oxides (NOx). These fine aerosol particles can effectively cause visibility degradation, and modify the radiation budget by both absorption as well as scattering of solar radiation.12 Furthermore, atmospheric particles contain a variety of hazardous inorganic substances including metals and sulfur compounds.
Lung injury, bronchial-constriction and increased incidence of infections have all been related to metallic air pollution.13 Asthma and chronic obstructive pulmonary disease have been associated with particles smaller than 10 μm in diameter (PM10).14 Some studies have shown that there may be no lower threshold for PM10-related health problems.15 Since most mass of PM10 is not dangerous, damage caused by PM10 can be attributed mainly to small particles, particularly those featuring diameters smaller than 0.1 μm. These small particles can be toxic to the lungs, even when they have constituents that are not toxic when found in larger particles.14
Many studies in the 1970s and 1980s found a connection between health and low concentration levels of ambient particles. Scientific study by Pope (2000) revealed that short-term sudden exposure to 10 μg/m3 PM10 could contribute to a 0.5 to 1.5 % increase in daily mortality.16 It may also increase hospitalization and health-care visits for respiratory and cardiovascular disease, and produced enhanced outbreaks of coughing and asthma. A variety of cardiopulmonary problems in adults and children, some resulting in mortality, have been associated with long-term exposures to 5 μg/m3 of particles smaller than 2.5 μm in diameter (PM2.5) above background levels.17 Several studies have found that respiratory illness and premature death are attributed mainly to PM2.5.18-19 A 16-year study conducted on data from six U.S. cities revealed that people living in regions where airborne particle concentrations were higher than the PM10 standard had a life span two years shorter than those living in regions of lower airborne particle concentrations.4 Airborne particles can effectively cause an inflammatory response in the lungs if they are coated with first row transition metals (metals that can precipitate) in possibly toxic oxidative reactions such as titanium (Ti), vanadium (V), chromium (Cr), manganese (Mn), iron (Fe), cobalt (Co), nickel (Ni), and copper (Cu).20-21 In general, environmental contamination by particulate toxic trace metals can cause serious damage to the health of exposed individuals.22-26 These toxic trace metals may significantly contribute to the toxicity of the airborne particulate.27 The carcinogenic effects of several particulate toxic trace metals such as cadmium (Cd), cobalt (Co), chromium (Cr), nickel (Ni), lead (Pb), arsenic (As) and selenium (Se) have been established in several studies.28-29
Methods and Data
In order to determine the air pollution levels and trends during the study period, and the relative significance of individual pollutant contributions to ambient air quality degradation in Riyadh city, it is necessary to investigate a reliable database record with a good diagnostic indicator. High quality spatial and temporal air pollutant concentrations and a corresponding air quality index are necessary for this purpose. Therefore, concentrations of air pollutants recorded by KACST Air Quality Monitoring Network have been used and integrated into an easily interpreted air quality index. The AQI is a tool that simplifies the reporting of air quality to the general public in the form of index concentrations of criteria pollutants. The scale of the index is divided into six general categories that are associated with health messages that conveys the health implications of air quality and pollutant-specific health effects and sensitive groups, so that the precautionary actions can be taken by individuals to reduce exposures of concern.30,31
Overview of the KACST Air Quality Monitoring Network
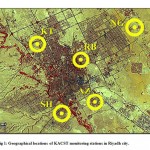
The Riyadh city air quality-monitoring network was established with the mutual understanding and cooperation of various governmental agencies in the Kingdom of Saudi Arabia. The city of Riyadh experiences a large amount of air pollution in the form of dust and other toxic chemicals, which is a constant threat for the health of city inhabitants. It was realized that the existing monitoring facilities operated and maintained by the Presidency of Meteorology and Environment (PME) were insufficient for an expanding city like Riyadh and it was therefore decided to further expand the monitoring network. Several government officials participated in the discussion and feasibility study to establish this network, and a joint cooperation of several agencies was essential for its implementation. The Natural Resources and Environmental Research Institute (NRERI) at King Abdulaziz City for Science & Technology (KACST) took the initiative towards the construction of this network in the capital city of the Kingdom. In 1999, the first monitoring station was established at KACST premises, and then the network was expanded to five monitoring stations scattered throughout the city. The network was set to begin operation in 1999, with only three sites namely KACST (KT), National Guard Hospital (NG) and Al-Shifa (SH). In June 2002, two new stations, namely Al-Azizia (AZ) and Al-Rabwa (RB) were installed. The locations of these stations were selected based on their geographical locations, as well as their significance in terms of representing regional air quality. These air quality-monitoring stations are capable of monitoring both meteorological variables, as well as air pollutants. The type of sensors used with their respective method of monitoring for the pollutants utilized in this study are: NO, NO2 and NOx- Chemiluminescence; CO-Dual Beam NDIR; O3-UV Photometer; and H2S and SO2-UV Fluorescence. Figure 1 shows the geographic locations of monitoring stations within Riyadh city.
|
|
Figure 1: Geographical locations of |
Calculation of Air Quality Index
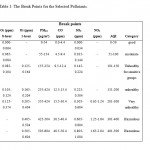
Standard limits. Pollution levels were averaged to match the standard limits and normalized to match the index breakpoints. In this study, the averaging time selected for AQI calculation for PM10, SO2, CO, and O3 were 24,24, 8 and 8 hours respectively and the break points for each selected pollutant were followed in accordance with USEPA30 indexing procedure (Table 1).
|
|
Table 1: The Break Points for the Selected Pollutants. |
Air quality data covering the period of about six years (1999-2004) were used to calculate the index values. PM10 and SO2 were averaged on a daily basis to match the breakpoints. Carbon monoxide (CO) and ozone (O3) were averaged every 8 hours. However, hourly averaged O3 was not considered since the 8 hourly averages did not exceed the 0.374 ppm limit set by the USEPA. Short-term air quality standards have not been defined for nitrogen dioxide (NO2); rather the USEPA provides guidelines to report NO2 in the index range of 200-500 that corresponds to 0.65-2.04 ppm of NO2.30 Therefore AQI for NO2 was not reported here since Riyadh has never experienced such a high concentration of nitrogen dioxide.
Results and Discussion
Trend Analysis
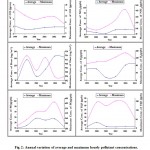
This section provides both a discussion of air pollutant trends as well as an assessment of Riyadh city air quality relative to the Presidency of Meteorology and Environment (PME) standards of Saudi Arabia, based on the monitoring of ambient air quality from KACST air quality surveillance network. It is well known that air pollution levels are affected by variations in local climatic conditions, emissions, and day-to-day activities of inhabitants. The trends in air pollution levels are not always well defined. However, Figure 2 shows obvious upward trends in average CO levels during the study period excluding the year of 1999, that had only three months of data. This figure provides the annual average and maximum 1-hour CO levels in the Riyadh air quality network for the study period. Over the 6-year period, the citywide annual average trend line (fluctuating from ~0.65 to ~1.1 ppm) was well below the 35 ppm standard. Annual maximum 1-hour values for the study period ranged between 17.2 ppm in 1999 and the lowest recorded value of 6.8 ppm in 2004 (Figure 2). The network recorded any exceedance during the period of study when a value of pollutant showed above standard ambient level. Over the study period there were no 1-hour CO exceedances recorded (Table 2).
|
|
Figure 2: Annual variation of average and |
Table 2: Annual exceedances recorded during study period in reference to PME standards.
|
Year |
Annually |
Hourly |
Daily |
|||||
|
NO2 |
CO |
SO2 |
H2S |
O3 |
PM10 |
SO2 |
H2S |
|
|
1999 |
0 |
0 |
0 |
0 |
0 |
0 |
1 |
1 |
|
2000 |
0 |
0 |
5 |
7 |
0 |
24 |
1 |
11 |
|
2001 |
0 |
0 |
3 |
2 |
0 |
6 |
1 |
8 |
|
2002 |
0 |
0 |
4 |
4 |
0 |
4 |
19 |
8 |
|
2003 |
1 |
0 |
15 |
2 |
0 |
36 |
10 |
16 |
|
2004 |
0 |
0 |
3 |
0 |
0 |
17 |
0 |
0 |
As shown in Figure 2, there were upward trends in average NO2 level during the study period. The average NO2 levels were well below the 50 ppb annual PME standard. Air monitoring measurements for the study period have shown an annual arithmetic mean NO2 concentration less than two-third of the 50 ppb annual PME standard. During the year 2003, the highest annual average value recorded for NO2 was 29 ppb, whereas during 2001, the lowest annual average concentration value of 13.5 ppb recorded. Annual maximum 1-hour values for the study period ranged between 462.81 ppb in 2003 to the lowest recorded value of 114.62 ppb in 2000 (Figure 2). The standard annual NO2 arithmetic mean was exceeded only once in 2003 (Table 2). There were upward trends in average O3 level during the study period (Figure 2). This figure provides the annual average and maximum 1-hour O3 levels for the Riyadh air quality network for the study period. Over the 6-year period, the citywide annual average trend line (swinging from ~9.01 to ~28.17 ppb) was well below the 150 ppb standard. Annual maximum 1-hour values for the study period ranged between 147.28 ppb in 2003 and the lowest recorded value of 89.8 ppb in 1999 (Figure 2). No exceedances of O3 standard were recorded in the city during the study period.
As shown in Figure 2, there were upward trends in average PM10 (dust) during the study period. The average PM10 levels were above the 80 μg/m3 annual PME standard (bear in mind that exceptionally high natural background concentrations due to sandstorms/dust storms and aridity in the region play an important role here). Over the 6-year period, the citywide annual average trend line (ranged from ~82.28 to ~146.85 μg/m3). Annual maximum 1-hour values for the study period ranged between 915.7 μg/m3 in 2000 and the lowest recorded value of 895.4 μg/m3 in 2004 (Figure 2). Exceedances occurred in all years except 1999 (incomplete year). The highest number of 1-day exceedances (36) occurred in the year 2003 (Table 2).
Although average SO2 levels monitored in the city (excluding 1999) have downward trends, they have been above the 20 ppb annual air quality standard in all years except for 1999 and 2004, as shown in Figure 2. Over the study period, the citywide annual mean SO2 concentration of air quality network sites ranged between ~11.04 ppb and ~ 46.85 ppb. Annual maximum 1-hour values for the study period have ranged between 617.5 ppb in 2003 to the lowest recorded value of 239.86 ppb in 1999 (Figure 2). The number of exceedances of the 1-hour and 1-day standards on a citywide basis from 1999-2004 is shown in Table 2. During the study period 1-hour exceedances occurred in all years except in 1999 whereas 1-day exceedances occurred in all years except in 2004. The highest number of 1-hour exceedances was 15 whereas the highest number of 1-day exceedances was 19.
The average annual H2S levels monitored in the city have downward trends and have been well below the standard value of 140 ppb (Figure 2). Over the study period, the citywide annual mean H2S concentration of the air quality network sites ranged between ~7.08 ppb and ~15.77 ppb. Annual maximum 1-hour values for the study period have ranged between 181.15 ppb in 2002 and the lowest recorded value of 51.2 ppb in 1999 (Figure 2). The number of exceeds of the 1-hour and 1-day standards on a citywide basis from 1999-2004 is shown in Table 2. During the study period 1-hour exceedances occurred during all years except in 1999 and 2004, while 1-day exceedances occurred in all years except in 2004. The highest number of 1-hour exceedances was seven, while the highest number of the 1-day exceedances was 16.
Breakdown Analysis and Relative Pollutant Importance
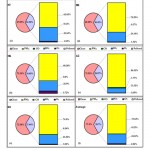
In order to understand the degree of air cleanliness and likely relevance to human health a breakdown analysis of the AQI was carried out. Air quality falling in the “Good” range was considered as clean, since “Good” air has no observable health effects on the humans. The breakdown analysis showed that on average almost 71 % of measurements indicated “Good” air quality on the index and on this basis likely produced almost no health impacts on Riyadh city inhabitants (Figure 3f). The remaining ~ 29% of the measurements showed “moderate” pollution or above, mostly caused by PM10 (~74%). SO2 was the second highest pollutant, contributing almost 24% to the polluted air. Both O3 and CO had a very limited contribution to the air pollution with almost 2% and 0.52% respectively.
Geographic distribution of these pollutants reveals that the north-east of Riyadh features the cleanest air with NG showing the highest percentage of clean air (75.35 %) while the north-west of Riyadh features the most polluted air (KT at 69.05 % clean air) (Figure 3a). The southeast of Riyadh experiences highest PM10 and CO pollution levels and lowest SO2 pollution levels as they contribute to almost 86%, 11.52% and 1.77% respectively of the polluted air of AZ (Figure 3e). O3 had almost no impact on the air quality across Riyadh with the exception of NG station in northeast, where ozone contributed almost 5.64% to the polluted air (Figure 3b).
|
|
Figure 3: Air Quality Index breakdown charts. |
Air Quality Index Analysis for Individual Pollutants
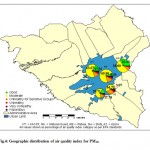
The AQI gives information on how clean or polluted is the air, and what associated health effects might be of concern for the general public. It focuses on health effects that humans experience within a few hours or days after breathing polluted air. The USEPA has divided the AQI into six categories each corresponding to a different level of health concern. These categories are namely good, moderate, unhealthy for sensitive groups, unhealthy, very unhealthy, and hazardous. A comparison was established based USEPA air quality index for five criteria air pollutants including particulate matter (PM10). Data collected over the period of six years indicates that PM10 contributes most to the highest levels of pollution for the city inhabitants. An average of 15.8 % of the index values was recorded in the range of 0-54 µg/m3 corresponding to a “Good” index and relatively cleaner air. Most of the index values (~ 61% on average) were in the “Moderate” range corresponding to PM10 concentrations in the range of 55-154 µg/m3.
The USEPA defines the ultimate “Hazardous” range of PM10 as being from 425 to 604 µg/m3, as anything above this range has an equally undesirable impact on health. However, Riyadh occasionally experiences PM10 concentrations as high as 1000 µg/m3. Therefore, the USEPA air quality index for PM10 was modified to count the percentage of index values in the upper range as 425-1000 µg/m3 and it was estimated that 2.57 % of index values were in this range across the city. Such high index values correspond to dust storms as natural feature of Riyadh city. The geographic distribution of the PM10 AQI (Figure 4) indicates that the southeast part of the city (AZ) has the greatest PM10 pollution impact on air quality (most susceptible to dust storms) while the northeast part (NG) has the least PM10 pollution impact.
|
|
Figure 4: Geographic distribution |
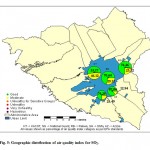
SO2 has been estimated as the second most significant pollutant in Riyadh. Although an average of ~72% index values were recorded in 0-34 ppb range corresponding to “Good” air quality, about 27.38 % of index values were recorded in the range of 35-144 ppb which corresponds to “Moderate” air quality. The geographic distribution of the SO2 air quality index (Figure 5) indicates that the southeast part of the city (AZ) has the least SO2 pollution impact on air quality whereas the northwest of the city (KT) has the greatest SO2 pollution impact.
|
|
Figure 5: Geographic distribution |
CO has been recorded in very low concentrations in Riyadh. Most of the values recorded were in the “Good” air quality range (99.41% on average) with values less than 0.4 ppm, with only a few exceptions of “Moderate” air quality (0.6% on average) occurring in the range of 4.5-9.4 ppm. Geographically, the southern part of the city recorded higher concentrations in the “Moderate” air quality range with AZ and SH recording index values of 1.98% and 0.6%, respectively.
The O3 index was calculated based on 8 hour averages. The USEPA recommends the use of hourly averages in higher concentration ranges of O3 exceeding 374 ppb, however Riyadh city did not record ozone values exceeding 84 ppb on 8-hourly averages. O3 has been recorded at very low concentrations in Riyadh. Most of the values recorded are in the “Good” index range (98.06% on average) with values less than 64 ppb, with only a few exceptions of “Moderate” concentrations (1.94% on average) in the range of 65-84 ppb. Geographically, the northern part of the city recorded higher concentrations in the “Moderate” range with KT and NG recording index values of 2% and 5.64%, respectively.
Conclusion
All investigated pollutants have shown upward trends except for SO2 and H2S that have exhibited downward trends. Among all investigated pollutants, PM10 and SO2 pose the most serious health threat to the city inhabitants since they appeared across almost all air quality index ranges, while CO and O3 have a very limited effect on urban air quality in Riyadh. On average almost 71 % of Riyadh air quality measurements indicated clean air while the ~ 29% of measurements indicated polluted air, mainly by PM10 (~74%) and SO2 (~ 24%). The geographic distribution of PM10 air quality index indicates that the southeast of the city has the highest PM10 pollution impact on air quality while the northeast has the lowest PM10 pollution impact. As for SO2, the southeast of the city has the lowest SO2 pollution impact on air quality whereas the northwest of the city has the highest SO2 pollution impact. In general, the north-east of Riyadh features the cleanest air with the highest percentage of clean air at any site being 75.35 %, while the northwest of Riyadh features the most polluted air with the highest percentage of polluted air at any site being 32.95 %. The present findings in terms of trends and geographical distributions of air pollution, and possible influences on public health in an arid urban environment like Riyadh provide vital information for responsible authorities in decision making, urban planning and is also helpful in maintaining the environmental sustainability.
In relation to human health impacts, as an initial approach to understanding the relationships between air quality and possible health impacts in Riyadh, this study has applied the USEPA AQI. This involves applying the AQI in a completely different environment and to a totally different population than the one for which it was developed. In future work we will use population health statistics and air quality data for Riyadh to begin to establish baseline air pollution-health response relationships for the city of Riyadh.
Acknowledgement
The authors gratefully acknowledge support from King Abdulaziz City for Science and Technology (KACST).
References
1. Curtis L, Rea W, Smith-Willis P, Fenyves E, Pan Y. Adverse health effects of outdoor air pollutants. Environ. Int., 32: 815–30, (2006).
2. de Kok T, Driece H.A.L, Hogervorst J.G.F, Briede J.J. Toxicological assessment of ambient and traffic-related particulate matter: a review of recent studies. Mutat. Res. /Rev. Mutat. Res., 613:103–22, (2006).
3. World Health Organization (WHO). World Health Report 2002: Reducing Risks, Promoting Healthy Life. WHO, Geneva, Switzerland, 248, (2002).
4. Dockery D.W., Pope C.A., Xu X., Spengler J.D., Ware J.H., Fay M.E., Ferris B.G. and Spiezer F.E. An association between air pollution and mortality in six US cities. N. Engl. J. Med., 329:1753–1759, (1993).
5. Dockery D.W. and Pope C.A. Acute respiratory effects of particulate air pollution. Annu. Rev. Public Health, 15: 107–132, (1994).
6. Koken P.J., Piver W.T., Ye F., Elixhauser A., Olsen L.M. and Portier C.J. Temperature, air pollution and hospitalization for cardiovascular diseases among elderly people in Denver. Environ. Health Perspect., 111: 1312–1317, (2003).
7. Lippmann M. Health effects of tropospheric ozone. Environ. Sci. Technol., 25: 1954–1962, (1991).
8. Mustafa M.G. Biochemical basis of ozone toxicity. Free Radic. Biol. Med., 9: 245–265, (1990).
9. Pryor, W.A., Squadrito, G.L. and Friedman, M. The cascade mechanism to explain ozone toxicity: the role of lipid ozonation products. Free Radic. Biol. Med., 19: 935-941, (1995).
10. Cotgreave I. A. Absorption and metabolic fate of ozone—the molecular basis of ozoneinduced toxicity. Scand. J. Work Environ. Health, 22: 15–26, (1996).
11. Hazuchaa M.J. and Lefohn A.S. Nonlinearity in human health response to ozone: experimental laboratory considerations. Atmos. Environ., 41: 4559–4570, (2007).
12. Ramanathan, V. and Crutzen, P.J. Atmospheric Brown ‘Clouds’. Atmos. Environ., 37: 4033- 4035, (2003).
13. Ghio, A. J. and Samet, J. M. Metals and air pollution particles. In: Air Pollution and Health, Holgate, S. T., Samet, J. M., Koren, H. S. and Maynard, R. L. (eds), Academic Press, London, 635-651 (1998).
14. MacNee, W. and Donaldson, K., Particulate air pollution: injurious and protective mechanisms in the lungs. In: Air Pollution and Health, Holgate ST, Samet JM, Koren HS, and Maynard RL. (eds), Academic Press, London, 653–672 (1999).
15. Pope, C.A. III., Bates, D.V. and Raizenne, M.E. Health effects of particulate air pollution: time for reassessment. Environ. Health Perspect., 103:472–480, (1995).
16. Pope, C.A. III, Dockery, D.W., Epidemiology of particle effects. In: Air Pollution and Health, Holgate ST, Koren H, Samet J. (eds), Academic Press, San Diego, CA, 673–705 (1999).
17. Pope, C.A. Review: Epidemiological basis for particulate air pollution health standards. Aerosol Sci. Technol., 32: 4-14, (2000).
18. Özkatnak, H. and Thurston, G. R. Association between 1980 U.S. mortality rates and alternative measures of airborne particle concentrations. Risk Anal., 7: 449-461, (1987).
19. U.S. Environmental Protection Agency. Air Quality Criteria for Particulate Matter, EPA 600/P-95/001aF-cF, Washington, DC, 1084, (1996).
20. Amdur, M., Animal toxicology. In: Particles in Our Air–Concentrations and Health Effects, Wilson, R., Spengler, J. (eds), Cambridge, Massachusetts: Harvard University Press, 85–121 (1996).
21. Utell, M. and Samet, J. Airborne particles and respiratory disease: clinical and pathogenetic


