Assessment of Water Quality of Subarnarekha River in Balasore Region, Odisha, India
A. A Karim1 * and R. B. Panda2
1
Department of Environment and Sustainability,
CSIR-Institute of Minerals and Materials Technology,
Bhubaneswar,
751013
Odisha
India
2
Department of Environmental Science,
F.M University,
Balasore,
756020
756020
India
http://dx.doi.org/10.12944/CWE.9.2.27
Copy the following to cite this article:
Karim A. A, Panda R. B. Assessment of Water Quality of Subarnarekha River in Balasore Region, Odisha, India. Curr World Environ 2014;9 (2) DOI:http://dx.doi.org/10.12944/CWE.9.2.27
Copy the following to cite this URL:
Karim A. A, Panda R. B. Assessment of Water Quality of Subarnarekha River in Balasore Region, Odisha, India. Curr World Environ 2014;9(2). Available from: http://www.cwejournal.org/?p=6147
Download article (pdf) Citation Manager Publish History
Freshwater resources are under severe and increasing environmental stress. At a global level, two thirds of the withdrawals are used for agriculture and one fourth for industry. By the end of the century, withdrawals for agriculture have increased slightly whereas industrial withdrawals have probably doubled (World watch Institute, 1999). In India, the major 14 rivers i.e. Ganga, Yamuna, Godavari, Gomti, Kosi, Cauvery, Ravi, Sone, Chenab, Jhelum, Narmada, Mahi, Tapti and Krishna receive heavy flux of sewage, industrial effluents, domestic and agricultural wastes which consists of substances varying from simple nutrient to highly toxic hazardous chemicals. Most of the large rivers of the world are nothing but open sewers fit only to take urban wastes, half burnt bodies, poisonous pesticides and industrial effluents etc. many of our lakes, including Dal and Nagin of Kashmir have severally polluted with foul odour , silt deposits and get chocked due to excessive algal growths(Kaur, 2005). Ports are major hubs of economic activity and potential sources of pollution (National Research and Development Centre (NRDC), 2005). Gupta et al. (2002) suggested that deterioration of surface water quality may occur during both the construction and operation phases of ports. Subarnarekha basin is the smallest of the 14 major river basins of India draining an area of 19,296 square kilometres and covering hardly 0.6 percent of India's land surface, yet it is an important inter-State river flowing through one of the most important industrial belt and mineral-rich areas of India.. The river in its upper and middle reaches remains more or less as a stagnant pool, often highly charged with pollutants, particularly during dry periods as has been observed in the study based on the water quality data collected by the Bihar State Pollution Control Board (Priyadarshi, N, 1998, 2004). Subarnarekha is the lifeline of tribal communities and fishing communities, residing on the riverbanks and their life and livelihood is affected by the river’s pollution. The basin therefore needs careful environmental management planning to protect its continued existence. A few studies have been undertaken to investigate the pollution of the Subarnarekha River towards its eastern and coastal sides (Mishra et al 1994, Senapati and Sahu, 1996; Panda et al., 2006). The water quality of Subarnarekha River in Balasore region is also in threat because Government of Odisha has proposed Subarnarekha Port or Kirtania Port near the mouth of the Subarnarekha River at Chaumukh in Balasore district of the Odisha coast. The port has been awarded to Chennai-based Creative Port Development Limited (CPDL) to build and operate (http://en.wikipedia.org/wiki/Kirtania_port). If the port will come then anthropogenic activities will be increased which directly influence the water qualities of the river and the life of the people residing there to a greater extent. Hence, in present study the water quality assessment of river Subarnarekha in the coastal belt of Balasore during pre-projects period was done .This study can also be used as reference to monitor the water quality status of the Subarnarekha River during ongoing projects and post-projects scenario.
Materials and Methods
Sampling Locations
The sampling locations were selected randomly by considering the population, location and source. Water samples were collected from the locations along the route of the Subarnarekha River basin in Balasore district. The sampling locations were Rajghat, Jamkunda, Asti, Bhusandeshwar, Chaumukh and Chaumukh muhana which are described below (Table-1).
Table 1: Sampling Locations
| Sample-No. | Sampling Locations | Type of area |
| 1. | Rajghat | Agricultural And Fishing Area (Located Near Bridge of NH 60) |
| 2. | Asti | Agricultural And Fishing Area |
| 3. | Jamkunda | Agricultural And Fishing Area |
| 4. | Bhusandeshwar | Agricultural And Fishing Area |
| 5. | Chaumukh | Agricultural And Fishing Area |
| 6. | Chaumukh Muhana | Confluence Point of Subarnarekha River |
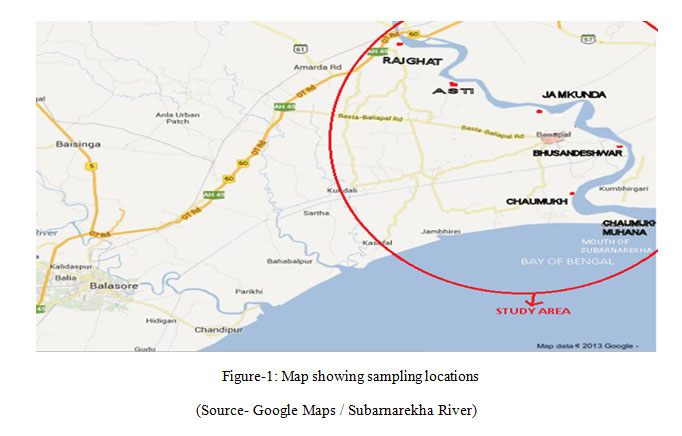 |
Figure 1: Map showing sampling locations |
Physico-Chemical Analysis
Standard procedures as described by APHA (1985) was followed for the Sample collections, stabilization and transportation to the laboratory as well as storage. Water samples were analysed for eighteen parameters to determine the overall quality with respect to Temperature, pH, Total Dissolved Solids (TDS), Total Suspended Solids (TSS), Total Hardness, Calcium, Magnesium Biochemical Oxygen Demand (BOD), Dissolved Oxygen (DO), Electrical Conductivity (EC), Chloride, Sulphate , Total Alkalinity, Chemical Oxygen Demand (COD), Fluoride, Iron, Chromium and Nitrate-Nitrogen . The water samples were analysed for various parameters in the laboratory of P.G Department of Environmental Science, Fakir Mohan University, Balasore, Odisha during the period of March to July, 2013. In general, the standard methods recommended by APHA (1985) was adopted for determination of various physico-chemical parameters.
Table 2: Physico-chemical analysis of river water Sample
| S.No | Parameters | S-1 | S-2 | S-3 | S-4 | S-5 | S-6 | Standardis: 10500 |
| 1. | pH | 7.5 | 7.7 | 7.3 | 7.4 | 7.3 | 7.8 | 6.5-8.5 |
| 2. | Temperature (0C) | 28.20 | 27.40 | 26.70 | 27.10 | 27.80 | 27.30 | - |
| 3. | Electrical Conductivity( µ Mho) | 485 | 464 | 392 | 514 | 427 | 462 | - |
| 4. | Total Suspended Solids (Mg/L) | 118 | 132 | 129 | 146 | 121 | 148 | 500 |
| 5. | Total Dissolved Solids (Mg/L) | 247 | 276 | 243 | 241 | 279 | 285 | 500 |
| 6. | Total Alkalinity (Mg/L) | 42.30 | 28.10 | 34.00 | 32.42 | 27.30 | 36.00 | 200 |
| 7. | Total Hardness (Mg/L) | 114.06 | 85.12 | 64.63 | 68.79 | 96.41 | 83.05 | 300 |
| 8. | Calcium (Mg/L) | 26 | 31.47 | 28.46 | 24.60 | 26.42 | 32.00 | 75 |
| 9. | Magnesium (Mg/L) | 13.63 | 13.04 | 9.72 | 13.50 | 13.8 | 12.81 | 30 |
| 10. | Dissolved Oxygen (Mg/L) | 5.20 | 5.30 | 5.10 | 4.60 | 4.90 | 5.20 | - |
| 11. | Biochemical Oxygen Demand (Mg/L) | 1.10 | 1.87 | 1.59 | 2.80 | 1.51 | 3.39 | 30 |
| 12. | Chemical Oxygen Demand (Mg/L) | 53 | 69 | 74 | 136 | 122 | 147 | 250 |
| 13. | Nitrates (Mg/L) | 0.80 | 0.54 | 1.06 | 0.68 | 0.53 | 0.40 | 45 |
| 14. | Phosphates (Mg/L) | 1.74 | 1.62 | 1.10 | 0.86 | 1.86 | 2.40 | 5 |
| 15. | Sulphates (Mg/L) | 134.41 | 132.76 | 113 | 143 | 131 | 123 | 150 |
| 16. | Chlorides (Mg/L) | 26.32 | 36.63 | 31.24 | 34.10 | 35.10 | 36.12 | 250 |
| 17. | Iron (Mg/L) | 0.413 | 0.224 | 0.241 | 0.306 | 0.273 | 0.464 | 0.3 |
| 18. | Chromium (Mg/L) | 0.012 | 0.010 | 0.008 | 0.014 | 0.016 | 0.014 | 0.05 |
Water Quality Index
Calculating of water quality index is to turn complex water quality data into information that is understandable and useable by the public. Therefore, water Quality Index (WQI) is a very useful and efficient method which can provide a simple indicator of water quality and it is based on some very important parameters. In current study, Water Quality Index (WQI) was calculated by using the Weighted Arithmetic Index method as described by Cude, C. 2001. In this model, different water quality components are multiplied by a weighting factor and are then aggregated using simple arithmetic mean.
Table 3: Descriptive statistics
| S.No | Parameters | No. of Cases | Min. | Max. | Median | Mean | S.D | Varience |
| 1. | pH | 6 | 7.3 | 7.8 | 7.45 | 7.5 | 0.21 | 0.044 |
| 2. | TEMPERATURE | 6 | 26.7 | 28.2 | 27.35 | 27.417 | 0.527 | 0.278 |
| 3. | EC | 6 | 392 | 514 | 463 | 457.333 | 42.968 | 1846.367 |
| 4. | TSS | 6 | 118 | 148 | 130.5 | 132.333 | 12.469 | 155.467 |
| 5. | TDS | 6 | 241 | 285 | 261.5 | 261.833 | 20.203 | 408.167 |
| 6. | ALKALINITY | 6 | 27.3 | 42.3 | 33.21 | 33.353 | 5.524 | 30.553 |
| 7. | HARDNESS | 6 | 64.63 | 114.06 | 84.085 | 85.343 | 18.196 | 331.096 |
| 8. | CALCIUM | 6 | 24.6 | 32 | 27.44 | 28.158 | 3.038 | 9.232 |
| 9. | MAGNESIUM | 6 | 9.72 | 13.8 | 13.27 | 12.75 | 1.53 | 2.342 |
| 10. | DO | 6 | 4.6 | 5.3 | 5.150 | 5.05 | 0.259 | 0.067 |
| 11. | BOD | 6 | 1.1 | 3.39 | 1.73 | 2.043 | 0.871 | 0.759 |
| 12. | COD | 6 | 53 | 147 | 98 | 100.167 | 39.585 | 1566.967 |
| 13. | NITRATES | 6 | 0.4 | 1.06 | 0.61 | 0.668 | 0.236 | 0.056 |
| 14. | PHOSPHATES | 6 | 0.86 | 2.4 | 1.68 | 1.597 | 0.552 | 0.305 |
| 15. | SULPHATES | 6 | 113 | 143 | 131.88 | 129.528 | 10.332 | 106.746 |
| 16. | CHLORIDES | 6 | 26.32 | 36.63 | 34.6 | 33.252 | 3.895 | 15.174 |
| 17. | IRON | 6 | 0.224 | 0.464 | 0.289 | 0.320 | 0.097 | 0.009 |
| 18. | CHROMIUM | 6 | 0.008 | 0.016 | 0.013 | 0.012 | 0.003 | 0.000 |
For assessing the quality of water in this study, firstly, the quality rating scale (Qi) for each parameter was calculated by using the following equation;
• Qi = {[(Vactual – Videal) / (Vstandard – Videal)] * 100}
Where, Qi = Quality rating of ith parameter for a total of n water quality parameters Vactual = Actual value of the water quality parameter obtained from laboratory analysis Videal = Ideal value of that water quality parameter can be obtained from the standard Tables. Videal for pH = 7 and for other parameters it is equalling to zero, but for DO Videal = 14.6 mg/L Vstandard = Recommended WHO standard of the water quality parameter. Then, after calculating the quality rating scale (Qi), the Relative (unit) weight (Wi) was calculated by a value inversely proportional to the recommended standard (Si) for the corresponding parameter using the following expression Wi = 1/ Si Where, Wi = Relative (unit) weight for nth parameter • Si= Standard permissible value for nth parameter I = Proportionality constant. That means, the Relative (unit) weight (WI) to various water Quality parameters are inversely proportional to the recommended standards for the corresponding parameters. Finally, the overall WQI was calculated by aggregating the quality rating with the unit weight linearly by using the following equation WQi = ΣQiWi/ Σ Wi Where, Qi = Quality rating Wi = Relative weight In general, WQI is defined for a specific and intended use of water. In this study the WQI was considered for human consumption or uses and the maximum permissible WQI for the drinking water was taken as 100 score. Chemical analysis of water gives a concept about its physical and chemical composition by some numerical values but for estimating exact quality of water, its better to depend on water quality index which gives the idea of quality of drinking water. The rating of WQI is shown below.| WQI level | Water Quality Rating |
| 0-25 | Excellent |
| 26-50 | Good |
| 51-75 | Poor |
| 76-100 | Very Poor |
| > 100 | Unfit for Drinking Purposes. |
Results and Discussion
Water quality index of the present water body was established from twelve important various physico-chemical parameters. WQI indicates the quality of water in terms of index number which represents overall quality of water for any intended use. The water quality index for each samples were calculated and are presented in table-4. The values of calculated water quality index were found to be 40.14, 27.71, 25.16, 38.48, 40.27, 49.47 for the sampling sites S1, S2, S3, S4, S5 and S6 respectively which indicate that the water quality of river Subarnarekha in Balasore region is good. However, different sampling locations shows different water quality, S2 and S3 have more good water quality in comparison to S1, S4, S5 and S6. The above water quality index was also supported by the following physiochemical parameter variations observed in different water Samples and presented in table- 2. Graphs showing values of different physicochemical parameters were presented in figure-2.
Table 4: Water Quality Index and description of river water samples at different sampling sites
| SampleNo. | Sampling sites | WQI | Description |
| 1 | Rajghat | 40.14 | Good |
| 2 | Asti | 27.71 | Good |
| 3 | Jamkunda | 25.16 | Excellent |
| 4 | Bhusandeswar | 38.48 | Good |
| 5 | Chaumukh | 40.27 | Good |
| 6 | Chaumukh Muhana | 49.47 | Good |
pH
Most natural waters are generally alkaline due to presence of sufficient quantities of carbonates. pH has no direct adverse effects on health, however a lower value below 4 will produce sour taste; and higher value above 8.5 ,an alkaline taste. In present study, it was found that the pH value ranged between 7.3 at sampling station-5 to 7.8 at sampling station- 6. All the pH values represents alkaline nature of river water samples were within the permissible limit as per IS: 10500.
Table 5: An example calculation of Water Quality Index for sample-1
| Sample 1 | ||||||
| S.No | Parameters | Observed Values | Standard Values(Si) | Unit Weight (Wi) | Quality Rating(Qi) | WiQi |
| 1 | pH | 7.5 | 8.5 | 0.117 | 33.3333 | 3.9 |
| 2 | BOD | 1.1 | 30 | 0.033 | 3.66667 | 0.121 |
| 3 | COD | 53 | 250 | 0.004 | 21.2 | 0.0848 |
| 4 | TDS | 247 | 500 | 0.002 | 49.4 | 0.0988 |
| 5 | TSS | 118 | 100 | 0.01 | 118 | 1.18 |
| 6 | Hardness | 114.06 | 300 | 0.003 | 38.02 | 0.11406 |
| 7 | Alkalinity | 42.3 | 200 | 0.005 | 21.15 | 0.10575 |
| 8 | Nitrates | 0.8 | 45 | 0.022 | 1.77778 | 0.03911 |
| 9 | Sulphates | 134.41 | 150 | 0.006 | 89.6067 | 0.53764 |
| 10 | Chlorides | 26.32 | 250 | 0.004 | 10.528 | 0.04211 |
| 11 | Cr | 0.012 | 0.05 | 20 | 24 | 480 |
| 12 | Fe | 0.413 | 0.3 | 3.333 | 137.667 | 458.843 |
| ∑Wi=23.539 | ∑WiQi =945.0663 | |||||
| WQI=∑WiQi / ∑ Wi=945.0663/23.539=40.14 | ||||||
Temperature
Arise in temperature of the water leads to the speeding up of the chemical reactions in water, reduces the solubility of gases and amplifies the tastes and odours. Water in the temperature range of 70C to 110C has a pleasant taste and is refreshing .At higher temperature with less dissolved gases the water becomes tasteless and even does not quench the thirst. In present study, the values of temperature were ranged between 26.700C at sampling station-3 to 28.200C at sampling station- 6.
Conductivity
As most of the salts in the water are present in the ionic forms, capable of conducting current, therefore, conductivity is a good and rapid measure of the total dissolved solids. It has got no health significance as such. In present study, the values of Electrical conductivity were ranged between 392 µ mho at sampling station-3 to 514 µ mho at sampling station- 4.
Total Suspended Solids
IS acceptable limit for total solids is 500 mg/L and tolerable limit is 3000 mg/L of dissolved limits. . In present study the Total Suspended Solids (TSS) values ranged between 118 mg/l at sampling station-1 to 148 mg/l at sampling station- 6.
Total Dissolved Solids
In natural waters dissolved solids are composed mainly of carbonates, bicarbonates, chlorides, sulphates, phosphates, and nitrates of calcium, magnesium, sodium, potassium, iron and manganese, etc. In present study, the Total Dissolved Solids (TDS) values ranged between 241 mg/l at sampling station-4 to 285 mg/l at sampling station- 6. All the TDS values of river water samples were within the permissible limit as per IS: 10500.
Alkalinity
Alkalinity in natural waters is due to free hydroxyl ions and hydrolysis of salts formed by weak acids and strong bases. In present study, the Total Alkalinity values ranged between 27.30 mg/l at sampling station-5 to 42.30 mg/l at sampling station- 1. All the Total Alkalinity values of river water samples in study area were within the permissible limit as per IS: 10500 .
Total Hardness
The total hardness of water is defined as the sum of calcium and magnesium concentrations, both expressed as calcium carbonate, in mg/L.Based on present investigation, hardness varied from 64.63 mg/l at sampling station-3 to 114.06 mg/l at sampling station-1. The permissible limit of Hardness for drinking water is 300 mg/l (IS 10500). Hence, all the hardness values of river water samples in study area were within the permissible limit.
Calcium and Magnesium
The concentration of Calcium varied from 24.60 at sampling location -4 to 32 mg/l at sampling location-6 and Magnesium varied from 9.72 at sampling location -3 to 13.8 mg/ l at sampling location-5 respectively. All the samples were within the permissible limit i.e.75 mg/l for Calcium and 30 mg/l for Magnesium (IS: 10500).
Dissolved Oxygen
Low oxygen content in water is usually associated with organic pollution. The fluctuations in Oxygen content depend on factors such as Temperature, decompositional activities, photosynthesis and the level of aeration. In present investigation DO was ranged from 4.60 mg/l at sampling station-4 to 5.30 mg/l at sampling station-2 in the study area, where as the prescribed limit for DO is 5.0 mg/l.
Biochemical Oxygen Demand
Biochemical Oxygen Demand (BOD) is the measure of the degradable organic material present in a water sample. In present investigation, BOD was ranged from 1.10 mg/l at sampling station-1 to 3.39 mg/l at sampling station-6 in the study area, where as the prescribed limit for BOD is 30 mg/l (IS 10500). Hence all the BOD values of river water samples were within the permissible limit.
Chemical Oxygen Demand
Chemical Oxygen Demand (COD) test is an important, rapidly measured parameters as a means of measuring organic strength for streams and polluted water bodies. In present investigation, COD was ranged from 53 mg/l at sampling station-1 to 147 mg/l at sampling station-6 in the study area, where as the prescribed limit for COD is 250 mg/l (IS 10500). Hence, all the COD values of river water samples were within the permissible limit.
Nitrates
Presence of high concentration of nitrates is an indication of pollution. Concentration of nitrates above 45 mg/L cause a disease methemoglobinemia. In present investigation, Nitrate was ranged from 0.40 mg/l at sampling station-6 to 1.06 mg/l at sampling station-3 in the study area, where as the prescribed limit for Nitrate is 45 mg/l (IS 10500). Hence all the Nitrate values of river water samples were within the permissible limit.
Phosphates
The presence of phosphate in large quantities in fresh waters indicates pollution through sewage and industrial wastes. It promotes growth of nuisance causing micro-organisms. Though phosphate possesses problems in surface waters, its presence is necessary for biological degradation of wastewaters. Phosphorus is an essential nutrient for the growth of organisms and helps for the primary productivity of a body of water. In present investigation, phosphate was ranged from 0.86 mg/l at sampling station-4 to 2.40 mg/l at sampling station-6 in the study area, where as the prescribed limit for phosphate is 5 mg/l (IS 10500). Hence all the phosphate values of river water samples were within the permissible limit.
Sulphates
Sulphates occur in water due to leaching from sulphate mineral and oxidation of sulphides. Sulphates are associated generally with calcium, magnesium and sodium ions. Sulphate in drinking water causes a laxative effect. The prescribed limit of sulphate for drinking water is 150 mg/l (IS 10500). In present investigation, Sulphate was ranged from 113 mg/l at sampling station-3 to 143 mg/l at sampling station-4 in the study area. Hence all the sulphate values of river water samples were within the permissible limit.
Chlorides
Chloride ion may be present in combination with one or more of the cations of calcium, magnesium, iron and sodium. Chlorides of these minerals are present in water because of their high solubility in water. Thus, excessive presence of chloride in water indicates sewage pollution. The prescribed limit of chloride for drinking water is 250 mg/l (IS 10500). In present investigation, Chloride was ranged from 26.32 mg/l at sampling station-1 to 36.63 mg/l at sampling station-2 in the study area. Hence all the Chloride values of river water samples were within the permissible limit. Iron Iron can impart bad taste to the water, causes discolouration in clothes and incrustations in water mains. The permissible value of Iron for drinking water is 0.3 to 1.0 mg/l (IS 10500). In present investigation, Iron was ranged from 0.224 mg/l at sampling station-2 to 0.464 mg/l at sampling station-6 in the study area. Hence all the Iron values of river water samples were within the permissible limit.
Chromium
Chromium may exist in water supplies in both the hexavalent and the trivalent state although the trivalent form rarely occurs in potable water. In present investigation, hexavalent Chromium was ranged from 0.008 mg/l at sampling station-3 to 0.016 mg/l at sampling station-5 in the study area, where as the prescribed limit for hexavalent Chromium is 0.05 mg/l (IS 10500). Hence, all the hexavalent Chromium values of river water samples were within the permissible limit.
Conclusion
The physico-chemical analysis and Water Quality Index (WQI) indicates that the water quality of Subarnarekha River is good in the coastal belt of Balasore. Though it is expected to carry some pollution load from the industrial, mining and urban activities of Jharkhand and West Bengal, the river has considerable re -generating capacity. The authors also suggests that proper environmental management should be done to protect the existence of Subarnarekha river.
Acknowledgement
The authors are thankful to the Ministry of Minority Affairs and University Grants Commission (UGC) of India for funding the project. The authors are also thankfull to Hon’ble vice chancellor, Fakir Mohan University, India for providing all sorts of facilities for the research work.
References
- American Public Health Association (APHA). 1985. Standard methods for the examination of water and wastewater. 21st Centennial Edn. APHA, AWWA, WPCF, Washington DC, USA
- Cude, C. 2001. Oregon water quality index: A tool for evaluating water quality management effectiveness. Journal of the American Water Resources Association, 37, 125–137.
- Gupta, A.K, Patil, R.S, Gupta S.K (2002). Emissions of gaseous and particulate pollutants in a port and harbour region in India. Environmental Monitoring Assessment , Vol.80, pp. 187–205.
- Http://en.wikipedia.org/wiki/Kirtania_port (Accessed on 15th Feb 2013)
- Kaur H, Environmental Chemistry, 2010 fifth revised edition, Pragati Prakashan, India, pp-223-224.
- Mishra, A., J.S. Datta Munshi, M. Singh (1994). Heavy metal pollution of river Subarnarekha in Bihar. Part I: Industrial effluents. J Fresh Water Bio, 6(3): 197-199.
- National Research and Development Centre (NRDC). (2005). Retrieved April, 29, 2013, from http:// www. nrdc.org/ air/pollution/ ports/execsum.asp.
- Panda, U. C., Rath, P., Sahu, K. C., Majumdar, S. and Sundaray, S. K. (2006): Environmental Quantification of Heavy Metals in the Subarnarekha, Estuary and Near-shore Environment, East Coast of India. Asian J. Water Environ. Pollut, 32: 85-92.
- Priyadarshi, N.: Arsenic in Damodar poisoning West Bengal. Indian Express, July 12, 1998.
- Priyadarshi, N. 2004. Distribution of arsenic in Permian Coals of North Karanpura coalfield, Jharkhand. Jour. Geol. Soc. India, 63, 533-536l
- Senapati, N. K. and Sahu, K. C. (1996): Heavy Metal Distribution in Subarnarekha River East Coast of India. Indian J. Mar. Sci., 25: 109-114.
- World watch Institute (1999). World Resources 1998-99. Oxford University Press. P 3


