Physico Chemical Analysis of Municipal Wastewater Discharge in Ganga River,Haridwar District of Uttarakhand, India
Saba Shirin1,2 * and Akhilesh Kumar Yadav1,2
1
Department of Mining Engineering,
Indian Institute of Technology (Banaras Hindu University),
Varanasi,
221 005
India
2
Civil Engineering Department,
Madan Mohan Malaviya Engineering College,
Gorakhpur,
273 010
U.P.
India
DOI: http://dx.doi.org/10.12944/CWE.9.2.39
Copy the following to cite this article:
Shirin S, Yadav A. K. Physico Chemical Analysis of Municipal Wastewater Discharge in Ganga River,Haridwar District of Uttarakhand, India. Curr World Environ 2014;9 (2) DOI:http://dx.doi.org/10.12944/CWE.9.2.39
Copy the following to cite this URL:
Shirin S, Yadav A. K. Physico Chemical Analysis of Municipal Wastewater Discharge in Ganga River,Haridwar District of Uttarakhand, India. Curr World Environ 2014;9(2). Available from: http://www.cwejournal.org/?p=6213
Download article (pdf) Citation Manager Publish History
Select type of program for download
| Endnote EndNote format (Mac & Win) | |
| Reference Manager Ris format (Win only) | |
| Procite Ris format (Win only) | |
| Medlars Format | |
| RefWorks Format RefWorks format (Mac & Win) | |
| BibTex Format BibTex format (Mac & Win) |
Article Publishing History
| Received: | 2014-05-21 |
|---|---|
| Accepted: | 2014-06-25 |
The wastewater pollutants are harmful to environment and public health.The biological decomposition of organics could result in fish kills and foul odours. Waterborne diseases are also eliminated through proper wastewater treatment. There are many pollutantsthat could exhibit toxic effects on aquatic life and the public.The wastewater treatment is removal of contaminants from water in order to decrease the possibility of detrimental in part on the ecosystem including humans (Zhang, et al., 2010). The major port of the soluble BOD contained in the primary effluent. The chemical contamination of water sources due to certain industries or from natural sources (Wang, et al., 2004). High turbidity can inhibit the effects of disinfection against microorganisms and enable bacterial growth. Drinking water should be colourless, since drinkingwater coloration may be due to the presence of coloured organic matter. Organic substances cause water odour, though odours may result from many factors, including biological activity and industrial pollution also microbial pathogens cause health hazards (Mahananda, et al., 2010). The present study wasundertaken in Haridwaron GangaRiverto analyze water quality parameters of municipal wastewater discharge of various sources.
Study Area
Haridwar is one of the important tourism of Uttarakhand.It is situated on the right bank of river Ganga and at the foothills of Shivalik ranges. It is located at 29°58' N of latitude and 78°10' E of longitude. It is one of the most ancient towns and a very important pilgrim centre of India where people from all over the country come round the year to have a dip in the river Ganga on an average around two lakh people visit this city daily. It is closely interwoven with culture and tradition and the health and years the river has been indiscriminately polluted. The study area is showing in the Fig. 1.
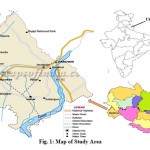 |
Figure 1: Map of Study Area Click here to ViewFigure |
Important religious centre, Haridwar has gained its importance as an industrial town with the establishment of Bharat Heavy Electrical Limited (BHEL) at Ranipur. Adjoining to the BHEL, SIDCUL has also developed a big industrial area for 550 industries out of which about 350 units are in the process of installation whereas about 150 units has started their production. Few important industries planed in study area i.e. Hindustan Lever Limited, Mahindra and Mahindra, ITC, Hero Honda, Calvin care, Somani, Eveready, Hevell's India, etc. The above planed industries are located at 10 km from Haridwar toward Delhi.
Sampling and Analysis Collection of Samples
The experimental method involved the collection of grab samples in clean plastic containers of 5 liter capacity at four different locations inlet chamber (before treatment), primary clarifiers, c-tech basin and outlet chamber (after treatment) on a weekly basis for two years (January 2010 – December 2011). Total n=114 samples were collected. Sample were collected from the depth of 6 inches below the water surface in thoroughly cleaned plastic containers of 5 liters capacity provided with the double cap device. Opening and keeping the mouth of the container against the flow of water collected it.
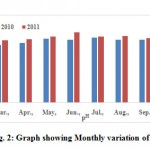 |
Figure 2: Graph showing Monthly variation of pH |
The plastic containers was cleaned by 25%vw HNO3 (kept in 24 hours) and rinsed with double distilled water 2-3 times.The preservation procedure includes keeping the samples in the dark, adding chemical preservative, lowering the temperature to retard reactions or combinations of these.The preservation methodologies are given the Table 1.
Table 1: Preservation methodologies of wastewater quality parameter
| Experiment | Preservative | Max. holding time |
| Biochemical Oxygen Demand | Cool, 4o C | 4 hours |
| Chloride | Cool, 4o C | 7 days |
| Chemical Oxygen Demand | Cool, 4o C | 24 hours |
| Dissolved Oxygen | Fix on site | 6 hours |
| pH | None | 6 hours |
| Phosphorus | - | - |
For BOD, The capacity of 300 ml of sample was used in BOD bottle made by Borrosil. These were washed with chromic acid and washing soda and rinsed with tap water followed by double distilled water, the neck and stopper were wrapped with butte paper with the help of rubber band. The bottles were then sterilized in an autoclave at 15 lbs pressure, (121 oC) for 15 to 25 minutes.Pipettes of different volume size were washed and fitted with cotton plug at the upper end, these were then wrapped in butter paper and sterilized in an autoclave at 15 lbs pressure at 121oC for 15 20 minutes.Petridishes were washed and then sterilization in an oven at (160 oC- 180 oC) for 1 to 2 minutes.
Physico-Chemical Analysis
The samples were analyzed using the Standard Methods (APHA, AWWA, and WCF 1998). The primary parameter Total suspended solids (TSS), Dissolved oxygen (DO), 5-day Biochemical Oxygen Demand (BOD5), Chemical Oxygen Demand (COD), chlorides and sulphates, the ratio of COD to BOD5; while secondary parameters are,covering physical, chemical, and biochemical properties of the waste water. Temperature of water was measured using centigrade thermometer.The turbidity of water was measured with the help of “Jackson’s Candle Turbidity meter”.Total solids is the term applied to the material residue left in the vessel after evaporation of the sample and its subsequent drying in an oven at a temperature of 103-105oC. Total solids include Total Suspended Solids (TSS) and Total Dissolved Solids (TDS).Dissolved solids are solids that are in dissolved state in solution. Waters with high dissolved solids generally are of inferior palatability and may induce an unfavourable physiological reaction in the transient consumer.Electronic digital pH meter measured the pH of the water sample.The dissolved oxygen was determined using Winkler’s titrimetric method. The samples were incubated for 5 days at 20°C to measure BOD,COD of the sample is determined by oxidizing the organic matter in the sample with potassium dichromate in the presence of strong acid. Alkalinity of the sample was determined by titrating with standard solution of mineral acid using pH indicators viz. Phenolphthalein, methyl orange,Chloride and Sulphite.
Results and Discussion
The outline of the analysis of data in respect of Municipal Wastewater Discharge in Ganga River, Haridwar district of Uttarakhand, India are discussed here –
Concentration and Variation of Physico Chemical parameter of municipal waste water Hydrogen ion concentration (pH)
The pH is a measure of the hydrogen ion concentration in water and indicates whether the water is acidic or alkaline. The measurement of acidity of pH is required to determine the corrosiveness of the water. The pH values were vary from 7.08 - 7.31 (Table 2). Monthly variation of pHin Municipal wastewater is shown in the Fig. 2. The standard alkalinity and values of pH for drinking water by BIS is between 6.5 - 8.5 as well as WHO standard range 7.0 - 8.5. High value of pH may results due to waste discharge, microbial decomposition of organic matter in the water body (Patil, et al., 2012). All observe samples have pH values well within the prescribed limit BIS as well WHO (BIS, 1982 and WHO, 1993).
Temperature (T)
The temperature is one of the most important ecological factor which controls the physiological behaviour and distribution of the organisms. The catabohc energy released in the form of heat during the decomposition of organic matter and respiration also slightly added to the temperature. In the present study water temperature values ranged from 16.0 to 27.5 °C (Table 2).From the Fig. 3 shows that the monthly variation of temperature.
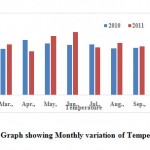 |
Figure 3: Graph showing Monthly variation of Temperature Click here to View Figure |
Table 2: PhysicoChemical properties of Municipal Wastewater Discharge in Ganga River, Haridwar Total dissolved solids (TDS)
| Parameters | Range | Average | Skewness | Kurtosis |
| Flow Rate (MLD) | 41.0 – 60.0 | 53.53 ± 4.97 | -0.42 | -0.86 |
| pH | 7.08 – 7.31 | 7.26 ± 0.05 | -1.5 | 1.91 |
| Temperature0C | 16.0 – 27.5 | 19.35 ± 2.26 | 1.5 | 2.89 |
| Total Dissolved Solids (mg/l) | 376.0 – 484.0 | 426.63 ± 23.15 | 0.08 | -0.11 |
| Total Solids (mg/l) | 103.1 – 688.1 | 336.86 ± 149.53 | 0.68 | -0.32 |
| Total suspended solids (mg/l) | 276.0 – 366.0 | 311.65 ± 18.81 | 0.33 | 0.04 |
| Chemical Oxygen Demand (mg/l) | 276.0 – 392.0 | 339.16 ± 21.12 | -0.48 | 0.77 |
| Dissolved oxygen (mg/l) | 6.03 – 7.24 | 6.68 ± 0.34 | -0.06 | -1.11 |
| Biochemical Oxygen Demand (mg/l) | 83.0 – 167.0 | 148.69 ± 14.17 | -2.8 | 9.6 |
| Volatile Suspended Solids (mg/l) | 100.0 – 200.0 | 153.01 ± 20.40 | -0.63 | -0.18 |
TDS value of 500 mg.l-1 as the desirable limit and 2000 mg.l-1 as the maximum permissible limits (Jain et al., 2003). In the present study, it is found that almost all samples have TDS values well within the prescribed standard. Total dissolved solids value observed to be 426.63 ± 23.15 mg.l-1 (Table 2 and Fig. 4).
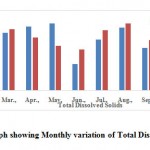 |
Figure 4: Graph showing Monthly |
Total Solids (TS)
Total Solids is the total matter that is left behind after drying a sample of water at 105°C. Total solids may be separated into several different fractions. The two primary ways fractions are established or classified is dissolved or suspended and fixed or volatile. In study period, the TS were observed to be 336.86 ± 149.53 mg.l-1 (Table 2 and Fig. 5).
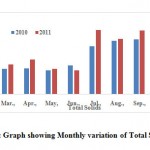 |
Figure 5: Graph showing Monthly variation of Total Solids |
Total suspended solids (TSS)
TSS is an important parameter for designing wastewater treatment plant and the length of time for which wastewater should be retained for primary treatment. Suspended solid do not mean that they are floating matters and remain on top of water layer. They are under suspension and remain in water sample. Total suspended solids play an important role in water and wastewater treatment. Their presence in water sample cause depletion of oxygen level. The value for TSS are shown in Table 2 and variation shows in the Fig. 6. The TSS were observed to be 311.65 ± 18.81 mg.l-1.
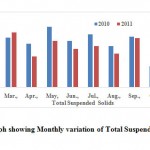 |
Figure 6: Graph showing Monthly |
Chemical Oxygen Demand (COD)
COD test is commonly used to indirectly measure the amount of organic compounds in water. Most applications of COD determine the amount of organic pollutants found in surface water making COD a useful measure of water quality which indicates the mass of oxygen consumed per litre of solution. COD were vary from 276.0 - 392.0 (339.16 ± 21.12) mg.l-1 (Table 2). All the water samples analyzed in the present study had COD content within the prescribed limits and shown in the Fig. 7 (BIS, 1982 and WHO, 1993).
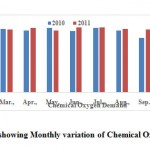 |
Figure 7: Graph showing Monthly variation of Chemical Oxygen Demand Click here to View Figure |
Dissolved Oxygen (DO)
Dissolved oxygen is important parameter in water quality assessment and biological processes prevailing in the water. The DO values indicate the degree of pollution in the water bodies. It depends on factors like temperature of water. DO values were found to be 6.68 ± 0.34 (6.03 - 7.24) mg.l-1 as well as monthly variation of Dissolved Oxygen is shown in the Fig. 8 (Table 2).
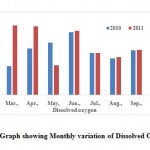 |
Figure 8: Graph showing Monthly |
Biochemical Oxygen Demand (BOD)
Biochemical Oxygen Demand is nothing but the amount of oxygen utilized by microorganisms to stabilize the organic matter. BOD determines the strength of sewage, effluents and other polluted waters and provides data on the pollution load in all natural waters. It is most commonly expressed in milligrams of oxygen consumed per litre of sample during 5 days of incubation at 20°C and is often used as a robust surrogate of the degree of organic pollution of water. BOD can be used as a gauge of the effectiveness of wastewater treatment plants. In the study period BOD were vary from 83.0 - 167.0 mg.l-1which is within the permissible range (Figure 8) and statistical data analysis is given in the Table 2 (BIS, 1982 and WHO, 1993). All the water samples analyzed in the present study has BOD content within the prescribed limits.
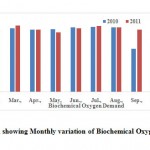 |
Figure 9: Graph showing Monthly variation of Biochemical Oxygen Demand Click here to View Figure |
Volatile Suspended Solids
The suspended solids associated with volatile fraction are termed volatile suspended solids (VSS).In the study area, the volatile suspended solids were measure to be 153.01 ± 20.40 mg.l-1 as well as statistical analysis given in the Table 2. The monthly variation of volatile is shown in the Fig.10.
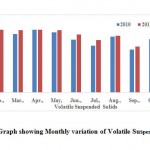 |
Figure 10: Graph showing Monthly variation of Volatile Suspended Solids Click here to View Figure |
Correlation coefficient relationship among different physico-chemical parameters
In the present study, the correlation coefficient (r) between each parameters pairs in computed by taking the average values as shown in Table 3. Correlation coefficient (r) between any twoparameters are calculated for parameter such as water Flow Rate, pH, Temperature 0C, Total Dissolved Solids, Total Solids, Total Suspended Solids, Chemical Oxygen Demand, Dissolved oxygen, Biochemical Oxygen Demand and Volatile Suspended Solids of Municipal Wastewater Discharge in Ganga River, Haridwar. The degree of line association between any two of the water quality parameters as measured by the simple correlation coefficient (r) is presented in Table-2 as 10×10 correlation matrix. The waterpH has found to be show positively correlated with Total Suspended Solids while Volatile Suspended Solids negatively correlated with pH. Temperature has been correlated with Volatile Suspended Solids. The Total Dissolved Solids has been found to show positive correlation with Chemical Oxygen Demand, Biochemical Oxygen Demand whileDissolved oxygen negatively correlated.There is a strong positivecorrelation (r=0.64) between Chemical Oxygen Demand and Biochemical Oxygen. Biological oxygen demand showedsignificant positive correlation Volatile Suspended Solids. The pH and Temperature showed a highly significantnegative correlation(r=−0.55). Data is the mean value of weekly collected samples.
Table 3: Correlation Coefficient (r) among physico-chemical parameters of
Municipal Wastewater Discharge in Ganga River, Haridwar
| Flow Rate | pH | T | TDS | TS | TSS | COD | DO | BOD | VSS | |
| Flow Rate | 1 | |||||||||
| pH | -0.1 | 1 | ||||||||
| T | 0.05 | -0.55 | 1 | |||||||
| TDS | 0.22 | 0.05 | -0.05 | 1 | ||||||
| TS | 0.13 | 0.02 | -0.08 | -0.05 | 1 | |||||
| TSS | 0.01 | 0.19 | -0.03 | 0.1 | -0.02 | 1 | ||||
| COD | 0.1 | -0.11 | 0.08 | 0.2 | -0.21 | 0.19 | 1 | |||
| DO | -0.1 | -0.08 | 0.02 | -0.17 | -0.04 | -0.11 | 0.06 | 1 | ||
| BOD | 0.1 | -0.08 | 0.11 | 0.24 | -0.14 | 0.16 | 0.64 | 0.05 | 1 | |
| VSS | -0.16 | -0.21 | 0.17 | 0.11 | -0.47 | -0.11 | 0.1 | 0.05 | 0.22 | 1 |
Conclusion
In the present study, All analysedsamples forphysical and chemical properties of municipal wastewater discharge in Ganga River was found to be within desirable limits by various agencies. Therefore, the present study, Based on scientific methodology clearlyshows that the said study sites can be easily treated for further used and however it is suggested to monitor the same regularly for sustainable usage.
Acknowledgement
The authors express their sincere thanks to Er. Mohd.Irfan Ansari and Mohd.Auranzeb Ansari for their encouragement and support during the study.
Reference
- BIS, 1982. IS: 2490 Standards for Industrial and Sewage effluents discharge, Bureau of Indian standards, New Delhi.
- Jain C. K, C. P Kumar, Sharma M. K., 2003. Ground water qualities of Ghataprabha command area Karnataka, Indian. Journal of Environment and Ecoplanning, 7(2), 251-262.
- Mahananda M. R., Mohanty B. P., Behera N. R., 2010. Physico-chemical analysis of surface and ground water of Bargarh district, Orissa, India. IJRRAS, 2(3), 284-295.
- Patil S. G., Chonde S. G., Jadhav A. S., Raut P. D., 2012. Impact of Physico-Chemical Characteristics of Shivaji University lakes on Phytoplankton Communities, Kolhapur, India, Research Journal of Recent Sciences 1(2), 56-60.
- Wang Y. C., Peng Y. A., Li Y. M., 2004. The characteristics of water pollution and engineering-oriented prevention on Dianchi. Areal Research and Development 23, 88–92.
- WHO, 1993.World Health Organization, Guidelines for drinking water quality-I, Recommendations, 2nd Ed. Geneva.
- Zhang L. Y., Zhang L., Liu Y. D., Shen Y. W., Liu H., Xiong Y., 2010. Effect of limited artificial aeration on constructed wetland treatment of domestic wastewater. Desalination 250(3), 915-920.


