Watershed Sustainability Index Assessment of a Watershed in Chhattisgarh, India
Surendra Kumar Chandniha1 * , M. L. Kansal1 and G. Anvesh2
1
Department of Water Resources Development and Management,
Indian Institute of Technology,
Roorkee,
247667
Uttarakhand
India
2
Department of Civil Engineering,
Indian Institute of Technology,
Roorkee,
247667
Uttarakhand
India
http://dx.doi.org/10.12944/CWE.9.2.22
In order to achieve continuous sustainable development in a watershed, it is desired that natural resources such as water are assessed and utilized efficiently. Generally, water resources are assessed considering watershed as a unit. Since the water requirements and availability varies in space and time, it is desired to manage the water resources so as to satisfy the demand on sustainable basis. Further, in order to achieve sustainability, it is necessary to consider social, economic and environment aspects of water resources. However it is difficult to bring all these indicators on a single platform. In this study, a watershed sustainability index (WSI) which integrates the hydrology, environment, life and policy (HELP) has been suggested for Piperiya watershed in Chhattisgarh state of India. This watershed has an area of about 2400km2 and is part of Hasdeo river basin which is located in Koriya district of Chhattisgarh. Further, the majority of population in the area is tribal and illiterate. Providing safe and adequate water to the masses is a challenge in this area. The District has numerous hill ranges with rocky geological formation having steep slope. The district faces an acute water shortage for drinking as well as irrigation. Further, the area has number of coal mines and coal washing plants, which contaminate the surface water as well as groundwater. Thus, the availability of safe and fresh water is quite limited. It has been noticed that the WSI for this watershed is about 0.60, which is moderate level of sustainability. In order to improve the water sustainability in this watershed, a watershed management framework and its utilizationhas been elaborated.
Copy the following to cite this article:
Chandniha S. K, Kansal M. L, Anvesh G. Watershed Sustainability Index Assessment of a Watershed in Chhattisgarh, India. Curr World Environ 2014;9 (2) DOI:http://dx.doi.org/10.12944/CWE.9.2.22
Copy the following to cite this URL:
Chandniha S. K, Kansal M. L, Anvesh G. Watershed Sustainability Index Assessment of a Watershed in Chhattisgarh, India. Curr World Environ 2014;9(2). Available from: http://www.cwejournal.org/?p=6329
Download article (pdf) Citation Manager Publish History
Introduction
Water is very essential for living beings, and fresh water is finite entity. For managerial point of view, it is very necessary to develop the plan for future perspectives. According to Brundtland Commission's report (Commission and Commission, 1987): Sustainable development means that "development which meets the needs of current generations without compromising the ability of future generations to meet their own needs". Sustainability is depends upon three major indicators i.e., environment, social and economic. However the dependency of these major indicators also depends upon various sub indicators which is responsible for sustainability of resources. Watershed is a hydrological unit/catchment which conveys the water through the streams and disposed/drained out by single outlet. Watershed management help to improve the design and implementation programs for sustainable development with quantitative and qualitative manner (Gregersen and Lundgren, 1989). As per population India is the second largest country of the world, agriculture in India has probably reached its limit and further sustainable increases in food production must come from dryland forming, especially watershed development and management. This calls for an analysis of situations under which watershed technology becomes economically viable, socially acceptable and ecologically sustainable (Reddy, 2000). For sustainable development, various researchers has working under the consideration of major indicators i.e., social, environment and economic (Lawrence et al., 2002; Loucks and Gladwell, 1999; Raskin et al., 1996; Salameh, 2000; Sullivan, 2002). Sustainability assessment covers review of the process of planning, implementation and benefits accrued from watershed in qualitative and quantitative terms. Assessment of the overall impact of watershed planning is carried out on the basis of natural resources (land, water, and vegetation) through qualitative research methods. Suitable programme strategies are required for smooth implementation of various watershed activities and sustainable development in future with a proper line of action. This task must involve professionals from different disciplines in a context much broader than water management. The WSI integrates the Hydrology (H), Environment (E), Life (L) and Policy (P) aspects of a watershed under three parameters: Pressure, State and Response. Pressure addresses the human activities exerted on the watershed; State assesses the quality of the watershed in the base year of study as well as the quality and quantity of natural resources while Response examines the society’s level of desire to address ecological problems in the watershed (Catano et al., 2009; Chaves and Alipaz, 2007). Water resources sustainability at the watershed scale within a river basin’s context, the Water Resources Sustainability Evaluation Model is developed. However four major indicator were considered i.e., economic efficiency, social equity, environmental conservation, maintenance capacity and sixteen sub indicator is considered. The model is successfully applied for to access the water resources sustainability of watersheds in the Geum River basin, South Korea (Kang and Lee, 2011). The objective of this paper is to propose integrated watershed management framework is and how its use can contribute to the watershed sustainability has been discussed. The study based on HELP issues which is associated with water issues and responses. However calculated scores are helpful for development of water sustainability.
Materials and Methods
Salient Features of Study Area
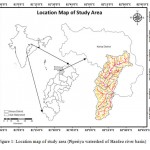
The Piperiya watershed located in Hasdeo river catchment of Mahanadi basin in Chhattisgarh. It lies between Northern latitude 22°37'46" to 23°35'40" and Eastern longitude 82°01'48" to 82°37'29" and area of the watershed is about 2414km2 (Figure 1). Watershed covers the three district (Koriya, Korba and Bilaspur) of Chhattisgarh and partially intersect the Annuppur district of Madhya Pradesh. However the major part covers under Koriya district of Chhattisgarh. The topography is hilly in the northern part and becomes plain in south. Elevation of the watershed varies from 324 to 1062m where as Northern part of watershed have higher elevations. The Koriya district received about 1411mm rainfall in a year.
|
|
Figure 1: Location map of study area |
Assessing the WSI using help issues
Watershed is a hydrological catchment, it may be intersect the administrative boundary of the district or states. However the calculation of the parameter is more difficult as compare to administrative boundary area (Nyerges et al., 2002). Watershed is an individual integrated natural segment which receives the water from precipitation and drained by single outlet as per the relief. Calculation of secondary parameter i.e., demography, sociology, policy etc. is more difficult as compare to administrative boundary area (block/district/state). Because of that, seldom are watersheds used as the planning and management unit. Sustainability of water resources or watershed in a given basin is directly related to its HELP issues. Though it is known that sustainability of water resources is directly depend on HELP issues an attempt has been made to penetrate all into a single aspect (WSI). United Nations Development Programme (UNDP) has been deciding the Human Development Index (HDI) which is indicate the intensity score of educational, life expectancy, and income information for municipalities, states and countries. HDI values vary from 0 to 1 and are simple to use, robust and applied worldwide to assess development. Besides poor literacy and health indicators, the state also fares badly on human development indicators. With a Human Development Index (HDI) value of only 0.358, Chhattisgarh ranks last out of 23 states (India, 2010). Recently United Nations Educational, Scientific and Cultural Organization (UNESCO’s) working in the water sector is built on three tracks, hydrological science for policy relevant advice, education and capacity building responding to the growing needs of sustainable development, and water resources assessment and management to achieve environmental sustainability (International Hydrological Programme IHP-2013) which is directly related to HELP indicators. An integrated basin sustainability index, spanning different socio-economic and environmental issues and their responses, would be helpful to access the level of sustainability of river basins or watershed, allowing not only for a comparison framework, but also a tool to identify bottlenecks to achieve basin sustainability (Chaves and Alipaz, 2007).
In this study HELP indicators considered as major indicators, it plays a key role for sustainable watershed management. Final score of the WSI has contributed from major indicators (Figure 2). And these indicator a derived from pressure, state, and response parameters which is summarized in Table 1. In this table the constraints of parameters are defined by Chaves and Alipaz, 2007. The assigning score of each parameters varies from 0 to 1. Indicator scores has been assigned by pressure, state and responce parameter constraints in terms of its different levels which is shown in Table 2, Table 3 and Table 4 respectively.
Table 1: Indicators and parameters considered in the design of Watershed Sustainability Index
|
Indicators |
Pressure parameters |
State |
Response |
|
Hydrology |
Variation in the basin's per capita water availability in the period Variation in the basin BOD5 in the period analyzed |
Basin per capita water availability (long term average) Basin BOD5 (long term average) |
Improvement in water-use efficiency in the period analyzed Improvement in sewage treatment/disposal in the period analyzed |
|
Environment |
Basin's EPI (Rural and urban) in the period analyzed |
Percent of basin area with natural vegetation |
Evolution in basin conservation (percent of protected areas, BMPs) in the period analyzed |
|
Life |
Variation in the basin per capita income in the period analyzed |
Basin HDI |
Evolution in the basin HDI in the period analyzed |
|
Policy |
Variation in the basin HDI-Education in the period analyzed |
Basin institutional capacity in IWRM |
Evolution in the basin's IWRM expenditures in the period analyzed |
Source: (Chaves and Alipaz, 2007)
Table 2: Description of WSI pressure parameters, levels, and scores
|
Indicator |
Pressure parameters |
Level |
Score |
|
Hydrology |
Δ 1-variation in the basin per capita water availability in the period studied, relative to the long-term average (m3/person year) |
Δ1<-20% |
0 |
|
-20%<Δ1<-10% |
0.25 |
||
|
-10%<Δ1<0% |
0.5 |
||
|
0<Δ1<10% |
0.75 |
||
|
Δ1>10% |
1 |
||
|
Δ 2-variation in the basin BOD5 in the period studied, relative to the long-term average |
Δ2>20% |
0 |
|
|
20%>Δ2>10% |
0.25 |
||
|
0<Δ2<10% |
0.5 |
||
|
-10%<Δ2<0 |
0.75 |
||
|
Δ2<-10% |
1 |
||
|
Environment |
Basin E.P.I, (rural and urban) in the period studied |
EPI>20% |
0 |
|
20%10% |
0.25 |
||
|
10% |
0.5 |
||
|
5% |
0.75 |
||
|
EPI<0 |
1 |
||
|
Life |
Variation in the basin per capita HDI-Income in the period studied, relative to the previous period. |
Δ<-20% |
0 |
|
-20%>Δ<-10% |
0.25 |
||
|
-10%<Δ<0 |
0.5 |
||
|
0>Δ<10% |
0.75 |
||
|
Δ>10% |
1 |
||
|
Policy |
Variation in the basin HDI-Education in the period studied, relative to the previous period |
Δ<-20% |
0 |
|
-20%<Δ<-10% |
0.25 |
||
|
-10%<Δ<0 |
0.5 |
||
|
0<Δ<10% |
0.75 |
||
|
Δ>10% |
1 |
Source: (Chaves and Alipaz, 2007)
Table 3: Description of WSI state parameters, levels, and scores
|
Indicator |
State parameters |
Level |
Score |
|
Hydrology |
Basin per capita water availability (m3/person year). considering both surface and groundwater sources |
Wa< 1,700 |
0 |
|
l,700 |
0.25 |
||
|
3,400 |
0.5 |
||
|
5,100 |
0.75 |
||
|
Wa>6,800 |
1 |
||
|
Basin averaged long term BOD5 (mg/1) |
BOD>10 |
0 |
|
|
10 |
0.25 |
||
|
5 |
0.5 |
||
|
3 |
0.75 |
||
|
BOD<1 |
1 |
||
|
Environment |
Percent of basin area under natural vegetation (Av) |
Av<5 |
0 |
|
5 |
0.25 |
||
|
10 |
0.5 |
||
|
25 |
0.75 |
||
|
Av>40 |
1 |
||
|
Life |
Basin HDI (weighed by county population) |
HDI<0.5 |
0 |
|
0.5 |
0.25 |
||
|
0.6 |
0.5 |
||
|
0.75 |
0.75 |
||
|
HDI>0.9 |
1 |
||
|
Policy |
Basin institutional capacity in IWRM (legal and organizational) |
Very poor |
0 |
|
Poor |
0.25 |
||
|
Medium |
0.5 |
||
|
Good |
0.75 |
||
|
Excellent |
1 |
Source: (Chaves and Alipaz, 2007)
Table 4: Description of WSI response parameters, levels, and scores
|
Indicator |
Response parameters |
Level |
Score |
|
Hydrology |
Improvement in water-use efficiency in the basin. in the period studied |
Very poor |
0 |
|
Poor |
0.25 |
||
|
Medium |
0.5 |
||
|
Good |
0.75 |
||
|
Excellent |
1 |
||
|
Improvement in adequate sewage treatment/disposal in the basin, in the period studied |
Very poor |
0 |
|
|
Poor |
0.25 |
||
|
Medium |
0.5 |
||
|
Good |
0.75 |
||
|
Excellent |
1 |
||
|
Environment |
Evolution in basin conservation areas (Protected areas and BMPs) in the basin, in the period studied |
Δ<-10% |
0 |
|
-10%<Δ<0% |
0.25 |
||
|
0<Δ<10% |
0.5 |
||
|
10%>Δ<20% |
0.75 |
||
|
Δ>20% |
1 |
||
|
Life |
Evolution in the basin IIDI in the basin, in the period studied |
Δ<-10% |
0 |
|
-10%<Δ<0% |
0.25 |
||
|
0<Δ<10% |
0.5 |
||
|
10%>Δ<20% |
0.75 |
||
|
Δ>20% |
1 |
||
|
Policy |
Evolution in the basin's WRM expenditures in the basin. in the period studied |
Δ<-10% |
0 |
|
-10%<Δ<0% |
0.25 |
||
|
0<Δ<10% |
0.5 |
||
|
10%>Δ<20% |
0.75 |
||
|
Δ>20% |
1 |
Source: (Chaves and Alipaz, 2007)
Case study of WSI in Koriya district of Chhattisgarh
To illustrate the utilization of the WSI, it was applied to the Piperiya watershed of Hasdeo river basin in Koriya district, watershed area is about 2414 km2. The period studied was considered 5 years (2007-2012), Soil and Water Assessment Tool (SWAT) model has been used for runoff estimation. ERDAS imagine (Ver. 9.2) and ArcMap (Ver. 9.3) software has been used for pre and post-processing purposes of primary datasets. Environmental, social and economic data were collected from different authentic sources. Since WSI is formed by four indicators, each of them will be presented separately, and the overall score of watershed sustainability index (WSI) computed at the end. The adopted methodology for this study is as shown in the form of flow chart which illustrated on Figure 2.
|
|
Figure 2: Flow chart of Methodology for |
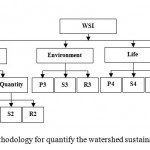
Where, WSI- Watershed Sustainability Index P1- Pressure (Ratio of long term river mean flow rate to the basin population) S1- State (Percentage change in period of study regarding lean flow rate ) R1- Response (Water use efficiency in the basin (water availability/person/year)) P2- Pressure (BOD5 variation in the period studied) S2- State (Variation in basin BOD5 (mg/lit) in the period studied) R2- Response (Improvement in sewage treatment methods in the period studied) P3- Pressure (Average percentage variation in land use and urban population in the period studied ) S3- State (Percentage variation in forest land in the period studied) R3- Response (Best management practices (BMPz) in the period studied) P4- Pressure (Variation in basin per capita income in the period studied) S4- State (Basin human development index (HDI) in the period studied) R4- Response (Improvement in basin HDI in the period studied) P5- Pressure (Percentage variation in Education development index (EDI) in the period studied) S5- State (Capacity in development of integrated water resources management (IWRM) R5- Response (Institutional expenditures over IWRM in the period studied)
Results and Discussion
Hydrology Indicator
Quantity Aspect
In this study, the score of hydrology indicator has been carried out quantitative and qualitative aspects. In case of water quantity sub-indicator, surface water is the principal sources in the basin. For measurement of quantitative aspect in the watershed sustainability, per capita water availability (state parameter) was correlate with the long-term river mean flow rate, divided by the basin population in the period studied. In the qualitative term, only variation of the basin BOD5 has considered for quality parameter and their score is assign using the predefined Table 3 (Chaves and Alipaz, 2007). The combined score of the hydrology indicator is just average of the both sub-indicators (quantity as well as quality). In case of basin water, quantity pressure parameter, the variation in water availability (Wa) were quantifying for the duration of 5 year period studied. The average changes of long term variation have found 11.1% positively. The assigned score has been chosen from Table 2 (Chaves and Alipaz, 2007), calculated score of the pressure parameter is 1.0 during the period studied. At the end of the watershed, long term average flow rate has been received is about of 36 m3/s during the period studied. Total basin population of the basin is about 3,62,823 (Census 2011) which has dependent on basin water itself. Per capita annual water availability (Wa) is estimated as about 3600 m3. Out of this, about 3125 m3 is from surface water and about 475 m3 from ground water. According to Table 4, the assigned score for quantity state parameter is 0.50 (medium). For quantity response parameter, in the 5 year period studied, there was some improvement in water use efficiency in the basin, which corresponds to a score of 0.25. Therefore, the final score of the Pressure, State, and Response parameters for basin water quantity is carried out 0.58 (average score of the pressure, state, and response parameters)
Quality Aspect
In the case of the water quality sub-indicator, quality pressure parameter corresponds to the variation in the basin BOD5 in the 3 year period (+13.64%), score were assign according to Table 3, the score assigned for pressure parameter is 0.25. In quality state parameter, basin’s BOD5 long-term average was found about 3.3 mg/l in Hasdeo river basin (Report of Chhattisgarh Environmental Conservation Board, 2011). This results in a state score of 0.5. The quality response parameter for the water quality sub-indicator resulted in a score of 0.25 (poor improvement in sewage treatment/disposal in the 3 years studied). The final score has been carried out with averaging the all three quality sub-indicators scores and is 0.33. Hence, the overall Hydrology indicator value is simply the average of the quantity and quality sub-indicators, or (0.58+0.33)/2=0.46.
Environment Indicator
The Environment indicator was calculated as the average over Pressure, State, and Response parameters. In case of pressure parameter, the combined basin variation in agricultural area and urban population as per land use change in period studied has been increased 1.5% and 9.0%, respectively, however the average value is about (1.5%+9.0%)/2=5.3%. This corresponds to an environmental pressure score of 0.5. In the case of environmental state, the basin has 30.3% of its original vegetation cover in the year 2012, which, according to Table 3 (Chaves and Alipaz, 2007), resulted in a value of 0.75. The environmental response (evolution in protected areas and areas with BMPs) was very minute in the studied basin area which resulting, according to Table 4 (Chaves and Alipaz, 2007), the score were assign as 0.50. Therefore, the overall score 0.58 over the studied basin.
Life Indicator
In the life pressure parameter, the basin was estimated by the variation in the basin’s HDI-income sub index in the 5 year period (2007–2012), data has been acquired from UNDP-Chhattisgarh Economic and Human Development Indicators, 2011. In that period, there was an increase in HDI-Income of 3.4% (UNDP 2004), resulting, according to Table 3, in a score of 1.0 (Good). In case of life state parameter, the basin HDI in the year previous to the period studied was 0.81, resulting assigned value is 0, according to Table 4. The overall basin HDI was the weighted average of the HDI values of each municipality and its corresponding population of the basin area. For life response parameter, i.e., the evolution of the expenditures in IWRM in the basin, was +5% in the 5 year period, resulting in a parameter value of 0.1 (Table 5). Therefore, the overall Life score for the basin was (1.0+0 +1.0)/3=0.66.
Policy Indicator
The policy pressure score (variation in the HDI-Education sub-indicator in the 5 year period) for the basin was +2.5%, resulting in a parameter score of 0.75 (Table 2). This indicates that, in the period studied, there was a significant increase in the educational level of the basin, which would have contributed to the societal participation in IWRM. As for the policy state parameter (basin institutional capacity), although there is a legal framework available (federal and state water, and environmental laws and regulations), little was accomplished in participatory water resources management in the period studied. The Piperiya watershed of Hasdeo river basin has lacks of watershed committee or association and extension work. However, it is necessary to improve the prioritization plan for basin level. As a consequence, the basin was ranked poor in this particular issue, with a corresponding parameter level of 0.25. With regard to policy response, the evolution in the basin expenditures in IWRM was +5% in the 5 year period, yielding a value of 0.5 for this parameter. The overall policy were calculated as averaging the all three parameters, i.e., (0.75+0.25+0.5)/3=0.50. Finally the combined score of the generalized HEPL indicator is 0.55 which has considered as the watershed sustainability index (WSI) of the Piperiya watershed in Hasdeo river basin.
Table 5: Final score of each major indicators, sub indicators and WSI
|
Hydrology |
Combined score of WSI = 0.60 |
|||||
|
|
Pressure |
State |
Response |
Average |
SCORE |
|
|
Quantity |
1 |
0.25 |
0.25 |
0.5 |
0.41 |
|
|
Quality |
0.25 |
0.5 |
0.25 |
0.33 |
||
|
Environment |
||||||
|
E.P.I |
0.5 |
0.75 |
0.5 |
0.58 |
0.58 |
|
|
Life |
||||||
|
H.D.I |
1.0 |
0 |
1 |
0.66 |
0.66 |
|
|
Policy |
||||||
|
E.D.I |
0.75 |
0.25 |
0.5 |
0.75 |
0.75 |
|
Bold Numbers
Show poor performance for WSI
Conclusion
In this study a methodology for water sustainability index on the basis of hydrology, environment, life and policies (HELP) has been advocated for a Piperiya watershed of Chhattisgarh state in India. On the basis of this methodology, the watershed sustainability has been estimated as 0.55 which is of moderate level. However, it may be noticed that such estimate is subject to various assumptions. One of the assumptions is that the weightage of each parameter is considered as equal. However, one can use the expert system for deciding the weightage of each parameter as suggested by (Kansal and Gaur, 2011). Further, watershed sustainability can be improved by improving the hydrology of the watershed. Since the major source of water is rainfall which varies in space and time, one can think of creating storage in the watershed. The areas of the abandoned caol mines can be utilized as sites of natural storage and the same can used for various purposes after proper treatment. Further, the climate can be improved by way of growing more trees and by restricting the pace of urbanization in the watershed. One of the major contributors to environment in this watershed is coal mines. The waste generated from these coal mines should be disposed off properly so that it does not pollute the freshwater in the area. Since the area is mainly dominated by tribal people, there is plenty of scope for improving the education level of the people and hence the human resource in the area. It is desired that the public at large should be involved in order to improve the watershed conditions. People should be made a part of aforestation programme and should be made educated for conservation of water.
Acknowledgements
The authors wish to thank the Indian Meteorological Department (IMD) and state data center Raipur for providing the long range rainfall data. The first author would also like to thank Ministry of Human Resources Development, Government of India for providing financial support for carrying out this study.
References
- Catano, N., Marchand, M., Staley, S., Wang, Y., Development and Validation of the Watershed Sustainability Index (WSI) for the Watershed of the Reventazón River. Tech. rep., Comcure.(2009)
- Chaves, H.M., Alipaz, S., An integrated indicator based on basin hydrology, environment, life, and policy: the watershed sustainability index. Water Resources Management 21, 883-895.(2007)
- Commission, B., Commission, B., Our common future. Oxford: Oxford University Press.(1987)
- Gregersen, H.M., Lundgren, A.L., Linking monitoring and assessment to sustainable Development. Forestry for Sustainable Development Program, Department of Forest Resources, College of Natural Resources, University of Minnesota.(1989)
- India, U., Results from 2010–Empowered Lives, Resilient Nations. UNDP India.(2010)
- Kang, M.G., Lee, G.M., Multicriteria Evaluation of Water Resources Sustainability in the Context of Watershed Management1. JAWRA Journal of the American Water Resources Association 47, 813-827.(2011)
- Kansal, M., Gaur, A., Expert System Based Water Sustainability Index, Reston, VA: ASCE copyright Proceedings of the 2011 World Environmental and Water Resources Congress; May 22. 26, 2011, Palm Springs, California| d 20110000. American Society of Civil Engineers.(2011)
- Lawrence, P.R., Meigh, J., Sullivan, C., The water poverty index: an international comparison.(2002)
- Loucks, D.P., Gladwell, J.S., Sustainability criteria for water resource systems. Cambridge University Press.(1999)
- Nyerges, T., Jankowski, P., Drew, C., Data-gathering strategies for social-behavioural research about participatory geographical information system use. International Journal of Geographical Information Science 16, 1-22.(2002)
- Raskin, P.D., Hansen, E., Margolis, R.M., Water and sustainability, Natural Resources Forum. Wiley Online Library, pp. 1-15.(1996)
- Reddy, V.R., Sustainable watershed management: Institutional approach. Economic and Political Weekly, 3435-3444.(2000)
- Salameh, E., Redefining the water poverty index. Water International 25, 469-473.(2000)
- Sullivan, C., Calculating a water poverty index. World development 30, 1195-1210.(2002)
- UNESCO, Work in the water sector is built on three tracks: International Hydrological Programme IHP-2013 site: http://www.unesco.org/new/en/natural-sciences/environment/water/ihp/about-ihp/. (2013)
- Report of Chhattisgarh Environmental Conservation Board, ACTION PLAN: Development of Comprehensive Environmental Pollution Abatement Action Plan for Critically Polluted Area Korba 6I;CHHATTISGARH.(2011)
- UNDP, United Nations Development Programme, Chhattisgarh Economic and Human Development Indicators. (2011)


