Assessment of Ground Water Quality by Using Water Quality Index Method of Berhampur Town in Odisha, India
Bijaya Kumar Gouda1 , Ejaz Ahmed2 * and Mukunda Kesari Khadanga3
1
Department of Chemistry,
Science College,
Hinjilicut,
Ganjam,
761102
Odisha
India
2
Department of Chemistry,
M.M. Mahavidyalaya,
Berhampur,
760001
Ganjam Odisha
India
3
Project Scientist,
NIOT,
Chennai,
600100
India
http://dx.doi.org/10.12944/CWE.9.3.49
Copy the following to cite this article:
Ahmed E, Gouda B. K, Khadanga M. K. Assessment of Ground Water Quality by Using Water Quality Index Method of Berhampur Town in Odisha, India. Curr World Environ 2014;9 (3) DOI:http://dx.doi.org/10.12944/CWE.9.3.49
Copy the following to cite this URL:
Ahmed E, Gouda B. K, Khadanga M. K. Assessment of Ground Water Quality by Using Water Quality Index Method of Berhampur Town in Odisha, India. Available from: http://www.cwejournal.org/?p=7133
Download article (pdf) Citation Manager Publish History
Berhampur, one of the largest city of Odisha nick name silk city is located in eastern coast line of Ganjam district, Odisha, India. It is situated in between 19Ëš58’E Latitude and 84Ëš5’`N Longitude. The city is grown into Municipal Corporation which consists of 40 wards and population of about four lacks. This city is situated about 15 km away from Bay of Bengal which makes the city condition extremely humid. The maximum temperature during summer season 400C, whereas minimum temperature reaches to 220C.during winter season. The city experiences average annual rain fall of 1250mm with the set of south west monsoon. On account of rapid urbanization there has been a rapid growth in huge building, apartment, hotel, hospital, technical institute, transportation and vehicles. This leads to the increase in requirement of water for domestic purpose as well as drinking purposes. The river Rusikulya is the major distributing river for water supply as well as Dakhinapur reservoir is the second source of water for Berhampur city. This water supply is insufficient for the total pollution for which about 55% human population depends on ground water. But the ground water is getting polluted due to various human activities and water logging of waste water from the houses due to improper sewage system for which ground water is contaminated due to seepage from effluent bearing water body (Adekunle, 2009). Over burden of the population pressure unplanned urbanization on restricted exploration and dumping of the polluted water at in appropriate place enhance infiltration of harmful compounds to the ground water (Pandey and Tiwari, 2009). In view of this it is imperative to analyse the ground water quality in order to know the level of pollution, so that appropriate measures could be taken to over come the pollution problem and make the ground water pollution free or pollution minimized.
Material and Methods
Only tube wells were selected from ten sampling points. The grab samples were collected in plastic and glass bottles as per the requirement. The sampling was done during June 11 to May 12 on three monsoon seasons .Different physical, chemical and biological parameters such as pH, turbidity, E-conductivity, total alkalinity, TH, TDS, Iron, Cl-, NO3-, Calcium and magnesium were analyzed in laboratory as per following procedure in Table-1.All chemicals and reagents used for the analysis were of analytical reagent grade (Patel and Sing, 1998),(Trivedy and Goel,1984).
Table 1: Water quality classification based in WQI value.
|
WQI |
Water quality |
|
< 50 |
Excellent |
|
50 -100 |
Good |
|
100-200 |
Poor |
|
200-300 |
Very Poor |
Table 2: Location of point of ground water in Berhampur town
|
Sl No |
Code No |
Location of sampling point |
|
1 |
S1 |
Khodasing (TW) |
|
2 |
S2 |
Industrial Estate(TW) |
|
3 |
S3 |
M.K.C.G. Medical(TW) |
|
4 |
S4 |
New Bustand(TW) |
|
5 |
S5 |
Old Bustand(TW) |
|
6 |
S6 |
Gandhi Nagar(TW) |
|
7 |
S7 |
Gate Bazar(TW) |
|
8 |
S8 |
Radio Station(TW) |
|
9 |
S9 |
Haradakhandi(TW) |
|
10 |
S10 |
Rail way station (TW) |
Water quality Index (WQI)
For computing WQI three steps are followed. In the first step each of the parameters has been assigned a weight according to its relative importance in the overall quality of water for drinking purpose (Table.3). The maximum weight of 5 has been assigned to the parameter NO3-1 due to its major importance in water quality assessment. Magnesium which is given the minimum weight of 1, as magnesium by itself may not be harmful to other. In the second step, the relative weight (wi) is computed from the following equation
Table 3: Methods of analysis of different parameters
|
Sl. No |
Parameters |
Unit |
Method of Analysis |
|
1 |
pH value |
pH meter | |
|
2 |
Turbidity |
NTU |
Nephlo turbidity |
|
3 |
TDS |
mg/l |
Gravimetric method |
|
4 |
E.C |
MS/cm |
Conductivity meter |
|
5 |
TH |
mg/l |
Titrimetricmethod(EDTA) |
|
6 |
Alkalinity |
mg/l |
Titration with H2SO4 |
|
7 |
Ca2+ |
mg/l |
EDTA Titration |
|
8 |
Mg2+ |
mg/l |
EDTA Titration |
|
9 |
Cl- |
mg /l |
AgNO3Argentometrictitration |
|
10 |
NO3- |
mg/l |
UV screening |
Wi = wi/∑i=1nwi
where WI is the relative weight wi is the weight each parameter and n is the number of parameter calculated relative weight (Wi) values of each parameter are also given in Table- 01-10. In third step a quality, rating scale (qi) for each parameter is assigned by dividing its concentration in each water sample by its respective standard according to the guidelines in the WHO and the result multiplied by 100.
Qi = (ci/Si) x 100
Table 4: Relative values of chemical paramet
|
Parameter |
Highest permitted value for water with reference to WHO standards |
Weight(wi) |
Relative weight(Wi) |
|
PH |
7.0 – 8.5 | 4 |
0.1379 |
|
Turbidity |
5 |
4 |
0.1379 |
|
TDS |
500 |
4 |
0.1379 |
|
TH |
300 |
2 |
0.689 |
|
Alkalinity |
900 |
3 |
0.1034 |
|
Ca2+ |
75 |
2 |
0.689 |
|
Mg2+ |
50 |
2 |
0.689 |
|
Cl-1 |
200 |
3 |
0.134 |
|
No3-1 |
50 |
5 |
0.1724 |
|
|
∑wi=29 |
Table 5: Seasonal variation of pH value with average and permissible value
|
Sl.No |
Location points |
Mon soon |
Post monsoon |
Pre monsoon |
Average |
Remarks : permissible value with reference to WHO (7.0 to 8.5) |
|
1 |
S1 |
7.2 |
7.1 |
7.1 |
7.13 |
Permissible |
|
2 |
S2 |
7.3 |
6.9 |
7.0 |
7.06 |
Permissible |
|
3 |
S3 |
7.4 |
7.3 |
7.1 |
7.26 |
permissible |
|
4 |
S4 |
7.3 |
7.1 |
7.0 |
7.13 |
permissible |
|
5 |
S5 |
7.5 |
7.1 |
7.0 |
7.20 |
permissible |
|
6 |
S6 |
7.4 |
7.2 |
7.1 |
7.23 |
permissible |
|
7 |
S7 |
7.4 |
7.3 |
7.1 |
7.26 |
permissible |
|
8 |
S8 |
7.6 |
7.2 |
7.2 |
7.33 |
permissible |
|
9 |
S9 |
7.8 |
7.2 |
7.2 |
7.40 |
permissible |
|
10 |
S10 |
7.6 |
7.3 |
7.3 |
7.40 |
permissible |
Where qi is the quality rating, Ci is the concentration each chemical parameter on each water sample in mg /l, Si is the Indian drinking water standard for each chemical parameter in mg/l according to guideline of the BIS -10500, 1991. for the computing the WQI the first is determined the each chemical parameter which is used then the WQI as per the following equation,
Si = WI x qi
WQI= ∑ Si
Table 6: Seasonal variation of turbidity (NTU) value with average and permissible value
|
Sl. No |
Location points |
Mon soon |
Post monsoon |
Pre monsoon |
Average |
Remarks: Permissible value with reference to WHO (5.0NTU) |
|
1 |
S1 |
10.9 |
12.9 |
13.9 |
12.56 |
Excessive |
|
2 |
S2 |
11.8 |
12.4 |
14.8 |
13.0 |
Excessive |
|
3 |
S3 |
10.5 |
11.3 |
15.4 |
12.4 |
Excessive |
|
4 |
S4 |
10.5 |
11.4 |
14.7 |
12.2 |
Excessive |
|
5 |
S5 |
10.3 |
12.3 |
16.2 |
12.93 |
Excessive |
|
6 |
S6 |
10.2 |
12.2 |
15.8 |
12.73 |
Excessive |
|
7 |
S7 |
9.5 |
11.3 |
14.7 |
11.83 |
Excessive |
|
8 |
S8 |
10.2 |
11.9 |
15.2 |
12.43 |
Excessive |
|
9 |
S9 |
9.5 |
12.4 |
14.9 |
12.26 |
Excessive |
|
10 |
S10 |
10.2 |
13.3 |
15.4 |
12.96 |
Excessive |
Table 7: Seasonal variation of Total dissolved solid (TDS) mg/l value with average
and permissible value
| Sl. | Sl. | Mon soon | Post monsoon | Pre monsoon | Average | Remarks: permissible value with reference to WHO (500mg/l) |
| No | ||||||
| 1 | S1 | 510 | 540 | 640 | 563.33 | Excessive |
| 2 | S2 | 515 | 534 | 690 | 579.66 | Excessive |
| 3 | S3 | 600 | 683 | 804 | 695.66 | Excessive |
| 4 | S4 | 540 | 666 | 712 | 639.33 | Excessive |
| 5 | S5 | 576 | 612 | 712 | 633.33 | Excessive |
| 6 | S6 | 582 | 635 | 810 | 675.66 | Excessive |
| 7 | S7 | 573 | 679 | 799 | 683.66 | Excessive |
| 8 | S8 | 587 | 671 | 810 | 689.33 | Excessive |
| 9 | S9 | 590 | 683 | 799 | 690.66 | Excessive |
| 10 | S10 | 601 | 698 | 840 | 713 | Excessive |
Si is the sub index of ten parameter ,qi is the rating base on concentration of the ten parameter, and n is the number of the parameter. The computed WQI values are classified in to four types Excellent water to, unsuitable for the drinking.
Table 8: Seasonal variation of Electrical conductivity (EC) MS/cm value with average and permissible value
|
Sl. No |
Location points |
Mon soon |
Post monsoon |
Pre monsoon |
Average |
Remarks: permissible value with reference to WHO (1.1-3.0 MS/cm) |
| 1 | S1 | 1.1 | 1.3 | 1.2 | 1.2 |
Permissible |
| 2 | S2 | 1.2 | 1.4 | 1.2 | 1.26 |
Permissible |
| 3 | S3 | 1.7 | 1.9 | 1.6 | 1.73 |
Permissible |
| 4 | S4 | 1.6 | 1.7 | 1.5 | 1.6 |
Permissible |
| 5 | S5 | 1.5 | 1.7 | 1.6 | 1.6 |
Permissible |
| 6 | S6 | 1.4 | 1.7 | 1.3 | 1.46 |
Permissible |
| 7 | S7 | 1.5 | 1.5 | 1.2 | 1.4 |
Permissible |
| 8 | S8 | 1.4 | 1.8 | 1.3 | 1.5 |
Permissible |
| 9 | S9 | 1.9 | 1.9 | 1.5 | 1.7 |
Permissible |
| 10 | S10 | 2.0 | 2.3 | 1.9 | 2.1 | Permissible |
Table 9: Seasonal variation of Total Hard ness (TH) mg/l value with average and permissible value
|
Sl. No |
Location points |
Mon soon |
Post monsoon |
Pre monsoon |
Average |
Remarks permissible value with reference to WHO (300 mg/l ) |
|
1 |
S1 |
308 |
323 |
337 |
322.66 |
Excessive |
|
2 |
S2 |
316 |
346 |
365 |
342.33 |
Excessive |
|
3 |
S3 |
402 |
425 |
442 |
423.00 |
Excessive |
|
4 |
S4 |
308 |
322 |
336 |
322.00 |
Excessive |
|
5 |
S5 |
322 |
335 |
358 |
338.33 |
Excessive |
|
6 |
S6 |
325 |
340 |
360 |
341.66 |
Excessive |
|
7 |
S7 |
348 |
362 |
377 |
362.33 |
Excessive |
|
8 |
S8 |
295 |
305 |
322 |
307.33 |
Excessive |
|
9 |
S9 |
410 |
430 |
451 |
430.33 |
Excessive |
|
10 |
S10 |
525 |
560 |
574 |
553.00 |
Excessive |
Result and discussion
The result of different parameter compered individually by taking data of pre monsoon, monsoon & post monsoon seasons which are reflected in table 01 to 10 and
in figure 01 to 10.
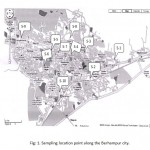 |
Figure 1: Sampling location point |
pH
Maximum pH observed at sample station S-9 i.e. 7.8 and minimum was observed at sample station S-2 is 6.9. The pH range in all the station is with in permissible limit i.e. 07 to 8.5 (WHO) standard.
Table 10: Seasonal variation of Alkalinity mg/l value with average and permissible value
|
Sl. No |
Location points |
Mon soon |
Post monsoon |
Pre monsoon |
Average |
Remarks: Permissible value with reference to WHO (900 mg/l ) |
|
1 |
S1 |
652 |
630 |
615 |
632.33 |
Permissible |
|
2 |
S2 |
702 |
690 |
670 |
687.33 |
Permissible |
|
3 |
S3 |
590 |
540 |
525 |
551.667 |
Permissible |
|
4 |
S4 |
680 |
530 |
510 |
573.33 |
Permissible |
|
5 |
S5 |
648 |
634 |
522 |
601.33 |
Permissible |
|
6 |
S6 |
705 |
659 |
634 |
666.00 |
Permissible |
|
7 |
S7 |
680 |
440 |
510 |
543.33 |
Permissible |
|
8 |
S8 |
710 |
670 |
642 |
674.00 |
Permissible |
|
9 |
S9 |
850 |
740 |
620 |
736.66 |
Permissible |
|
10 |
S10 |
600 |
530 |
511 |
547.00 |
Permissible |
Table 11: Seasonal variation of chloride (Cl-1) mg/l value with average and
permissible value
|
Sl. No |
Location points |
Mon soon |
Post monsoon |
Pre monsoon |
Average |
Remarks: permissible value with reference to WHO (200 mg/l) |
|
1 |
S1 |
98 |
105 |
110 |
104.33 |
Permissible |
|
2 |
S2 |
105 |
125 |
127 |
119.00 |
Permissible |
|
3 |
S3 |
220 |
215 |
217 |
217.33 |
Excessive |
|
4 |
S4 |
115 |
124 |
125 |
121.33 |
Permissible |
|
5 |
S5 |
118 |
127 |
127 |
124.00 |
Permissible |
|
6 |
S6 |
106 |
121 |
121 |
116.00 |
Permissible |
|
7 |
S7 |
118 |
127 |
130 |
125.00 |
Permissible |
|
8 |
S8 |
129 |
139 |
140 |
136.00 |
Permissible |
|
9 |
S9 |
225 |
218 |
216 |
219.66 |
Excessive |
|
10 |
S10 |
230 |
239 |
236 |
235.00 |
Excessive |
Maximum turbidity was observed at sample station S-5 is 16.2 and minimum was observed at sample station S-7 is 9.5 NTU. The result revels that the turbidity range all the station is above the desirable limit value i.e. 5 (NTU) in drinking water (WHO) standard. This may attributed to the pressure of Ca2+ and total Hardness (TH).
Table 12: Seasonal variation of calcium (Ca2+) mg/l value with average and permissible value
|
Sl. No |
Location points |
Mon soon |
Post monsoon |
Pre monsoon |
Average |
Remarks: Permissible value with reference to WHO (75 mg/l) |
|
1 |
S1 |
69 |
82 |
79 |
76.66 |
Excessive |
|
2 |
S2 |
78 |
99 |
80 |
85.66 |
Excessive |
|
3 |
S3 |
92 |
115 |
104 |
103.66 |
Excessive |
|
4 |
S4 |
75 |
102 |
89 |
88.66 |
Excessive |
|
5 |
S5 |
81 |
116 |
102 |
99.66 |
Excessive |
|
6 |
S6 |
79 |
124 |
111 |
104.66 |
Excessive |
|
7 |
S7 |
110 |
126 |
180 |
138.66 |
Excessive |
|
8 |
S8 |
120 |
145 |
122 |
129.00 |
Excessive |
|
9 |
S9 |
125 |
147 |
127 |
133.00 |
Excessive |
|
10 |
S10 |
111 |
112 |
110 |
111.00 |
Excessive |
Table -13: Seasonal variation of Magnesium (Mg2+) mg/l value with average and
|
Sl. No |
Location points |
Mon soon |
Post monsoon |
Pre monsoon |
Average |
Remarks: Permissible value with reference to WHO (50mg/l ) |
|
1 |
S1 |
180 |
169 |
132 |
160.33 |
Excessive |
|
2 |
S2 |
176 |
158 |
127 |
153.66 |
Excessive |
|
3 |
S3 |
200 |
190 |
140 |
176.66 |
Excessive |
|
4 |
S4 |
182 |
173 |
144 |
166.33 |
Excessive |
|
5 |
S5 |
170 |
156 |
123 |
149.66 |
Excessive |
|
6 |
S6 |
162 |
149 |
120 |
143.66 |
Excessive |
|
7 |
S7 |
158 |
151 |
129 |
146.00 |
Excessive |
|
8 |
S8 |
151 |
142 |
131 |
141.33 |
Excessive |
|
9 |
S9 |
150 |
142 |
131 |
141.00 |
Excessive |
|
10 |
S10 |
295 |
282 |
138 |
238.32 |
Excessive |
Permissible value
TDS
Maximum Total Dissolved Solid (TDS) was observed at sample station S-10 is 840 mg/l and minimum was observed at sample station S-1 is 510 mg/l. The result revels that this value is excessive value for drinking water at the ten sample station i.e. 500 mg/l (WHO) standard. In water total dissolved solids are composed mainly Carbonate, bicarbonate, Magnesium, Salt and other particles.
ELECTRICAL CONDUCTYVITY
Maximum E-Conductivity (EC) was observed at sample station S-10 i.e. 2.3 ms/cm and minimum was observed at sample station S 1 i.e 1.1 ms/cm (Fig. 2). The result revels that this value is with in the range value for drinking water at the ten sample stationi.e. 1.1 to 1.3 ms/cm (WHO) standard.
Table 14: Seasonal variation of Nitrate (No3-) mg/l value with average and permissible value
|
Sl. No |
Location points |
Mon soon |
Post monsoon |
Pre monsoon |
Average |
Remarks: Permissible value with reference to WHO (50mg/l ) |
|
1 |
S1 |
35.1 |
33.2 |
31.2 |
33.16 |
Permissible |
|
2 |
S2 |
36.0 |
34.5 |
34.5 |
35.00 |
Permissible |
|
3 |
S3 |
26.8 |
25.3 |
34.7 |
28.93 |
Permissible |
|
4 |
S4 |
24.6 |
24.6 |
22.3 |
23.83 |
Permissible |
|
5 |
S5 |
22.2 |
23.2 |
22.1 |
22.50 |
Permissible |
|
6 |
S6 |
32.4 |
32.4 |
31.0 |
31.93 |
Permissible |
|
7 |
S7 |
29.0 |
28.4 |
28.4 |
28.60 |
Permissible |
|
8 |
S8 |
37.2 |
35.2 |
34.3 |
35.56 |
Permissible |
|
9 |
S9 |
38.5 |
38.4 |
32.1 |
36.33 |
Permissible |
|
10 |
S10 |
36.2 |
34.3 |
34.3 |
34.93 |
Permissible |
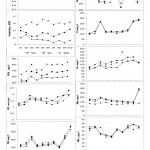 |
Figure 2: Seasonal variation of water quality parameters along Berhampur city. Click here to View figure |
TOTAL HARDNESS (TH)
Maximum Total Hardness (TH) was observed at sample station S-10 is 574 mg/l in pre monsoon season and minimum was observed at sample station S-3 is 295 mg/l in monsoon season(Fig. 2). The TH of all station has crossed the permissible limit i.e. 300 mg/l (WHO) standard. This value is more pronounced in pre monsoon season (Fig. 2). This may be due to nature accumulation of salt from contact with soil or it may enter from direct pollution by the human activity. This revels that the drinking water of such station for under hard water category.
ALKALINITY
The alkalinity value seems to be highest in monsoon season at station S-9 is 850 mg/l at sample station and minimum at sample station S-7 is 440 mg/I in post monsoon season. The high alkalinity value in the study is at sample station S-9 in monsoon season is due to increase in action of carbonate as the basic material in the soil, due to this reason the drinking water sample station of S-9 is unpleasant to taste. Cl- Maximum chloride was observed at sample station S-10 is 239 mg/l in post monsoon season and minimum was observed at sample station S-1 is 98mg/l in monsoon season. The result shows that at station S-9 the Cl- value is also high. In this season the high amount of Cl- in ground water may be due to atmospheric precipitation, animal feeds, use of inorganic fertilizer and leaching process of the soil.
Ca2+
All the stations have high amount of Ca2+ ion present. High amount of calcium was found in the monsoon season ,post monsoon, pre monsoon which is due to geological material aquifers which is composed of calcium mixed with ground water and is found in it suspension. Maximum calcium was observed at sample station S-7 is 180 mg/l in pre monsoon season (Fig. 2).
Mg2+
The magnesium values seems to be highest in monsoon season at the sample station S-10 is 295 mg/l and minimum at the sample station S-6 is 120mg/l in pre monsoon season. The results revel that the values of magnesium range in all stations above the desirable limit value i.e 50 mg/l in drinking water (WHO) standard. This may be attributed to domestic waste, medical waste and also fall in water level.
NO3-
In the study area there is no significant change in nitrate concentration and the maximum nitrate was observed at sample station S-9 is 38.5 mg/l in monsoon season and minimum was observed sample station S-5 in 22.1 mg/l in pre monsoon season (Fig. 2). The Nitrate range in all the stations is within the permissible limit i.e 50 mg/l (WHO) standard.
CONCLUSION
From the above study it is concluded that all the ten selected location of the Berhampur city does not meet all the standard values of parameters, It is observed that the location S-3, S-9 and S-10 have highest values of parameters except nitrate ,magnesium ,PH ,alkalinity .the highest value Of WQI .Therefore observed at S-3, S-9, and S-10 this three location of ground water are not suitable for human consumption ,for there the value of magnesium, calcium, and chloride are significantly inter related and indicate that the hard ness of water is permanent in nature. So the ground water need some degree of treatment before consumption and the ground water needs to be protected from future contamination and the quality of ground water may be improved by the inflow of fresh water of good quality during rainy season.
Reference
- Adekunle, A.S. Effects of industrial effluent on quality of well water within ASa Dam Industrial Estate, Ilorin Nigeria. Nature and science: 7(1), (2009).
- APHA, Standard methods for examination of water and waste water. American public Health Association Washington D.C. 19th Edition, (2005).
- BIS (Bureau of India standards) 10500. Indian standard drinking water. Specification. First revision. PP 1-8. (1991).
- Chauhan, A., Pawar, M., and Lone, S.A., , Water quality status of Golden Key lake in clement town, Dehradun, Uttarakhand. J. Am. Sci. (611):459-464(2010).
- Horten, R.K., (1965), An Index number for rating water quality. J. Water Poll. Cont. Fed. 37(3):300-306.
- Indian standard specification for drinking water IS: 10500, Bureau of Indian standard specification standards, New Delhi, (1998).
- Kakati, S.S., and Sarma, H.P., Water quality index of drinking water of Lakhimpur district. Indian J. Environ. Prot. 27(5):425:428,(2007).
- Pandey, sandeep K, Tiwari, S. Physico – chemical analysis of ground water of selected area of Ghazipur city. A case study nature and science, 7 (1). (2009).
- Patel and Sing., Journal of Env. Pollution,(1998).
- Sahu BK. Panda.RB, Sinha BK and Nayak .Water quality Index of the river Brahamani at Rourkela Industrial Complex of Orissa. J. Eco- toxical. Environ. Moni. 1(3): 169:175, (1991).
- Sinha D.K., Shilpi S. and Ritesh S. Water Quality Index for Ram Ganga River at Mordabad. Poll. Res. 23(3): 527-531, (2004).
- Tiwari T.N., and Mishra M.A., A preliminary assignment of water quality index of major Indian rivers. Indian J Environ Prot., 5(4): 276 – 279 (1985).
- Trivedy, R.K., and Goel, P.K, Chemical and Biological methods for water pollution studies environmental publications, Karad, 1-112, (1984).
- WHO (World Health organization) Guidelines for drinking water Quality. 2nd Ed, , Vol. I.P. 188,(1993).
- WHO, Guidelines for drinking water quality world Health organization, Geneva (1993)
- WHO,, International standard or drinking water. World Health organization, Geneva, 3rd Edn.:(1971).


