Assessment of the Water Quality in Buhisan, Bulacao and Lahug Rivers, Cebu, Philippines Using Fecal and Total Coliform as Indicators
Eukene Bensig1 * , Mary Joyce flores1 and Fleurdeliz Maglangit1
1
University of the Philippines Cebu,
Cebu,
6000
Philippines
http://dx.doi.org/10.12944/CWE.9.3.03
This study was conducted to evaluate and compare the water quality of Buhisan, Bulacao and Lahug rivers in Cebu, Philippines using coliforms as indicators. Monthly sampling started from November 2011 to April 2012 in the upstream, midstream and downstream stations. The multiple tube fermentation technique was used for the analysis of coli forms. High total and fecal coli form counts were observed in the three rivers from February to April, but the difference in values across time was not significant. Fecal coli form counts of Buhisan and Bulacao rivers differed significantly across sampling stations. This was most likely due to the low fecal coli form (FC) values in the upstream compared with the midstream and downstream. The generally high FC and TC levels throughout the sampling period confirmed the presence of fecal pollution in the rivers. Organic pollution and the presence of coli forms could be related to the accumulation of waste water due to high impact human activities across the river networks. It is therefore recommended to conduct an inventory and monitor non-point sources of water pollution, establish waste water treatment measures and enforce policies for river protection.
Copy the following to cite this article:
Bensig E, Flores M. J, Maglangit F. Assessment of the Water Quality in Buhisan, Bulacao and Lahug Rivers, Cebu, Philippines Using Fecal and Total Coliform As Indicators. Curr World Environ 2014;9 (3) DOI:http://dx.doi.org/10.12944/CWE.9.3.03
Copy the following to cite this URL:
Bensig E, Flores M. J, Maglangit F. Assessment of the Water Quality in Buhisan, Bulacao and Lahug Rivers, Cebu, Philippines Using Fecal and Total Coliform As Indicators. Curr World Environ 2014;9(3). Available from:http://www.cwejournal.org/?p=7298
Download article (pdf) Citation Manager Publish History
Introduction
In developing nations, water problems exist. This could be partly due to untreated waste waters from domestic, agricultural and industrial sources which are discharge into rivers and waterways, leading to severe water pollution and spreading of infectious diseases. An assessment of the microorganisms (i.e. coli forms) can provide an indication of water quality in the rivers. Fecal coli forms (FC) are normally associated with the fecal matter from warm bloodied animals while total coli forms (TC) are naturally occurring. Their presence in the rivers indicates fecal contamination, thereby posing a health risk. Further, high inputs of waste water into the waterways can magnify their numbers which can disrupt natural processes leading to water quality impairment. The Cebu City government initiated efforts to protect and rehabilitate the rivers. In line with this, the Cebu Academic Network (CAN), a partnership between the academe and the Local Government Unit (LGU) was created. Nonetheless, CAN’s efforts were constrained due to lack of scientific studies that could address the real status of the rivers. Further, tests and monitoring of the biological component of the rivers in Cebu City were not carried out. There are no existing databases that can provide information on water quality to allow for comparisons and trend analysis; to identify high risk areas; and to allow prioritization of water quality parameters to be monitored. In consequence, the health/ill health of the rivers was not monitored.
Hence, this study was conducted to assess the water quality of the rivers namely, Buhisan, Bulacao and Lahug. Specifically, it aimed to: (1)measure the TC and FC levels of the three rivers and (2) compare the coli form levels in space and time.
Materials and Methods
Study Sites
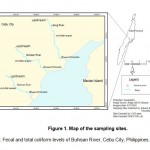
Figure 1 shows the study sites of the 3 rivers namely Buhisan, Bulacao and Lahug. Buhisan River with a basin area of 17.8km² spans approximately 11.8 km is a complex river system traversing 11 barangays before draining to the Mactan Channel. Bulacao River on the other hand, has an approximate length of 12.7 km and a basin area of 10.7 km². Lahug River serves as a natural flood drain for the city of Cebu. It covers 8.5 km long with a basin area of 6.3 km².
|
|
Figure 1: Map of the sampling sites. |
Sample Collection and Analysis
Water samples for fecal and total coli form bacteria were taken from the sampling sites (upstream, midstream and downstream) from November 2011 to April 2012. They were collected from the stream center and kept in a container with ice. The Multiple Tube Fermentation Technique (MTFT) was employed for the laboratory processing and analysis of the collected samples in which the results are statistically expressed in terms of the Most Probable Number (MPN).
Result an Discussion
FC and TC levels in the Upstream Sites
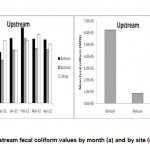
In general, FC counts were lower in November and December. However, on the temporal scale, the upstream FC value of the three rivers (Fig. 2) did not differ significantly (p= 0.314).
Bulacao River consistently had the least FC values throughout the sampling period with the lowest recorded on December at 4.9x10³ MPN/100ml. The result could be attributed to the flushing effect since December still fits into the rainy season. Rainfall data from the Philippines Atmospheric Geophysical and Astronomical Services (PAGASA) showed the most number of days that rained (22 days), the highest daily rainfall (185.4 mm), and the highest average monthly rainfall (13.7 mm), occurred in December. Bacteria count is reduced tremendously in the monsoon months due to flushing effect; while count is high in the pre-monsoon month due to surface runoffs. The bacterial count again increases in the post monsoon period with reduced water flow.2 On the other hand, Buhisan River had the highest recorded FC value of 2.8x10⁶ MPN/100ml in February. However, the differences in mean FC values in the upstream sites of the 3 rivers were not significant (p=0.354). This could mean that even the upstream areas of the 3 rivers were already experiencing degradation in quality.
The FC count at the upstream reference locations were observed to be generally lower than the other sections of the rivers (Fig. 2) implying lesser anthropogenic influence. The results are similar with the findings of Anand et al. (2004) in which the difference in terms of reduction in bacterial count was observed as the river water reaches upstream probably due to a more water retention time, the catchment area and dilution. of the 3 rivers, the upstream site of Bulacao had the least FC count, which could be due to the lesser degree of fecal contamination as a function of population density. Increases in the number of pathogens in water bodies are directly proportional to population density, so numbers of pathogens in rivers, streams and lakes are related to populations of cities.3 Of the 3 upstream sites, Lahug had more households lining the river banks, followed by Buhisan. On the other hand, households were scarce in Bulacao upstream site though human activities (i.e. washing, bathing) were apparent.
|
|
Figure 2: Upstream fecal coli form values |
Although the month of November had generally low TC count (Fig. 3a), there was no significant temporal variation of the TC results for the upstream sites of the 3 rivers (p=0.130). Buhisan in the month of November had the least TC count of 5.4x10³ MPN/100ml while Lahug in the month of March showed the highest count of 9.2x10⁶ MPN/100ml (Fig. 3b).
|
|
Figure 3: Upstream total coliform values |
Temporal conditions may vary substantially between daily bacteria samples due to the natural die-off of bacteria, additional inputs of bacteria to the river, and/or the transport of pollutants within a 24-hour period.4 Although Bulacao had the lowest TC count for the upstream section, the upstream value of the 3 rivers did not differ significantly with each other (p=0.371). This could be because the TC counts for the upstream sites were all high.
FC and TC levels in the midstream sites
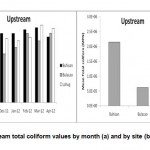
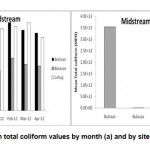
In general, December (2011) and April (2012) had the lowest FC counts. Bulacao River had the least FC value (4.0x10³ MPN/100ml) recorded in the month of January while Buhisan had the highest in the months of January and February (2.4 x10¹³ MPN/100ml). However, Figure 4 shows no significant difference through time (p=0.464) for the midstream sites of the 3 rivers.
|
|
Figure 4: Midstream fecal coli form values |
The significant decrease in the FC count in the midstream section of Bulacao River in January could be due to the rain which occurred during sampling. Transport, dilution, dispersion, and concentrations of fecal coliform are strongly influenced by the timing, spatial distribution, and amount of rainfall, runoff, and streamflow; and that light penetration, which is reduced by turbidity, is the most important factor in determining decay rates.5 Interestingly, Lahug and Buhisan midstream sites did not show a substantial decrease during the January sampling, most likely due to retention time. River waters in these sites were stagnant. Overall, the FC values were high and failed to reach the acceptable limit of 1.5 x10⁴ MPN/100ml for Class C waters except for Bulacao in the month of January. This could mean that all throughout the sampling period, the river quality was poor pertaining to the coliform parameter. Similarly, there was no significant variation in FC values of the midstream sections of the 3 rivers (p=0.60). This could be because the average FC values for the midstream sites of the 3 rivers were consistently high. Fecal coliform bacteria could have come from untreated sewage and effluents, from animal husbandry, storm water run-off, and leachate from open waste dumps.3
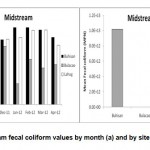
For the TC in the midstream sections of the 3 rivers (Fig. 5), values were consistently high. On the temporal scale, the midstream TC value of the 3 rivers did not differ significantly (p=0.465).Similar to FC, Bulacao River consistently had the least TC count throughout the sampling period with the lowest recorded on January (2.4 x10⁶ MPN/100ml). Buhisan and Lahug had the highest TC counts (1.6x10¹⁴ MPN/100ml) in the months of February and March. High coliform counts were expected from February to April. The coliform count during the dry season is low since the source of biological deposits are generally just the broken sewers and storm water pipes which become the major sources of river water.6 On a spatial scale (Fig. 5b), the mean values for the midstream sites of the 3 rivers did not differ significantly (p=0.390). Further, the high TC results signified urban related river pollution resulting from discharge of untreated solid and liquid wastes into rivers from both domestic and industrial sources; the increase in silt loads because of expansion of urban land use into peri-urban areas; and overflows of wastewater because of high surface runoff associated with increased impermeable areas.3
|
|
Figure 5: Midstream total coli form values |
FC and TC levels in the downstream sites
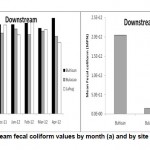
Generally, the downstream sections of the 3 rivers show high FC counts throughout the sampling periods (Fig. 6). However, no significant difference was observed in the downstream sites of the 3 rivers (p=0.658).Lahug had the least FC count of 4.0 x10⁹ MPN/100ml in April and the highest was 7.8x10¹² MPN/100ml in Buhisan. Similarly, there was no spatial variation in the downstream sites of the 3 rivers (p=0.184). It is expected that FC counts in the downstream sites would be highest primarily because they are the receiving points towards the estuaries.The downstream sites of the 3 rivers shared a common feature, having closely packed households along the river banks. Fecal bacteria counts are related to housing density, population, development, percent impervious area, and domestic animal density.7 Also, the high fecal coliform counts in the downstream are due to sewage discharges from domestic sources. Cities and suburbs contribute human wastes to rivers through their sewer systems.8
|
|
Figure 6: Downstream fecal coliform values |
Consistently, the downstream sections showed high TC counts within the entire study period (Fig. 7). However, there was no significant variation observed through time (p=0.633). The high values signified the ill condition of the waterways.Bulacao River had the least TC value (9.4x10¹⁰ MPN/100ml) in February while Buhisan and Bulacao Rivers had the highest value (1.7x10¹⁴ MPN/10ml) recorded in April. Also, the downstream sites of the 3 rivers did not differ significantly (p=0.237). The lack of significant difference could be due to the consistently high values, implying a deteriorating status of the water quality of the rivers.
|
|
Figure 7: Downstream total coli form values |
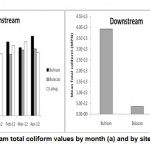
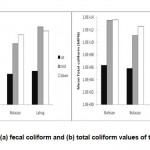
Figure 8 shows the mean fecal and total coli form counts of all the sections of the 3 rivers. In general, the upstream sections of the 3 rivers had the least FC and TC counts throughout the sampling period.
|
|
Figure 8: Mean (a) fecal coli form and |
Mean FC and TC values
The mean FC and TC values for the upstream sites of the 3 rivers did not show significant difference (p=0.354 and p=0.371, respectively). Consistently, Bulacao had the lowest mean FC and TC counts (8.54x10⁴ MPN/100ml and 6.18x10⁵ MPN/100ml, respectively) for the upstream section. Buhisan and Lahug showed the highest FC and TC values at 6.26 x10⁵ MPN/100ml and 2.54x10⁶ MPN/100ml, respectively. This could be a function of population density; fewer people, lesser degree of fecal contamination; more people, higher degree of fecal contamination. Nonetheless, all upstream sites failed to meet the stipulated standard limit for Class C surface waters of 1.5 x 10⁴ MPN/100ml. On a spatial scale, there was no significant variation in FC (p=0.60) and TC (p=0.390) values of the midstream sections of the 3 rivers. This could be because the average values for the midstream sites of the 3 rivers were all high. Similarly, the FC and TC values (p=0.184 and p=0.237) showed no significant variation in the downstream sections of the 3 rivers. It is expected that coliform counts in the downstream sites would be highest primarily because they are the receiving points towards the estuaries. The lack of significant difference could be due to the consistently high values, implying a deteriorating status of the water quality of the rivers. The least FC and TC values were noted in Bulacao at 1.49x10¹¹ MPN/100ml and 3.49x10¹² MPN/100ml. Buhisan showed the highest FC and TC values at 2.05x10¹² MPN/100ml and 3.93x10¹³ MPN/100ml respectively.Fecal contamination and untreated discharges into the waterways resulted into high coliform counts in the studied rivers. Consequently, this revealed the ill status of the rivers. It is recommended to establish programs and initiatives for the three rivers not only for water source protection but also to arrest their deteriorating conditions.
References
1. Bensig, E., Flores, MJ. and Maglangit, F. Fecal and total coliform levels of Buhisan River, Cebu City, Philippines. International Journal of Research in Environmental Science and Technology 4: 76-82, (2014).
2. Anand, C., Pratima, A. and Chakrabarti, R. Bacteriological water quality status of river Yamuna in Delhi. J Environ Biol, 27: 97-101, (2004).
3. Marcotullio, P. Urban water-related environmental transitions in Southeast Asia. Sustain Sci; 2: 27-54, (2007). DOI 10.1007/ s11625-006-0019-0
4. Eleria, A. and Vogel, R. Predicting fecal coliform bacteria levels in the Charles River, Massachusetts, USA. JAWRA; 41: 1195–1209, (2005). DOI: 10.1111/j.1752- 1688.2005.tb03794
5. Myers, D.N., Koltun, G.F. and Francy D. Effects of hydrologic, biological, and environmental processes on sources and concentrations of fecal bacteria in the Cuyahoga River, with implications for management of recreational waters in Summit and Cuyahoga Counties. Ohio: U.S. Geological Survey WaterResources Investigations Report 98–4089, (1998).
6. Wandiga, S.O. Water Quality Issues in African Rivers. In UNECA Science with Africa 2010 PAN Africa Chemistry Network Water Challenge Workshop, June 24, 2010. (Abstract)
7. Young, K.D. and Thackston, E.L. Housing density and bacterial loading in urban streams. J Environ Eng; 125: 1177-1180, (1999).
8. Gautam, B., Kasi, M. and Lin, W. Detemination of Fecal Coliform Loading and its Impact on River Water Quality for TMDL. Proceedings of the Water Environment Federation. (2006). DOI: 10.2175/193864706783751609


