Climate Change Adaptation: Real Time Nitrogen Management in Maize (Zea Mays L.) Using Leaf Colour Chart
R. K. Mathukia1 * , Puja Rathod1 and N. M. Dadhania1
1
Department of Agronomy,
College of Agriculture,
Junagadh Agricultural University,
Junagadh,
362001
Gujarat
India
http://dx.doi.org/10.12944/CWE.9.3.58
Copy the following to cite this article:
Mathukia R. K, Rathod P, Dadhania N. M. Climate Change Adaptation: Real Time Nitrogen Management in Maize (Zea Mays L.) Using Leaf Colour Chart. Curr World Environ 2014;9 (3) DOI:http://dx.doi.org/10.12944/CWE.9.3.58
Copy the following to cite this URL:
Mathukia R. K, Rathod P, Dadhania N. M. Climate Change Adaptation: Real Time Nitrogen Management in Maize (Zea Mays L.) Using Leaf Colour Chart. Curr World Environ 2014;9(3). Available from:http://www.cwejournal.org/?p=7722
Download article (pdf) Citation Manager Publish History
Introduction
Climate change poses serious threats on crop productivity. Global warming may change growth and development pattern of crop plant, which alters most of the physiological and biochemical processes in plant. As an adaptation strategy, currently recommended cultivation practices, especially fertilizer and irrigation application, need to be adjusted suitably according to climate and plant growth.
Among the cereals, maize (Zea mays L.) ranks third in total world production after wheat and rice and it is a staple food in many countries, particularly in the tropics and sub-tropics. Among the primary nutrients, nitrogen is very important as it is intimately involved in the process of photosynthesis and thus directly related to total dry matter production. Improving fertilizer nitrogen (N)-use efficiency in maize is vital not only to improve and sustain high crop yields but to reduce post field application N losses to the environment. Fertilizer N is an expensive input but farmers have tendency to apply N in large amounts to minimize yield losses due to degradation of soils due to continuous cropping without investing adequately in maintaining soil quality. Singh and Singh (2008) argued that recommendations based on soil tests remain ignorant about the dynamics of N release from crop residues, organic manures and irrigation water, and are not very successful in maize. Efficiency of fertilizer N generally declines with increased fertilizer doses, and seldom exceeds 40% (Cassman et al., 1993). Lack of proper splitting of N applications, and many a times over or under application N than the crop need is one important reason for low N-use efficiency. As N requirement of maize plant is not same throughout the growth period it is necessary to adjust fertilizer N application with the timings of plant N requirement to enhance N-use efficiency in maize. The real time N management approach can help increase N use efficiency by matching time of fertilizer application with plant need. Leaf colour chart (LCC) is a reliable tool for real time N management (Singh et al., 2002). It can be used for rapid and reliable monitoring of relative greenness of the leaf as an indicator of leaf N status. The guidelines evolved using LCC helps adopt crop demand-driven N applications and result in high crop productivity and economic returns and reduce N losses to the environment (Ahlawat, 2008; Singh et al., 2002; Singh et al., 2007a and b).
Materials and Methods
A field experiment was conducted at Instructional Farm, College of Agriculture, Junagadh Agricultural University, Junagadh (21.50N, 70.50E and 60 m above mean sea level) during rabi (post rainy) season of 2011-12 and 2012-13. The mean maximum and minimum temperature during crop growth period ranged between 27.5 to 36.00C and 9.4 to 21.30C, respectively. The experimental soil was clayey, alkaline in reaction (pH 7.9) with EC 0.33 (dS/m) at 250C, medium in available nitrogen (N) (281.8 kg/ha), available phosphorus (P) (13.40 kg/ha) and available potash (K) (207.2 kg/ha). Experiment was laid out in randomized block design and with three replications. Treatments included; T1 : 50 kg N/ha at 30 DAS + 30 kg N/ha at 60 DAS (Fixed time N application) T2 : 50 kg N/ha + 30 kg N/ha when LCC=2 T3 : 40 kg N/ha + 20 kg N/ha when LCC=2 T4 : 50 kg N/ha + 30 kg N/ha when LCC=3 T5 : 40 kg N/ha + 20 kg N/ha when LCC=3 T6 : 50 kg N/ha + 30 kg N/ha when LCC=4 T7 : 40 kg N/ha + 20 kg N/ha when LCC=4 T8 : 50 kg N/ha + 30 kg N/ha when LCC=5 T9 : 40 kg N/ha + 20 kg N/ha when LCC=5 Maize crop (var. GM-6) was sown on 11th November 2011 and 14th November 2012 using seed rate of 25 kg/ha and spacing of 60 cm x 30 cm. A basal dose of 50 kg P2O5/ha and 20 kg N/ha using di-ammonium phosphate and urea was applied in all the treatments. Crop was grown under fully irrigated conditions; total water applied was 550 mm in 11 irrigation schedules. Two hand weeding were done 30 and 45 days after sowing to reduce the crop-weed competition. No serious incidence of any insect-pest or disease was observed in the crop. The cobs were harvested after attaining physiological maturity. A ‘six panel’ LCC was used to match leaf colour in five plants in each plot starting from 21 days after sowing (DAS). LCC measurements were taken following guidelines as laid out by IRRI (http:// nitrogenparameters.com/irri.html). The methodology used for taking LCC readings is as under.- Starting from 21 DAS, LCC readings were taken from randomly selected 5 plants in each plot.
- Observations were taken from the top most, fully expanded and healthy leaf of each of the 5 plants by matching colour shade of LCC and average score was worked out.
- Readings were taken by placing the middle part of the leaf on top of the LCC’s colour strips for comparison.
- Leaf was not detached.
- Readings were taken at same time of the day (8:00-10:00 AM).
- The LCC was not exposed to direct sunlight during readings.
- The same person has taken the first up to the last LCC reading.
- If average reading below the critical LCC value, N was given as per treatments.
- LCC readings were repeated after 7 days and same 5 plants were observed.
- Leaf chlorophyll content was analysed as per method suggested by Sadasivam and Manickam (2004). Economic analysis of the data was done based on the prevailing cost of inputs/operations and price of the marketable produce.
A positive and highly significant correlation was found between LCC shades, leaf N content and leaf chlorophyll content (Table 1) which indicates that the LCC could be effectively used to decide the timings of fertilizer N application in standing crop for better synchronization of crop N demand with supply. Leaf N status is closely related to photosynthetic rate and biomass production, and it is a sensitive indicator of changes in crop N demand within a growing season (IRRI). The chlorophyll or soil plant analysis development (SPAD) meter, and its inexpensive and simple alternative, the LCC can be used for rapid and reliable monitoring of relative greenness of the leaf as an indicator of leaf N status (Singh et al., 2002). LCC being cheaper and user friendly thus could be used to improve fertilizer N use efficiency and improve productivity largely in developing countries where farmers cannot afford their costly and more SPAD meter.
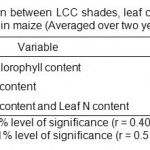 |
Table 1: Simple correlation between LCC shades, leaf chlorophyll content and leaf nitrogen content in maize (Averaged over two years). Click here to View table |
Effect on Growth and Yield
Real time application of 80 kg N/ha in two splits at LCC 4, being at par with application of 80 kg N/ha in two splits at LCC 5 and application of 60 kg N/ha in two splits at LCC 4, significantly improved growth attributes like plant height, dry matter accumulation/plant, number of leaves/plant, stem diameter, number of internodes/ plant and leaf area index (LAI) compared to that in fixed time application of 80 kg N/ha (Table 2). This could be attributed to better synchronization of N supply with crop N demand leading to higher N uptake due to real time application of 80 kg N/ha in two splits at LCC 4. It is assumed that better nutrition, as indicated by higher leaf N content, improved photosynthetic rate when 80 kg N/ha was applied in two splits at LCC 4 over fixed time application of 80 kg N/ha. Improvement in leaf chlorophyll content due to application of 80 kg N/ha in two splits at LCC 4 over fixed time application of 80 kg N/ha supports improved photosynthetic rate leading to higher growth and biomass production. The enhanced growth with LCC based nitrogen application was also reported by Singh et al. (2002) and Shukla et al. (2004).
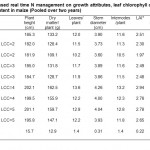 |
Table 2: Effect of LCC based real time N management on growth attributes, leaf chlorophyll content, leaf N content and grain protein content in maize (Pooled over two years) Click here to View table |
Real time application of 80 kg N/ha in two splits at LCC 4 significantly increased yield attributes viz., cob length, cob girth, number of cobs/plant, number of grains/cob, grain weight/plant and 1000-grain weight and ultimately grain (3149 kg/ha) and stover yield (4869 kg/ha) of maize as compared to fixed time application of 80 kg N/ha (Table 3). Real time application of 80 kg N/ha in two splits at LCC 4 increased grain and stover yield by 21.0 and 19.7% respectively over fixed time application of 80 kg N/ha. The significant increase in growth and biomass production due to real time N management get reflected into significant increase in yield attributes and yield of maize. These results confirm the findings of Maiti and Das (2006), Shukla et al. (2004), Singh et al. (2011) and Gajera et al. (2014). In case of treatment 80 kg N/ha in two splits at LCC 4, which gave significantly highest yield, the split application of N was given at 26 and 54 DAS. This indicates the need for revisiting the conventional N fertilizer recommendation of split dose of 30 N/ha at 30 DAS + 50 kg N/ha at 60 DAS.
Effect on Quality
Application of 80 kg N/ha in two splits at LCC 4, application of 80 kg N/ha in two splits at LCC 5 and application of 60 kg N/ha in two splits at LCC 4, significantly enhanced leaf chlorophyll content, leaf N content and grain protein content over fixed time application of 80 kg N/ha (Table 2).
This could be explained on the basis of better availability of N in the crop root zone and enhanced N uptake and consequent increase in photosynthetic and metabolic activities resulting in better partitioning of photosynthates to sinks, which got reflected in quality enhancement in terms of leaf chlorophyll content, leaf N content and grain protein content. Quality of food grains is a complex phenomenon and may be influenced by both genetic and/or environmental factors. These results are supported by the findings of Dinesh kumar (2011) and Singh (1991).
Effect on Economic Returns
While there was negligible increase in cost of cultivation due to real time application of 80 kg N/ha in two splits at LCC 4 but, it increased net returns (Rs. 25,649/ha) by 62.7% over fixed time application of 80 kg N/ha (Table 3). The B:C ratio also improved to 1.80 due to real time application of 80 kg N/ha in two splits at LCC 4 from 1.49 in fixed time application of 80 kg N/ha. Dinesh kumar (2011) has also reported higher net returns and B:C ratio with LCC based real time N management.
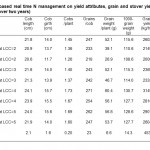 |
Table 3: Effect of LCC based real time N management on yield attributes, grain and stover yield, net return and B:C in maize (Pooled over two years) Click here to View table |
Conclusion
It can be concluded that higher yield and net returns in maize (var. GM-6) can be secured by real time application of 80 kg N/ha in two splits at LCC 4 or LCC 5 along with basal dose of 20 kg N/ha in clayey soil medium in available nitrogen in Saurashtra region of Gujarat in India.
References
- Ahlawat RPS. Reorientation of agronomic research. in: Sharma et al., editors. Souvenir, National Symposium on New Paradigms in Agronomic Research; 2008 Nov 19–21; New Delhi, India: Navsari Agricultural University, Navsari. p. 1–9 (2008).
- Cassman KG, Kropff MJ, Gaunt J, Peng S. Nitrogen use efficiency of rice reconsidered: what are the key constraints? Plant and Soil, 155/156: 359–62 (1993).
- Dineshkumar SP. Nitrogen management through leaf colour chart in bread wheat (Triticum aestivum L.) and emmer wheat (Triticum dicoccum Schrank.) under irrigated condition. Thesis submitted to the University of Agricultural Sciences, Dharwad, Karnataka, India, (2011).
- Gajera Kinjal, Mathukia RK and Jat RA. Real Time Nitrogen Management Improves Yield and Economic Returns in Wheat in Vertisols of Gujarat. Indian Journal of Fertilizers, 10(2): 56-60 (2014).
- Maiti D, Das DK. Management of Nitrogen Through the Use of Leaf Colour Chart (LCC) and Soil Plant Analysis Development (SPAD) in Wheat Under Irrigated Ecosystem. Archives of Agronomy and Soil Science, 52: 105-112 (2006).
- Shukla AK, Ladha JK, Singh VK, Dwivedi BS, Balasubramanian V, Gupta RK, Sharma SK, Singh Y, Pathak H, Pandey PS, Padre AT, Yadav RL. Calibrating the Leaf Color Chart for Nitrogen Management in Different Genotypes of Rice and Wheat in A Systems Perspective. Agronomy Journal, 96: 1606–1621 (2004).
- Singh B, Singh CP. Effect of time of Nitrogen application in wheat (Triticum aestivum) in North-Hill Condition. Indian Journal of Agronomy, 36: 326-328 (1991).
- Singh B, Singh Y, Ladha JK, Bronson KF, Balasubramanian V, Singh J, Khind CS. Chlorophyll Meter- and Leaf Colour Chart-Based Nitrogen Management for Rice and Wheat in Northwestern India. Agronomy Journal, 94: 821-829 (2002).
- Singh B, Singh Y. Reactive Nitrogen in Indian Agriculture: Inputs, Use Efficiency and Leakages. Current Science, 94: 1382–1393 (2008).
- Singh V, Singh Y, Singh B, Thind HS, Kumar A and Vashistha M. Calibrating the Leaf colour Chart for Need Based Fertilizer Nitrogen Management in Different Maize (Zea mays L.) genotypes. Field Crops Research, 120(2): 276-282 (2011).
- Singh Y, Gupta RK, Singh B, Gupta S. Efficient Management of Fertilizer N in Wet Direct-Seeded Rice (Oryza Sativa L.) in Northwest India. Indian Journal of Agricultural Sciences, 77: 561–564 (2007b).
- Singh Y, Singh B, Ladha JK, Bains JS, Gupta RK, Singh J, Balasubramanian V. on-Farm Evaluation of Leaf Color Chart for Need-Based Nitrogen Management in Irrigated Transplanted Rice in North-Western India. Nutrient Cycling In Agroecosystems, 78: 167–176 (2007a).


