Estimating the Ecological Footprint of Transportation in the City of Isphahan (Iran)
Kamran Shayesteh1 * , Kobra Melhosseini Darani1 and Alireza Ildoromi2
http://dx.doi.org/10.12944/CWE.9.3.24
Copy the following to cite this article:
Shayesteh K, Darani K. M, Ildoromi A. Estimating the Ecological Footprint of Transportation in the City of Isphahan (Iran) . Curr World Environ 2014;9 (3) DOI:http://dx.doi.org/10.12944/CWE.9.3.24
Copy the following to cite this URL:
Shayesteh K, Darani K. M, Ildoromi A. Estimating the Ecological Footprint of Transportation in the City of Isphahan (Iran). Curr World Environ 2014;9(3). Available from: http://www.cwejournal.org/?p=7441
Download article (pdf) Citation Manager Publish History
One of the most important demographic phenomena of economic and industrial development of every country is the rapid growth of cities and urban population (Isazadeh and Mehranfar,2012). Population growth typically accompanies by environmental degradation such as soil erosion, desertification and deforestation(Gharakhluo et al., 2013).Cities consume three quarters of the energy produced in the world, and are the reason of about three quarters of world`s pollution (Jomepour et al., 2013).Modern cities, by consumption of land, energy, water and food, material flow, and also emissions of green house gases, solid wastes, air and water pollution press a considerable pressure on the planet's natural environment(Zamba and Hadjibiros, 2007).Economic efficiency and social welfare depends on the ability of natural resources to provide services,while human activities that cause the destruction of resources, will lead to a decline in long-term human welfare (Borucke et al., 2013).
Great efforts have been done to identify and reduce the impact of human life on the environment.The goal of all these efforts is the creation of an ecologically sustainable city, which the use of its resources is effective,reducing ecological impacts and maintaining its ecological role provides higher living standards, and it will provide a healthier urban environment for its citizens (Barret and Simmons, 2003).
Different methods, with the aim of quantifying the effects of human activities on the natural environment have been developed(Zamba and Hadjibiros, 2007). One of the tools in order to assess the environmental impacts of resource use is the concept of Ecological Footprint. Ecological footprint estimation of a city is based on its population. The underlying philosophy of the global ecological footprint is that human activities place a demand on planets available land, thereby leaving a footprint on land(Agrawal et al., 2006).
Ecological footprint show people how the consequences of their consumption patterns press on the planet resources (Ewing et al., 2010). In other words, Ecological Footprint is used as a tool to calculate the environmental impact of human activities(Peters and Schouten, 2010).
Ecological Footprint, which assesses the relationship between people and resources, and is an indicator of carrying capacity of regions, nations and the planet, is defined as the total area of land in different ecological zones, to produce all the resources a population consumes and to absorb all of the wastes it generates, using prevailing technology and resource management practices (Wiedmann and Barrett, 2010).
The Ecological Footprint is an indicator that aims at measuring human demand on biological resources and setting it in relation to the regenerative capacity on Earth. (Wiedmann and Barrett, 2010)
The Ecological Footprint shows how much land area is required to sustain the socioeconomic use of resources for a certain period of time (in the majority of cases one year) with available technologies and given resource management conditions and to provide infrastructure and absorb waste and pollutants (Giljum et al., 2007). Both land and water surfaces are taken into account. Indeed, the object of ecological footprint is to estimate whether a region, a city or a state consume or pollute at a rate higher than the one at which biosphere is able to produce goods or to assimilate pollutants(Zamba and Hadjibiros, 2007).
The Concept of Ecological Footprint
The production in arable lands, pastures, forests, or productive seas and also the built-up areas express the human demand on nature, and the total of them is equal to ecological footprint. Because the averages of productivity in different land types are not the same, they need to be converted, using its corresponding equivalence factor in order to be expressed in global hectares.
(Schaefer et al., 2006)

Normalizing bio-productive areas, hectares to global hectares
Estimates of the ecological footprint are expressed in a common unit of measurement: global hectare (Ewing et al, 2010). Ecological Footprint is scaled with yield factors and equivalence factors to convert physical land demanded to world average biologically productive land, usually expressed in global hectares (gha) (Wiedmann & Lenzen, 2007)
Yield Factors account for the difference in production of a given land type across different nations (Kitzes et al., 2007).
Productivity is defined for a certain period of time (usually one year), certain products (like Crops, pasture-fed animal products,…) and a certain land-use (Arable land, pasture,…) (Kitzes et al., 2007; Ewing et al., 2010; Schaefer et al., 2006)
A hectare of pasture in New Zealand, for example, produces more meat on average than a hectare of pasture in Jordan(Kitzes et al., 2007). Thus, in terms of productivity, one hectare of grassland in New Zealand is equivalent to more than one world average grazing land hectare; it is potentially capable of supporting more meat production (Ewing et al., 2010). These differences may be due to natural factors, such as precipitation or soil quality, or management practices (Kitzes et al., 2007; Ewing et al., 2010).
To account for these differences, the yield factor compares the production of a specific land type in a nation to a world average hectare of the same land type. Each country and each year has its own set of yield factors. (Kitzes et al., 2007).
Equivalence factors convert the areas of different land use types, at their respective world average productivities, into their equivalent areas at global average bio-productivity across all land use types(Ewing et al., 2010).Equivalence factors translate a specific land type (i.e. cropland, pasture, forest, fishing ground) into a universal unit of biologically productive area, a global hectare(Kitzes et al., 2007). Equivalence factors vary by land use type as well as by year. (Ewing et al., 2010; Kitzes et al., 2007).In 2003, for example, primary cropland had an equivalence factor of 2.21 , indicating that primary cropland was more than twice as productive as a hectare of land with world average productivity. This same year, pasture had an equivalence factor of 0.49, showing that pasture was approximately half as productive as the average bio-productive hectare. (Kitzes et al., 2007).
The rationale behind Equivalence factors’ calculation is to weight different land areas in terms of their capacity to produce resources useful for humans. The weighting criterion is therefore not just the quantity of biomass produced, but also the quality of such biomass, meaning how valuable this biomass is for humans.(Ewing et al., 2010).
Transportation Footprint
A city is a complex and organized set that is constantly changing and evolving. This complexity and dynamism makes it necessary to have strategic planning based on accurate and updated data and information.
To calculate the ecological footprint of a city, different components can be considered: Cropland, Grazing Land, Marine and Inland water, Energy and Built-up area(Ewing et al., 2010).
This classification can be useful for better understanding the human demand on different land-use types.
A crucial impact of human activities on the environment is the risk of climate change. A big city is a major contributor to the increase of atmospheric carbon dioxide (CO2), which is the predominant greenhouse gas. An important component of this contribution is the emissions from urban transportation activities and specifically the road transport (Zamba and Hadjibiros, 2007).
One of the activities in a city that uses fossil fuels is the issue of transportation, as a result of using different types of fuels for vehicles CO2 is released into the atmosphere.For accumulated carbon dioxide in space, resulting from the use of fossil fuels by various human activities, a sink to absorb and sequester it is required(GFN, 2006). Accordingly, the amount of released CO2 is considered as a subset of energy footprint.
Footprint of transportation-related activities includes the footprint of transportation fuel consumption and the footprint of built-up areas for transportation infrastructures. Thus all forms of public transportation such as Buses, taxis, motor-cycles, private cars and freight vehicles which consume fossil fuels like CNG, LPG and petrol (Agrawal et al., 2006).
Footprint of transportation in the United States of America, Considering all kinds of vehicles ranging from private cars and trucks, motorcycles and buses, rail and air transport and passenger boats, and regarding this point that how much CO2 is released to atmosphere for consuming per KWH of each fuel, was estimated at 1.94 global hectares (Christensen et al., 2007).
In Great Britain in 2003, with regard to the water, air and rail transport , metro, buses, cars, motorbikes and scooters, and regarding infrastructures, ecological footprint of transportation of 0.67 Global hectares was calculated(Barret and Simmons, 2003).
In York, the amount of CO2produced per KWH from various types of fuels used for vehicles such as private cars, buses, motorcycles and aircrafts were calculated and Transportation Footprints of 1.49 hectares for the city was estimated.(Barrett et al., 2002)
Footprint of transportation in the city of Adelaide in Australia with regard to the use of private vehicles like cars and trucks, motorcycles, buses, rail and air transport and passenger boats was calculated as 0.66 Global hectares per capita (Agrawal et al.,2006).
In the city of Kermanshah in western Iran, considering the amount of diesel and gasoline consumption by public and private vehicles such as buses, minibuses and cars and motorcycles, the ecological footprint of transportation was estimated at 0.32 hectares (Gharakhluo et al., 2013).
Material and Methods
Isphahan has long been an important urban center on the plateau of Iran,its area is approximately 17,585 hectares and about 1,978,168 people are living there in 14 districts (Zarrabi et al., 2009). A variety of vehicles, including buses, trucks, personal cars and motorcycles are used in Isphahan, each of which has its own fuel.
An estimation of the ecological footprint related to the impact of road transport combines activities such as (Barret and Scott, 2010)
- The CO2, NOx and Methane emissions from burning of fossil fuels in vehicle engines.
- The CO2 emissions from manufacture and maintenance of vehicles and road infrastructures.
- The road space and the other land that is occupied by different vehicle facilities.
The methodology developed to calculate the ecological footprint of transportation networks is presented as a chart in Fig. 1. As indicated by the figure, our approach consists of three principal steps (Chi and Stone, 2005)
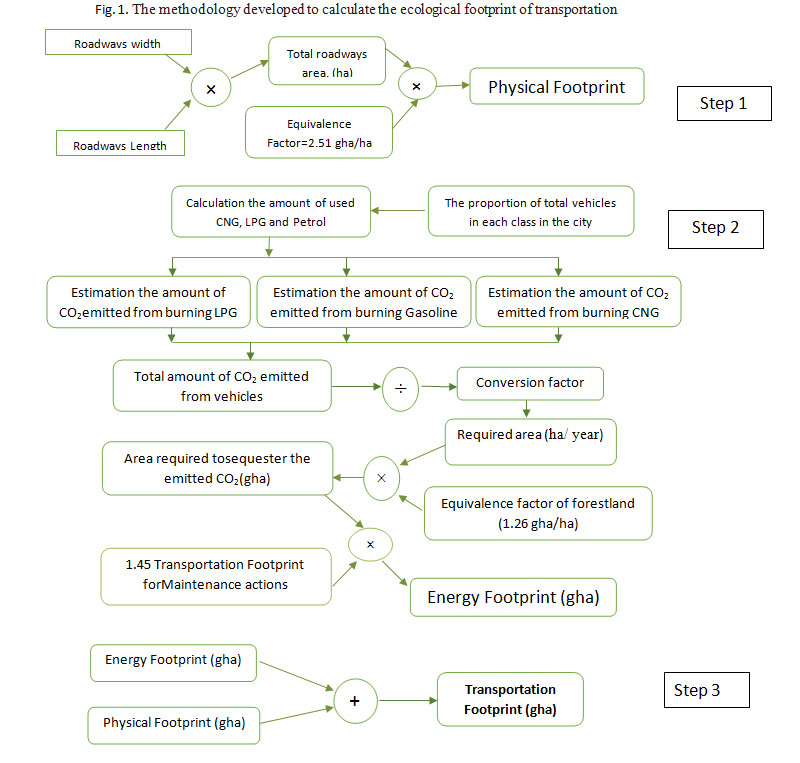 |
Figure 1: The methodology developed to calculate the ecological footprint of transportation Click here to View figure |
- Estimating the physical footprint of the roadway network on the basis of the surface area of roadway paving; (step 1)
- Estimating the energy footprint of the roadway network on the basis of the area of forest land required to sequester carbon emissions produced by network travel during one year; (step 2) And
- Combining the land areas of the physical and energy footprints to derive an estimate of the total transportation footprint. (Step 3).
For Energy Footprint (step 2), the total quantity of fuel consumed in one year of travelling along the study area is estimated. To calculate the land area required to absorb or sequester the CO2 emitted from burning fossil fuels used in urban transport, the footprint of each fuel is regarded separately because of the differences in the rate of CO2 emissions per volume unit of each fuel. (Based on data cited in tables 1, 2 and 3)
In addition to fuel consumed through vehicle travel along a network, energy consumed in the process of network construction and annual road maintenance must also be reflected in the total transportation network footprint (Chi and Stone, 2005). Wackernagel and Rees (1996) estimated that the indirect carbon emissions for road construction and maintenance are equivalent to 45% of the total annual fuel consumed for vehicle travel. This estimate is multiplied by a carbon sequestration factor to estimate the area of forestland required to absorb the CO2 emitted from fuel consumption in the study area. (Zamba and Hadjibiros, 2007). The equivalence factor for Energy footprint is 1.26 (Ewing et al., 2010). And finally, Transportation Footprint (Step 3) is the summation of physical and Energy footprints.
Table 1: Totals vehicles in each category, traveling in Isphahan (2011)
| Bus/Minibus | Taxi | Truck | Motorcycle | Pick-up | Public Transport | Private car |
| 2800 | 25,000 | 3400 | 514,000 | 77,000 | 10,000 | 700,000 |
Table 2: The quantity of fuel consumed in Isphahan (2011)
| Product | Liquid Gas | Natural Gas | Regular Gasoline | Premium Gasoline |
| Unit | ton | Million m3 | Million liter | Million liter |
| quantity | 1756 | 121 | 589 | 27 |
Table 3: Detailed data of Isphahan transportation footprint (2011)
|
Components |
Consumption Quantity |
Released |
Conversion Factor |
Ecological Footprint (ha/year) |
Equivalence Factor |
Ecological Footprint (gha/year) |
|
Regular Gasoline |
589 Million Liter |
1432200 |
3.996 Ton |
358408.4 |
1.26 gha/ha |
451594.58 |
|
Premium Gasoline |
27 Million Liter |
|||||
|
CNG |
121 Million m3 |
283697.568 |
70995.38 |
89454 |
||
|
LPG |
1756 ton |
5268 |
1318 |
1661 |
||
|
Maintenance actions |
45%Energy Footprint |
193825 |
244219.32 |
|||
|
Built-up land |
3506 ha |
3506 |
2.51gha/ha |
8800 |
||
|
Sum |
628053 |
795728.9 |
||||
Results
The portion of each part in the Transportation Footprint of Isphahan is shown in Figure2.
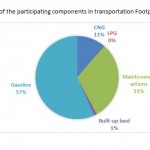 |
Figure 2: Share of the participating components |
According to the above calculations, required forest land for transportation in Isphahan equals 795728.9 global hectares, or 0.4 gha per capita. If the total area of the city, using the equivalence factor, is converted to global hectares, per capita availability of available land for every Isphahan citizen is about 0.022 global hectares, while the per capita footprint of transportation is 0.4 Global hectares. This means that the land needed to meet the transportation requirements of each person is 18 times the per capita availability of land for every person in the city of Isphahan. Transportation is one component of total Ecological Footprint and this illustrates the fact that cities placing further environmental burdens on city hinterlands. They have drawn in energy and matter from all over the ecosphere. (Wackernagel and Rees, 1996)
CO2 release to atmosphere depends directly on the amount of fuel consumed. Releases of other gases depend on other factors like speed, acceleration and vehicle type. Thus, the type of vehicle, its technology and the type of fuel affect the emission control.
Conclusion
The concept of Ecological Footprint has received considerable attention as a useful indicator in the context of sustainable development. This concept can be a useful analytical method for estimating the total impacts of different activities such as transportation and the air pollution that is resulted from vehicles traffic.
There are different kinds of vehicles used in Isphahan as the study area of this survey, and the forest land required to absorb the CO2 emissions released to atmosphere from these vehicles was estimated at 799688.9 global hectares, that is 18 times the size of Isphahan. This estimation is comparable to other findings like the corresponding estimation for Oslo which is about 22.5 (Aall and Norland, 2002).
Ecological Footprint can act as a strong statement in studies to identify potential sources of unsustainability; in the field of transportation, Environmental Impacts of using different fuels is an important factor in transportation planning. As can be seen in the chart, gasoline has a major role in the transportation footprint of Isphahan, so a decrease in the proportion of gasoline, would lead to a decrease in ecological footprint and the total impacts of transportation on the natural environment.
References
- Isazadeh S. and Mehranfar J., The Correlation Between Energy Consumption and the Level of Urbanization in Iran (Application of Vector Error Correction Model and Factor Decomposition Model), Quarterly Journal of Economic Strategy, Volume 1. No.2, pp 47-70. (2012). (In Persian).
- Gharakhluo M.; Hataminejad H.; Baghvand M. and Yalve M. Urban Sustainable Development Assessment with Regard to Footprint Ecological Method (Case Study: Kermanshah City), Human Geography Research Quarterly, Volume 45, No.2.pp105-120. (2013). (In Persian).
- Jomepour M.; Hataminejad H. and Shahanavaz S., An Investigation on Sustainable Development in Rasht County Using Ecological Footprint, Human Geography Research Quarterly, Volume 45, No.3.pp191-208. (2013). (In Persian).
- Zamba A. and Hadjibros K. Estimating the Ecological Footprint of Vehicles in the City of Athens, Proceeding of the International Conference on Environmental Science and Technology Kos Island, Greece 5-7 September 2007. 8p. (2007).
- Borucke M.; Moore D.; Cranston G.; Gracey K.; Iha K.; Larson J.; Lazarus E.; Morales J.; Wackernagel M. and Galli A., Accounting for Demand and Supply of the Biospheres Regenerative Capacity: the National Footprint Accounts Underlying Methodology and Framework, J. Ecological Indicator, No 24. pp: 518-533. (2013).
- Barrett J. and Simmons C., An Ecological Footprint of the UK: Providing a Tool to Measure the Sustainability of Local Authorities, Stockholm Environment Institute – York, 81p. (2003).
- Agrawal M.; Boland J. and Filar J., The Ecological Footprint of Adelaide City, Center for industrial and applied mathematics institute of sustainable systems and technologies, University of South Australia Mawson Lakes, 26p. (2006).
- Ewing B.D.; Moore S.; Goldfinger A.; Oursler A.; Reed A. and Wackernagel M. The Ecological Footprint Atlas 2010. Oakland: Global Footprint Network, 113p. (2010).
- Peters P. and Schouten F. Reducing the Ecological Footprint of Inbound Tourism and Transport to Amsterdam, J. Sustainable Tourism,14:2. PP. 156-171. (2010).
- Wiedmann T. and Barrett J. A Review of the Ecological Footprint Indicator - Perceptions and Methods, Sustainability, 2, pp.1645-1693. (2010).
- Giljum S.; Hammer M.; Stocker A. and Lackner M. Scientific Assessment and Evaluation of the Indicator Ecological Footprint, Sustainable Europe Research Institute (SERI), Wien, 78p. (2007).
- Schaefer A.; Luksch U.; Steinbach N.; Cabeca J. and Hanauer J., Ecological Footprint and Bio-capacity, The Worlds Ability to Regenerate Resources and Absorb Waste in a Limited Time Period. 2006Edition. European Communities.11p.(2006).
- Wiedmann T. and Lenzen M. On the Conversion Between Local and Global Hectares in Ecological Footprint Analysis. Ecological Economics, 60. pp: 673-677. (2007).
- Kitzes J.; Peller A.; Goldfinger S. and Wackernagel M. Current Methods for Calculating National Ecological Footprint Accounts, Science for Environment & Sustainable Society, Volume 4, No.1, pp1-9. (2007).
- GFN (Global Footprint Network). Living Planet Report 2006, Switzerland, 44P. (2006).
- Christensen M.; Emmi P.; Martinson W.; Mielke M.; Senbel M. and Stark D., The Ecological Footprint of Utah, 59p. (2007).
- Barrett J.; Vallack H.; Jones A. and Haq G., A Material Flow Analysis and Ecological Footprint of York, Stockholm Environment Institute – York, 129p. (2002).
- Zarrabi A.; Mohammadi J. and Abdollahi A.A., Review and Assessment of Land-Use in Fourteen Districts of the City of Isphahan Using a Comparative Method and LQi Model in GIS Environment, Journal of Geographical Sciences and Applied Research, Volume 10, No. 13, pp 173-202. (2009).
- Barrett J. and Scott A., The Application of the Ecological Footprint: a Case of Passenger Transport in Merseyside. J. Justice and Sustainability.19p.(2010).
- Chi G. and Stone B., Sustainable Transport Planning: Estimating the Ecological Footprint of Vehicle Travel in Future Years, J. Urban Planning and Development, 131:3(170). PP: 170-180, (2005).
- Wackernagel M. and Rees W., Urban Ecological Footprints: why cities cannot be sustainable-and why they are a key to sustainability, Environmental Impact Assessment Review, 16(4-6), 223-248. (1996).
- Aall C. and Norland T.I., The Ecological Footprint of the City of Oslo, Centre for Development and the Environment & University of Oslo. (2002).


