Evaluation of Periodical Changes in Plant Biodiversity Indices- A Case Study of Zanjanroud Watershed, Iran
Nooshin Mardani1 *
1
Department of Environment,
College of Agriculture Takestan Branch,
Islamic Azad University,
Takestan,
Iran
http://dx.doi.org/10.12944/CWE.9.3.42
Copy the following to cite this article:
Mardani N. Evaluation of Periodical Changes in Plant Biodiversity Indices- A Case Study of Zanjanroud Watershed, Iran. Curr World Environ 2014;9 (3) DOI:http://dx.doi.org/10.12944/CWE.9.3.42
Copy the following to cite this URL:
Mardani N. Evaluation of Periodical Changes in Plant Biodiversity Indices- A Case Study of Zanjanroud Watershed, Iran. Curr World Environ 2014;9(3). Available from: http://www.cwejournal.org/?p=7000
Download article (pdf) Citation Manager Publish History
Changes in biodiversity in general and plant biodiversity (plant species) in particular are being influenced by environmental factors; regardless of climate change which its consequences will be apparent over a long timescale. Such impressibility has long been a subject of interest to scholars, experts and researchers in the field of biodiversity. Declining biodiversity of plant species is affected by environmental factors especially soil and water parameters interacting with other factors. Nowadays, there are a lot of indices to evaluate and compare plant biodiversity in different habitats. In the simplest form, it is calculated by listing the plant species and their numbers (Barnes, 1998). Lloyd et al. (1968) introduced theoretical measures to calculate biodiversity in terms of theoretical and information aspects. In 2009, Rutherford carried out a research to quantify and understand the impact of severe land degradation on plant diversity in Succulent Karoo, South Africa. They concluded that protective nurse plants have been decimated more than the species in the region. Pielou (1966), Peet (1974) and Magurran (1988) presented comprehensive information on measuring plant biodiversity consisting of two distinct components; plant species richness and relative abundance of species in a natural environment. Accordingly, various indices have been presented by different researches including Hurlberts-PIE, Simpson and Shannon (Lepreter and Mouillot, 1999). In 2005, Grunewald mentioned that Shannon diversity index is not adequate for determining biodiversity. It is also necessary to pay enough attention to the results of species richness and density. Jiang et al. (2007) evaluated the plant diversity of mountainous ecosystems in the east side of Helan Mountain situated between steppe and desert regions of China. They investigated the influences of four environmental factors on features of plant biodiversity, the spatial pattern of vegetation types, and the variation of α- and β-diversities in vegetation and flora. Jiang and his colleagues showed that spatial patterns of plant biodiversity changes based on four selected environmental factors including elevation, location, slope and exposure. They found that both the Shannon–Weiner index and the species richness within each altitudinal belt reach their maximum at elevation range from about 1700 to 2000 m. The highest Shannon–Weiner index was observed at to the range, where both the deciduous broad-leaved forest and the temperate evergreen coniferous and deciduous broad-leaved mixed forest and the he variation of β-diversity was recorded along the altitude. In 2009, Zhang and Dong identified factors affecting species diversity of plant communities and the restoration process in Loess Plateau of China of China. They examined species richness, diversity and evenness in three main restoration stages, grassland stage, scrubland stage and forest stage and concluded that time since abandonment was the key factor for the restoration process. They also distinguish that elevation, soil type, slope and aspect were also important in the restoration process in the loess area. In 1988, Wilson introduced rangeland and woodland change as the main cause for dispersion and deterioration of plant species. Klimek et al. (2007) investigated the impact of management of grasslands on plant species diversity. They knew managerial practices conducted by the human as one of the main factors in the rapid and visible changes in plant species diversity in natural environments, including grasslands. They introduced land use change in combination of unplanned managerial measures in grasslands among the main causes changing the Europe Continent. According to Lorenzo et al. (2011) the richness and diversity of plant species composition (plant diversity) are influenced by interaction of different factors including soil, topography and management of land resources in Southern Alps. This can also be generalized to other areas. In this research it was revealed that physical and chemical properties of soil including nutrients in the soil have a significant impact on changing plant diversity, stability and richness. Gillet et al. (2008) with research on modeling land cover dynamics referred to the conclusion that the major change in plant species diversity in addition to being influenced by environmental factors especially soil and physiographic, is a function of the severity of exploitation of pastures by livestock in terms of type, number and exploitation duration. Temporal and spatial variations in plant species are directly related to the exploitation manner even if no changes are occurred in the characteristics of other factors affecting plant biodiversity. In 2003, Kalirad mapped the distribution of rangeland degradation suing plant community indicators in Zanjanroud Watershed. He showed that environmental factors including elevation, slope, aspect and management of land exploitation are among the most important factors in the diversity of plant communities and consequently, plant species diversity. In the meanwhile, the unclear point is the impressibility rate of the dependent variables within temporal periods being affected by effective variables and their contribution in providing a context for the extinction or threatening of plant species. Accordingly, the aim of this study was to evaluate to the significance of changes in plant biodiversity indices influenced by human and environmental factors in the study area within the examined period. In this context, the relevant variables include some of the most important environmental factors affecting the availability, viability and sustainability of the plant communities in the study area.
Material and methods
The study area
Zanjanrood is one of the sub-basins of SefidRood Watershed. It is situated between latitudes 36°17′41″–37°13′27″ N and longitudes 49°04′55″–47° 47′23″ E . Zanjanrood has an area of 4670.27 km2 of which 80.7% is belonged to the range lands. The watershed has a semi-arid to Mediterranean arid climate with average annual rainfall of 299 mm (Ghodousi, 2003).
The research methodology
First of all, the study area was specified using topographic maps at the scale of 1:25000 and the DEM (Digital Elevation Model) derived from Shuttle Radar Topography Mission (SRTM) images. Subsequently, factors affecting plant biodiversity were identified and classified based on available scientific resources. Among the main, effective factors can be pointed to climatic characteristics particularly monthly precipitation and temperature, environmental characteristics such as physiographic characteristics including slope, aspect and elevation classes (hypsometry) as well as general characteristics of soil and land resources. After determining the main criteria, the relevant maps were prepared at next step. Afterwards, Landsat-TM satellite images corresponding to four periods, including 1987, 1998, 2002 and 2009 were prepared. The images were pre-processed by applying geometric, radiometric and atmospheric corrections. The land cover density of the study area was prepared using NDVI (Normalized Difference Vegetation Index) and supervised method. The trend of changes in land cover density was examined within the mentioned periods. In the next step, the periodic land use maps were produced using visual interpretation of satellite images and scrutinized by field studies. Then, the plant species of the study area were listed using available information and statistics provided in conformity with the time scales when satellite images had been prepared. Using conventional methods and standards, periodic information and maps of land cover type related to the previous time periods were prepared. The map of the land cover type in 2009 was obtained through field studies. The maps of slope, elevation, lithological units and land cover were overlaid in the environment of GIS Software to get the map of homogeneous (training map units) units. Afterwards, in order to provide the required statistics and the supervised maps, some specific points were randomly selected on the bond map of the rangeland areas using systematic method, GPS and field studies. Finally, a total number of 104 training points were specified in rangelands. A quadrat was applied to list various features of the land cover including number, type, density and composition. In this respect, land cover density classification map was prepared using the satellite images in 4 intervals. The NDVI map was provided using unsupervised method. Subsequently, the final supervised map of land cover density was generated based on the field studies at training points. Accordingly, current and periodic plant biodiversity maps were prepared through Quadrat/Transect Method. The canopy density percentages during the research periods were obtained from the information extracted from the interpretation of the satellite images using NDVI. They indicate the average of canopy density at working units. Adjustment coefficient was obtained by calculating the ratio of the mean canopy cover percentage to total canopy cover percentage. The coefficient was calculated individually for each of the plant species identified in the study area and the reconstructed values were used in subsequent analysis. Finally, biodiversity indices were calculated using the following equations and their relevant final maps related to the research periods were prepared and compared.
Biodiversity Evaluation
Shannon index
One of the primary indices applied to evaluate plant diversity is H index presented by Weaner, Shannon in 1949. The index classified as one of the alpha diversity indices is calculated by the following equation:
Where;
ni is the number of individuals in species i; the abundance of species i.
N is the number of species, also called species richness.
N is the total number of all individuals
Pi is the relative abundance of each species, calculated as the proportion of individuals of a given species to the total number of individuals in the community:ni/N
Uniformity evaluation
Uniformity evaluation indicates the dispersion and distribution manner of population. Whatever the species distribution is more uniform and number of individuals/abundance of species is the same, the stability degree will be greater and consequently, biodiversity will be more, as well. In the present study Pielous uniformity index varying between zero and one was used to examine uniformity. In the following equation, numerator represents Shannon-Weiner Diversity Index while denominator indicates total number of species observed at the sampling site.
J = Σ Pi ln (Pi) / ln S
Species richness
Species richness indicating the presence of various species is obtained from counting the number of plant species in a region. So far, a lot of species richness indices have been developed; each one somehow represents species richness in a plot or habitat by a number. However, among all indices presented for species richness, the method of counting total number of species is more famous than all. In this study, Menhinick Index was used to examine the species richness in the study area.
Result and discussion
The obtained results obtained from change detection are presented in the followings:
Rainfed agriculture has increased 10% during these four periods. This indicates the decreased extent of the rangelands surrounding the non-irrigated arable lands and their conversion into the farmlands. The extent of the rangelands has followed a decreasing trend within the four periods due to increased area of other land uses particularly non-irrigated arable lands so that the rangeland area has been declined around 11.5% in the fourth period. Moreover, the extent of residential areas has been increased 1.5% as a result of population growth and consequently, increased extent of farmlands. The total area of the irrigated agriculture including orchards and farmland was almost constant.
Based on studies to prepare a list of plant species within the previous time periods (1987, 1998 and 2002 AD) as well as the field studies, a total number of 163 plant species were recorded of which 98, 61, 73 and 91 species were respectively belonged to the years 1987, 1998, 2002 and 2009 .
Using the extracted information and maps, uniformity status, richness and species diversity of each working unit were calculated based on the indices; Shannon-Wiener, Pielou and Menhinick.
In order to determine the status of biodiversity changes in the working units, the Shannon-Wiener data was analyzed using Excel software. Using information on the biodiversity index of the working units, interpolation method was used to prepare biodiversity zoning map (Figure 1). As the figure suggests, the species diversity has been decreased in the study area during the research periods.
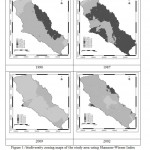 |
Figure 1: biodiversity zoning maps of the study area using Shannon-Wiener Index Click here to View Figure |
Uniformity evaluation
As it has been mentioned earlier, Pielous uniformity Index varying between zero and one was applied in the present study which the results are presented in Table 1.
Table 1: the quantitative values of uniformity in 104 working units using Pielous Index
|
Number of working unit |
1987 |
1998 |
2002 |
2009 |
|
1 |
0.976 |
0.965 |
0.813 |
0.967 |
|
2 |
0.963 |
0.915 |
0.832 |
0.947 |
|
3 |
0.989 |
0.986 |
0.909 |
0.958 |
|
4 |
0.972 |
0.973 |
0.840 |
0.992 |
|
5 |
0.994 |
0.957 |
0.944 |
0.967 |
|
6 |
0.975 |
0.965 |
0.876 |
0.892 |
|
7 |
0.989 |
0.987 |
0.981 |
0.816 |
|
8 |
0.944 |
0.912 |
0.799 |
0.757 |
|
9 |
0.938 |
0.867 |
0.850 |
0.751 |
|
10 |
0.892 |
0.776 |
0.837 |
0.686 |
|
100 |
0.912 |
0.933 |
0.860 |
0.974 |
|
101 |
0.865 |
0.851 |
0.810 |
0.675 |
|
102 |
0.931 |
0.923 |
0.715 |
0.756 |
|
103 |
0.890 |
0.917 |
0.778 |
0.747 |
|
104 |
0.882 |
0.924 |
0.822 |
0.740 |
Species richness
In this research, Menhinick Index was used.
Conclusion
Duncan Test was applied to compare statistically the changes in species diversity within the research periods. The statistical comparison of the results revealed that there is a 5-percent significant difference among the tested data. Accordingly, the species diversity values were categorized in three classes in which the first class referred to the period 1987 with the highest, significant average, the second class belonged to the periods 1998 and 2002 with median average and no significant difference and the third class included the period 2009 with the lowest, significant average. Duncan Test was applied to compare statistically the changes in uniformity during the research periods. The statistical comparison of the results revealed that there is a significant difference equal to 5% between the tested data. Accordingly, the uniformity values were categorized in three classes in which the first class referred to the period of 2009 with the highest, significant average, the second class belonged to the periods; 1998 and 2002 with median average and no significant difference and the third class included the period of 1987 with the lowest, significant average. Protection plays a key role in uniformity, richness and biodiversity preservation. The obtained results indicated that the main land cover biodiversity indices have declined due to deteriorating trend of qualitative and quantitative characteristics of the rangelands including extent, density, type, composition and abundance of land cover. Unfortunately, due to severe impressibility of plant growth characteristics from main climatic changes, especially rainfall variations during different months and years, destructive effects of direct and indirect human measures have been intensified in the study area. This was evident from the occurrence and severity of various forms of erosion, especially gully erosion in the study area revealed by field studies.
References
- Barnes & Noble(1998 ). BarnesReport of the Eleventh Global Biodiversity Forum.
- Gillet, F., 2008. Modelling vegetation dynamics in heterogeneous pasture – woodland landscape , Ecological Modelling, 217:1â€18.
- Pielou, E.C. (1966). The measurement of diversity in different types of biological collections. J. Theor. Biol., 13, 131-144.
- Simpson, E.H. (1949). Measurement of diversity. Nature, Lond. 163, 688.
- Lloyd, H., Zar, J.H., and Karr, J.R. (1968). On the calculation of information - theoretical measures of diversity. Am. Mid Nat. 79, 257-272.
- Grunewald, R., H. Schubert.( 2005). The definition of a new plant diversity index H0dune for assessing human damage on coastal dunes—Derived from the Shannon index of entropy H0. Ecological Indicators 7 (2007) 1–21
- Jiang, K. Muyi, Y. Zhu, G. Xu.(2007). Plant biodiversity patterns on Helan Mountain, China, www.sciencedirect.com, acta oecolog ica 3 2 ( 2 0 0 7 ) 1 2 5 – 1 3 3
- Zhang, J., Dong, Y.,( 2009). Factors affecting species diversity of plant communities and the restoration process in the loess a rea of China, journal homepage: ww.elsevier.com/locate/ecoleng . Ecological Engineering (2009).
- Klimek, S., A. Richter gen. Kemmermann, M. Hofmann, and J. Isselstein. 2007. Plant species richness and composition in managed grasslands: the relative importance of field management and environmental factors. Biological Conservation 134 :559–570.
- Rutherford. M.C., L.W. Powrie.2009. Severely degraded rangeland: Implications for plant diversity from a case study in Succulent Karoo, South Africa. Journal of Arid Environments (2009) 1–10
- Peet, R. K. 1974. The measurement of species diversity. Annual Review of Ecology and Systematics 5:285–307.
- Wilson, E. O. (ed.). 1988. Biodiversity. National Academy Press, Washington, DC.
- Magurran, A. E. 1988. Ecological diversity and its measurement. Princeton University Press, Princeton, N. J.
- Kalirad, A. (2003) Distribution map of rangeland degradation indicator plant community. Enschede, ITC, 2003.
- Marini Lorenzo., Klimek S., Battisti A. (2011) Mitigating the impacts of the decline of traditional farming on mountain landscapes and biodiversity: A case study in the European Alps.


