GIS-Based Evaluation of Water Quality Index of Ground Water Resources in West Bokaro Coalfield, India
Ashwani Kumar Tiwari1 * , Prasoon Kumar Singh1 and Mukesh Kumar Mahato1
1
Department of Environmental Science and Engineering,
Indian School of Mines,
Dhanbad,
826004
Jharkhand
India
http://dx.doi.org/10.12944/CWE.9.3.35
Copy the following to cite this article:
Tiwari A. K, Singh P. K, Mahato M. K. GIS-Based Evaluation of Water Quality Index of Ground Water Resources in West Bokaro Coalfield, India. Curr World Environ 2014;9 (3) DOI:http://dx.doi.org/10.12944/CWE.9.3.35
Copy the following to cite this URL:
Tiwari A. K, Singh P. K, Mahato M. K. GIS-Based Evaluation of Water Quality Index of Ground Water Resources in West Bokaro Coalfield, India. Curr World Environ 2014;9(3). Available from: http://www.cwejournal.org/?p=6942
Download article (pdf) Citation Manager Publish History
Groundwater is the major source for drinking and domestic purposes in both rural and urban areas. Besides, it is an important source for both agriculture and industrial sectors.In the last few decades, there has been a tremendous increase in the demand for fresh water due to the rapid growth of population and the accelerated pace of industrialization. Rapid urbanization, especially in developing countries like India, has affected the availability and quality of groundwater due to its over exploitation and improper waste disposal, especially in urban areas (Rama krishnalah et al. 2009). Once the groundwater is contaminated, its quality cannot be restored by stopping the pollutants from the source therefore it becomes very important to regularly monitor the quality of groundwater and to device ways and means to protect it (Mufid al-hadithi 2012). Water pollution not only affects water quality, but also threats human health, economic development, and social prosperity (Milovanovic2007). Access to drinking water in India has increased over the past few decades with the tremendous adverse impact of unsafe water for health (Singh et al. 2013). According to World Health Organization (WHO), about 80% of all the diseases in human beings are caused by water. It is estimated that about 21 % of the communicable diseases in India are water borne (Bradon and Homman1995). Scarcity of clean and potable drinking water has emerged in recent years as one of the most serious developmental issues in many parts of West Bengal, Jharkahnd, Orissa, Western Uttar Pradesh, Andhra Pradesh, Rajasthan and Punjab (Tiwari & Singh 2014).
Water Quality Index is an important way to assess the quality of groundwater in the recent years.WQI is an a superior way to the understanding of water quality issues by integrating complex data and generating a score, which ultimately describes the water quality status(Tiwari et al. 1985; Singh,D. F. 1992; Rao, S.N; 1997; Mishra et al.2001).GIS is a computer system for capturing, storing, querying, analyzing and displaying all types of geographical data. GIS allows viewing, understanding, questioning, interpreting, and visualizing data in many ways that reveal relationships, patterns, and trends in the form of maps, globes, reports, and charts.GIS is an effective tool not only for collection, storage, management and retrieval of a multitude of spatial and non-spatial data, but also for spatial analysis and integration of these data to derive useful outputs and modeling (Gupta and Srivastava et al. 2010). It can be a powerful tool for developing solutions for water resources problems for assessing water quality, determining water availability, preventing flooding, understanding the natural environment and managing water resources on a local or regional scale (Tjandra et al. 2003). GIS is widely used for collecting diverse spatial data and for overlay analysis in spatial register domain to represent spatially variable phenomena (Bonham-Carter1996;Babikeretal.2004; Gupta and Srivastava2010). GIS-based, simple, and robust WQI is an essential tool for rapid transfer of information to water resources managers and the public. GIS can be useful for taking quick decisions as graphical representation would be easy to take a policy decision by the makers (Singh et al. 2013).
Nowadays, groundwater pollution has become a major problem in the world and need a regular monitoring of water bodies with required number of parameters for the welfare of the society. WQI is one of the most effective expressions which reflect a composite influence of contributing factors on the quality of water of any water system (Tiwari et al. 1986).The major objective of the present study to assess the suitability of groundwater quality for drinking purpose and generated water quality mapsusing GIS based on the available parameters from33 locations in West Bokaro coalfield. This study will be usefull in current water resource planning and provide some basic data for the rational exploitation and use of water resources in the future.
Study Area
The West Bokaro Coalfield lies between 23° 41’ to 23° 52’ N latitude and 85° 24’ to 85° 41’ E longitude (Fig.1) comprising an area of 207 Sq. Km. It is geographically separated from the East Bokaro Coalfield by conspicuous Lugu Hill (987 m). The entire coalfield falls in the Ramgarh District of Jhrakhand.It is a major storehouse of medium coking coal. The coalfield is drained by Bokaro River passing through the central part of coalfield with easterly flows. Chutua River is the main tributaries of the Bokaro River which drains the northern hilly terrain of the coalfield. Chotha River is also the tributaries of Bokaro River which drains the Southern region of the coalfield.
The West Bokaro coalfield is fourth from east among the Damodar Valley coalfield. The West Bokaro coalfield forms a broad syncline with its trending E-W and exhibits a complete sequence of lower Gondwana formation which rest unconformably a basement rocks (Fig. 1). The Barakar Formation covers the major part of the coalfield and comprises of coarse to fine grained sand stone, pebbly conglomerates, gritty sand stones , grey shales, carbonaceous shales, fire clays and coal seams. The total of 29 correlates coal seams in Barker formation with 13 major seams (seam XIII to me and Karharbari formation contain only one seam (seam 0). The coals from West Bokaro- coalfield range from non-coking to almost prime coking type. The upper coal seams in the south western part are generally non – coking whereas the coal seams occurring in the northern part of the coalfield are more mature and medium coking to almost prime coking. In general improvement in the rank of coal from east to west and also with dep this observed.
The West Bokaro Coalfield area experiences tropical climate and is characterized by very hot pre-monsoon and cold post- monsoon season. The month of May and mid June is the peak of the pre - monsoon season with an average maximum temperature of 44oC, while December and January are the coldest months. The average annual rainfall of the district is 1418 mm and more than 85% of annual rainfall occurs during the four monsoon months (June to September).
Material and Methods
For the assessment of groundwater quality of the West Bokaro coalfields, systematic samplings were carried out during post-monsoon, 2012. Thirty three groundwater samples were collected from dug wells of the West Bokaro Coalfield area (Fig. 1). The groundwater samples were collected in one liter narrow mouth pre-washed polyethylene bottles. Electrical conductivity (EC) and pH values were measured in the field using a portable conductivity and pH meter (Consort C831).In the laboratory, the water samples were filtered through 0.45 μm Millipore membrane filters to separate suspended particles. Acid titration and molybdosilicate methods were used to determine the concentration of bicarbonate (HCO3-) in water (APHA 1998). Major anions (F-, Cl-, SO42-, and NO3-) were analysed onion chromatograph (Dionex Dx-120) using anions AS12A/AG12 columns coupled to an anion self-regenerating suppressor (ASRS) in recycle mode. Major cations (Ca 2+, Mg2+, and Na+) were measured by Atomic Absorption Spectrophotometer (Varian 680FS) in flame mode after calibrating the instrument with known standards. Three replicates were run for each sample for cation analysis and the instrument recalibrated after every 15 samples. An overall precision, expressed as percent relative standard deviation (RSD), was obtained below 10% for the entire samples.
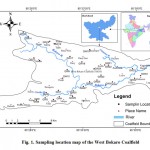 |
Figure 1: Sampling location map |
Water Quality Index
WQI is defined as a rating reflecting the composite influence of different water quality parameters, which is calculated from the point of view of the suitability of groundwater for human consumption. The concept of WQI was firstly used by Horton (1965), and then developed by Brown et.al. (1970) and further improved by Deininger (Scottish Development Department, 1975). WQI a well known method as well as one of the most effective tools to express water quality that offers a simple, stable, reproducible unit of measure and communicate information about water quality to the policy makers and concerned citizens (Singh et al. 2013). It thus, becomes an important parameter for the assessment and management of ground water (Venkata and Reddy, 1995).WQI summarizes large amounts of water quality data into simple terms (e.g., excellent, good, bad, etc.) for reporting to management and the public in a consistent manner. The WQI can also be used for estimating water quality on-line, but the accuracy of the model depends upon the judicious selection of parameters.
Various researchers have considered the spatial groundwater quality index and the procedure of weighing is widely used to identify the quality of the water (Ckakraborthy et al., 2007; Bhaskar and Nagendrappa 2008; Rama krishnalah et al. 2009, Sathish, 2011, Mufid al-hadithi 2012; Reddy and Patode 2013).
GIS analysis
Generated spatial distribution maps for the nitrate, sulphate, total hardness and total dissolved solid have been created for West Bokaro Coalfield. Developed groundwater quality classification map from different thematic layers (Fig. 2a–c) based on Indian (ISI 2003) Standards for Drinking Water by using the ARC GIS 9.3 software. The classification of water quality is essential to an assessment of the suitability of water for domestic purposes.
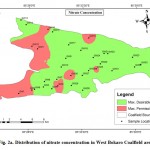 |
Figure 2(a): Distribution of nitrate concentration in West Bokaro Coalfield area Click here to View Figure |
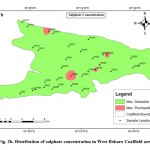 |
Figure 2(b): Distribution of sulphate concentration in West Bokaro Coalfield area Click here to View Figure |
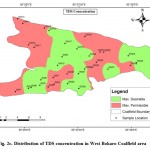 |
Figure 2(c): Distribution of TDS concentration in West Bokaro Coalfield area Click here to View Figure |
Results and Discussion
The pH of groundwater samples in the study area was found to be slightly acidic to slightly alkaline in nature. The F- andCl- concentration measured in study area were below in the desirable limit while the NO-3 (Fig. 2a) and SO2-4 (Fig. 2b) ion concentration is within both desirable and max. Permissible limits. The classification maps of TDS (Fig. 2c), Ca and Mg vary between the desirable and permissible limit. The concentration of total hardness varies from soft to very hard categories.
Estimation of WQI
Water quality index (WQI) is defined as a technique of rating that provides the composite influence of individual water quality parameter on the overall quality of water (Singh et al. 2013). WQI is a mathematical equation used to transform a large number of water quality data into a single number (Stambuk-Giljanovic 1999). It is simple and easy to understandable for decision makers about quality and possible uses of any water body (Bordalo et al. 2001). For assessing the suitability of drinking water, the water quality data of the analyzed samples were compared with the prescribed drinking water standard of BIS 2003 (IS:10500) have been considered for the calculation of WQI. The Indian Standards as per ISI for the drinking water together with its corresponding status categories of WQI (Rao1997).In computing WQI three steps are followed. In the first step, each of the 10 parameters (pH, TDS, F-,Cl-,NO3-, SO42- HCO3-, Ca2+, Mg2+ ,TH) has been assigned a weight ( ) according to its relative importance in the overall quality of water for drinking purposes (Table1)
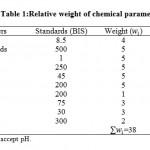 |
Table 1: Relative weight of chemical parameters |
The maximum weight of 5 has been assigned to the parameters like TDS, F-,Cl-,NO3-, and SO42- due to their major importance in water quality assessment (Srinivasamoorthy et al. 2008). HCO3- is given the minimum weight of 1 as it plays an insignificant role in the water quality assessment. Other parameters like Ca2+, Mg2+ Na+, and TH were assigned a weight ( ) between 1 and 5 depending on their importance in water quality determination. In the second step, the relative weight ( ) is computed from the following equation
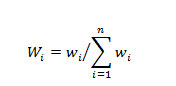
Where, the is the relative weight, is the weight of each parameter and is the number of parameters. Calculated relative weight ( ) values of each parameter are given in (Table1). In the third step, a quality rating scale ( ) for each parameter is assigned by dividing its concentration in each water sample by its respective standard according to the guidelines laid down in the BIS 10500 (2003) and the result is multiplied by 100
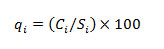
Where, the is the quality rating, is the concentration of each chemical parameter in each water sample in mg/l and is the BIS standard for each chemical parameter in mg/l according to the guidelines of the BIS 10500 (2003).
For computing the WQI, the SI is first determined for each chemical parameter, which is then used to determine the WQI as per the following equation
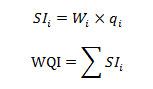
Where, the is the sub-index of th parameter, is the rating based on concentration of j th parameter and is the number of parameters.
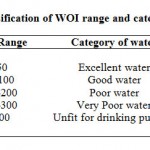 |
Table 2: Classification of WOI range and category of water Click here to View table |
Water quality category, were determined on the basis of WQI. The computed WQI values range from 21 to 131 and average 73 respectively. WQI range and category of water can be classified (Table2). The highest WQI were calculated from the samples collected from the Murpa, Mandu, Tapin, Basntpur, Lahatungi and Ara are sampling locations(Table3). The reason for high WOI in the study area may be due to the natural and anthropogenic sources (mining activity, agriculture wastes, domestic sewage disposals etc.) Among all the of the groundwater samples, the percentage (%) of WQI categories Excellent (21%), Good (58%) and Poor (21 %) were observed. More than half the location falls in Excellent to Good category (fig. 3).
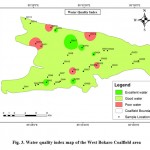 |
Figure 3: Water quality index map of the West Bokaro Coalfield area Click here to View Figure |
Table 3: Water Quality Index for Groundwater of West Bokaro Coalfield
|
S.No. |
Sample Code |
Sample Descripation |
WQI |
Description |
| 1 |
GW1 |
Datma |
94 |
Good |
| 2 |
GW2 |
Topa |
66 |
Good |
| 3 |
GW3 |
Orla |
38 |
Excellent |
| 4 |
GW4 |
Murpa |
101 |
Poor |
| 5 |
GW5 |
Kuju |
69 |
Good |
| 6 |
GW6 |
Nayamore |
50 |
Good |
| 7 |
GW7 |
Hesagara |
92 |
Good |
| 8 |
GW8 |
Hesagara |
53 |
Good |
| 9 |
GW9 |
Pundi |
56 |
Good |
| 10 |
GW10 |
Pundi |
61 |
Good |
| 11 |
GW11 |
Mandu |
101 |
Poor |
| 12 |
GW12 |
Mandu |
114 |
Poor |
| 13 |
GW13 |
Charhi |
75 |
Good |
| 14 |
GW14 |
Charhi |
78 |
Good |
| 15 |
GW15 |
Tapin North |
38 |
Excellent |
| 16 |
GW16 |
Tapin |
131 |
Poor |
| 17 |
GW17 |
Parej East |
21 |
Excellent |
| 18 |
GW18 |
Parej |
44 |
Excellent |
| 19 |
GW19 |
Basantpur |
131 |
Poor |
| 20 |
GW20 |
Kedla |
83 |
Good |
| 21 |
GW21 |
Kedla |
93 |
Good |
| 22 |
GW22 |
Jharkahnd |
91 |
Good |
| 23 |
GW23 |
Laiyo |
54 |
Good |
| 24 |
GW24 |
Bhalghara |
43 |
Excellent |
| 25 |
GW25 |
Lahatungri |
122 |
Poor |
| 26 |
GW26 |
Mukund Beda |
63 |
Good |
| 27 |
GW27 |
Butbera |
49 |
Excellent |
| 28 |
GW28 |
Saruber |
54 |
Good |
| 29 |
GW29 |
Ara |
38 |
Excellent |
| 30 |
GW30 |
Ara |
129 |
Poor |
| 31 |
GW31 |
Chainpur |
53 |
Good |
| 32 |
GW32 |
Badgon |
87 |
Good |
| 33 |
GW33 |
Jageshvar Bihar |
51 |
Good |
Conclusions
The above study indicates that the groundwater of variable quality exists in the West Bokaro Coalfield area. However, despite the coal mining and industry, an analysis of the chemistry of 33 dug wells sample indicates it is generally suitable for drinking purposes, except some locations. The WQI shows that 79% of groundwater samples were found as Excellent in Good category and can be used for direct consumption while 21% of water samples are the Poor category,samples show that the water is not suitable for direct consumption and requires treatment before its utilization.Suitable water treatment process such as water softening, ion exchange and reverse osmosis should be used to reduce the concentrations of contaminants in the study area.
Acknowledgement
The authors are grateful to the Director, Central Institute of Mining and Fuel Research, Dhanbad to providing research facilities and also grateful to the Director, ISM for his kind support. One of the authors (Ashwani Kumar Tiwari) is grateful to Indian School of Mines/ MHRD/Government of India, for granting a great support. We are also thankful to Dr. Abhay Kumar Singh, Senior Scientist and Amit Ghosh, Project Assistant at Central Institute of Mining and Fuel Research for their support and encouragement.
References
- APHA, Standard methods for the examination of water and waste water, 20th edn. American Public Health Association, Washington, DC. (1998).
- Babiker I.S., Mohamed MAA., et al., Assessment of groundwater contamination by nitrate leaching from intensive vegetablecultivation using geographical information system,Environ Int,29(8):1009–1017, (2004).
- Bhaskar C. V.And Nagendrappa G., A comparative study of ground water quality and water quality index of certain selected areas situated around Tumkur city, Karnataka, Current World Environment, 3(1): 75-82,(2008).
- BIS., Indian standard drinking water specifications IS10500:1991, edition 2.2 (2003–2009), Bureau of Indian Standards, New Delhi,(2003).
- Bonham-Carter G.F., Geographic information systems for geoscientists: modeling with GIS,Comput. Methods Geosci., 13: 1–50, (1996).
- Bordalo A. A., Nilsumranchit W. and ChalermwatK., Water quality and uses of the Bangpakong river (Eastern Thailand), Water Research, 35(15): 3635-3642,(2001).
- Bradon C. and Homman K., The cost of inaction: valuing the economy-wide cost of environmental degradation in India, Asia Environment Division, World Bank 7, October memo, (1995).
- Brown R. M., McClelland N. I., Deininger R. A.and Tozer R. G., A water quality index: Do we dare?",Water & Sewage Works, 117: 339–343,(1970).
- Ckakraborthy S., Paul P. K. and Sikdar, P. K., Assessing aquifer vulnerability to arsenic pollutionusing DRASTIC and GIS of North Bengal Plain: A case study of English Bazar Block, Malda District, West Bengal, India, Journal of Spatial Hydrology7(1):101-121, (2007).
- Gupta M. and Srivastava, P.K., Integrating GIS and remote sensing for identification of groundwater potential zones in the hilly terrain of Pavagarh, Gujarat, India,Water Int., 35: 233–245,(2010).
- Horton R. K., An index number system for rating water quality,Journal-Water Pollution Control Federation, 37: 300-305,(1965).
- Milovanovic M., Water quality assessment and determination of pollution sources along the Axios/ Vardar River, Southeastern Europe, Desalination,213: 159–173, (2007).
- Mishra P. C. and Patel R.K., Study of the pollution load in the drinking water of Rairangpur, a small tribal dominated town of North Orissa, Indian J. Environment and Ecoplanning, 5(2): 293-298,(2001).
- Mufid al-hadithi., Application of water quality index to assess suitability of groundwater quality for drinking purposes in Ratmao –Pathri Rao watershed, Haridwar District, India,Am. J. Sci. Ind. Res.,3(6): 395-402,(2012).
- Ramakrishnalah C. R., Sadas hivalah C.and Ranganna G.,Assessment of water quality index for the groundwater in Tumkur Taluk , Karnataka state , India,E Journal of chemistry, 6(2): 523-530,(2009).
- Rao N.S. Studies on Water Quality Index in Hard rock Terrain of Guntur District, Andhra Pradesh, India, National Seminar on Hydrogeology of Precambrian Terrains and Hard Rocks Areas, Dharwad, 129-134, (1997).
- Reddy K. R. And Patode, R. S., Assessment of groundwater quality–A case study of Kondapur mandal, Medak district, Andhra Pradesh, Current World Environment, 8(2), (2013).
- Sathish S. and Elango L., Groundwater Quality and Vulnerability Mapping of an Unconfined Coastal Aquifer,In. Journal of Spatial Hydrology, 11(1),(2011).
- Scottish Development Department., Towards cleaner water. Edinburgh: HMSO, Report of a River Pollution Survey of Scotland,(1975).
- Singh P. K., Tiwari A. K. and Mahato M. K., Qualitative Assessment of Surface Water of West Bokaro Coalfield, Jharkhand by Using Water Quality Index MethodInternational Journal of ChemTech Research,5(5),(2013).
- Singh P. K., Tiwari A. K., Panigarhy B. P. and Mahato M. K., Water quality indices used for water resources vulnerability assessment using GIS technique: a review,International Journal Earth Science and Engineering,6(6-1):1594-1600,(2013).
- Singh A. K., Raj Beenu., Tiwari A. K. and Mahato M. K., Evaluation of hydrogeochemical processes and groundwater quality in the Jhansi district of Bundelkhand region, India,Environmental Earth Science, 70(3): 1225-1247, (2013).
- Singh D.F., Studies on the water quality index of some major rivers of Pune, Maharashtra Proceedings of the Academy of Environmental Biol., 1(1), 61-66, (1992).
- Srinivasamoorthy K., Chidambaram M., Prasanna M. V., Vasanthavigar M., John Peter A.and Anandhan P., Identification of major sources controlling Groundwater Chemistry from a hard rock terrain—A case study from Mettur taluk, Salem district,mTamilnadu, India Journal of Earth System Sciences, 117(1): 49–58(2008).
- Stambuk-Giljanovic N., Water quality evaluation by index in Dalmatia,Water Research, 33(16): 3423-3440,(1999).
- Tiwari A. K. and Singh A. K., Hydrogeochemical investigation and groundwater quality assessment of Pratapgarh district, Uttar Pradesh, Journal of the Geological Society of India 83(3): 329-343,(2014).
- Tiwari T.N., and Mishra M.A., A preliminary assignment of water quality index of major Indian rivers,Indian J. Environmental Protection, 5: 276-279,(1985).
- Tiwari T.N., Das, S. C. and Bose P.K., Water Quality Index for the river Jhelum in Kashmir and its seasonal variations,Poll Res., 5: 1-5.(1986).
- Tjandra F. L., Kondhoh A. andMohammed A.M.A., A conceptual database design for hydrology using GIS, In: Proceedings of Asia pacific association of hydrology and water resources, 13–15 March, Kyoto, Japan,(2003).
- Venkata., Mohan, S, Jayrama. and Reddy S., Assessment of overall water quality of Tirupati,Poll. Res.,14(3): 275-282, (1995).
- WHO.,Water, sanitation and hygiene links to health—facts and figures, World Health Organization, Geneva, (2004).


