Hydro chemical characteristic and Quality Assessment of Groundwater of Ranchi Township Area, Jharkhand, India
Prabhunath Singh1 , Ashwani Kumar Tiwari1 * and Prasoon Kumar Singh1
1
Department of Environmental Science and Engineering,
Indian School of Mines,
Dhanbad,
826004
Jharkhand
India
http://dx.doi.org/10.12944/CWE.9.3.30
Copy the following to cite this article:
Singh P, Tiwari A. K, Singh P. K. Hydro chemical characteristic and Quality Assessment of Groundwater of Ranchi Township Area, Jharkhand, India. Curr World Environ 2014;9 (3) DOI:http://dx.doi.org/10.12944/CWE.9.3.30
Copy the following to cite this URL:
Singh P, Tiwari A. K, Singh P. K. Hydro chemical characteristic and Quality Assessment of Groundwater of Ranchi Township Area, Jharkhand, India. Curr World Environ 2014;9(3). Available from: http://www.cwejournal.org/?p=7009
Download article (pdf) Citation Manager Publish History
Groundwater may be considered as one of the most precious and one of the basic needs for human existence and the survival of mankind providing him the luxuries and comforts in addition to fulfilling his basic necessities of life. Groundwater forms the major source of water supply for drinking purposes in most parts of India. It accounts for about 88% safe drinking water in rural areas, where the population is widely dispersed and the infrastructure needed for treatment and transportation of surface water does not exist. Groundwater also plays an important role in agriculture, for both watering of crops and for irrigation of dry season crops. It is estimated that about 45% of irrigation water requirement is met from groundwater sources.
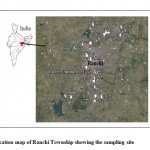 |
Figure 1: Location map of Ranchi Township showing the sampling site Click here to View Figure |
The quality of groundwater depends on various chemical constituents and their concentration, which are mostly derived from the geological data of the particular region. Ground water quality is being increasingly threatened by rapid increase in population and growth of industrialization, use agricultural chemicals and disposal of urban and industrial wastes. It has been estimated that once pollution enters the subsurface environment, it may remain concealed for many years, becoming dispersed over wide areas of groundwater aquifer and rendering ground water supplies unsuitable for consumption and other uses.The deterioration of ground water quality is of immediate concern in the districts, cities and towns of the country (Khurshid et al.1997; Das et al. 1998; Sohani et al. 2001; Jain2002; Meenakumari and Hosmani2003; Dhindsa et al. 2004;Ramasubramanian et al.2004: Singh et al. 2007; Venugopal et al. 2008: Salve et al. 2008; Ramakrishnaiah et al. 2009:Jain et al. 2010; Chatterjee et al. 2010; Singh et al. 2011; Raju et al. 2011; Singh et al. 2012; Singh et al. 2013; Tiwari and Singh 2014).
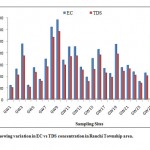 |
Figure 2:Graphs showing variation in EC vs TDS concentration in Ranchi Township area. Click here to View Figure |
Today, water quality issues have become a significant concern due to the growth of population, urban expansion and technological development. Water can be easily contaminated in different ways through unregulated or regulated but not well designed and monitored disposal practices (Ozlem Tunc Dede et al. 2013). Public ignorance of environment and related considerations, lack of provisional basic social services, indiscriminate disposal of increasing anthropogenic wastes, unplanned application of agrochemicals, and discharges of improperly treated sewage/industrial effluents; result in excess accumulation of pollutants on the land surface and contamination of water resources (Tiwari et al. 2013). World Health Organization (WHO) reported that in developing countries over three million people (90 % are children under 5) die every year because of waterborne diseases (WHO 2004; Akoteyon et al.2011). Access to safe drinking water remains an urgent necessity, as 30 % of urban and 90 % of the rural Indian population still depends completely on untreated surface or groundwater resources (Kumar et al. 2005).Access to drinking water in India has increased over the past few decades with the tremendous adverse impact of unsafe water for health (Singh et al. 2013). Scarcity of clean and potable drinking water has emerged in recent years as one of the most serious developmental issues in many parts of West Bengal, Jharkahnd, Orissa, Western Uttar Pradesh, Andhra Pradesh, Rajasthan and Punjab (Tiwari & Singh 2014). Thus, proper assessment and reporting of groundwater quality is an important issue. In the present work attempts have been made to detect groundwater quality for drinking, domestic and irrigation uses.
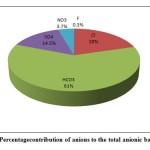 |
Figure 3(a): Percentage contribution of anions to the total anionic balance (TZ-) Click here to View Figure |
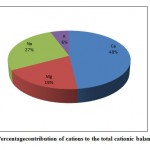 |
Figure 3(b): Percentage contribution of |
Study Area
Ranchi is the capital city of the Indian state of Jharkhand. The total area covered by Ranchi - Municipal Area is about 110 sq km and the average elevation of the city is 2,140 feet above sea level. Geographically, Ranchi is located on southern part of the Chota Nagpur plateau which forms the eastern edge of the Deccan plateau system. Ranchi was the centre of the Jharkhand movement, which called for a separate state for the tribal regions of South Bihar, northern Orissa, western West Bengal & the eastern area of what is present-day Chhattisgarh. It is connected through NH-33 from prominent district headquarters of the state. It is also connected through Gumla and Rourkela by NH-23. As per latest 2011 India census, Ranchi city has a population of 1,073,440, making it the 37th largest urban city in India and third largest city in Jharkhand after Jamshedpurand Dhanbad. Males constitute 51.3% of the population and females 48.7%. Ranchi is the second most populous district of Jharkhand after Dhanbad. The area surrounding Ranchi has been endowed with natural attractions and it is referred to as the “City of Waterfalls”. The Subarnarekha river and its tributaries constitute the local river system. The channels Kanke, Rukka and Hatia have been dammed to create reservoirs that supply water to the majority of the population.
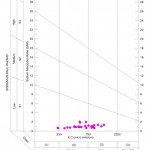 |
Figure 4: US salinity diagram for classification of irrigation water Click here to View Figure |
Ranchi district experiences subtropical climate, which is characterized by hottest part of the year, extends from mid April to the middle of June, but even during this period the nights remain cool and pleasant. Occasional rains help to keep down the temperature in summer. The monsoon commences from middle of June and continues upto the end of September. The winter is rather severe extending from middle of November to middle of February. Minimum temperature of about 10°C is recorded for the period during late December and early January. The normal annual rainfall data indicate that average rainfall is 1394mm. Maximum rainfall has been observed from June to October months. About 90% of the total annual rainfall is received to the monsoon period.
The oldest geological formation of this district is represented by Dharwar sediments with the basic intrusive. These, being later intruded by the batholithic mass of Chota Nagpur granite, were metamorphosed into various types of schistose and gneissic rocks. The remnants of the earlier sedimentary and igneous rocks are known from the inclusions of phyllites and schists of varying dimensions in the granite mass and the extensive areas of Khondalites. Phyllites are by far the predominant rock type in the south-east portion of this district. Chota Nagpur granite gneiss forms the country rocks of the district and is a part of the enormous intrusive mass. Within the main body, the granite gneiss varies from a normal medium- grained rock to a porphyritic material with large crystals of potash feldspar. Quartz, biotite or hornblendes are the other essential minerals. Apatite, zircon, sphene are rutile are the accessories. The amphibolites occur as minor intrusive in the Khondalite series. Amphibolite also occurs as minor enclaves in the granite gneisses in and around Ranchi city.
Materials and Methods
For the assessment of groundwater quality of the Ranchi township area, systematic samplings were carried out during May, 2014. Twenty seven ground water water samples were collected from wells and tube wellsin the Ranchi township area (Fig 1). The groundwater samples were collected in one liter narrow mouth pre-washed polyethylene bottles. Electrical conductivity (EC) and pH values were measured in the field using a portable conductivity and pH meter. In the laboratory, the water samples were filtered through 0.45 μm Millipore membrane filters to separate suspended particles. Acid titrations were used to determine the concentration of bicarbonate and chloride in ground water (APHA 1998). Concentrations of major anions (F-, NO3- and SO42-) were determined by UV spectrophotometer. Concentration of major cations (Ca2+, Mg2+, Na+ and K+) were determined by flame Photometry and flame atomic absorption spectrophotometer (AAS).
Results and Discussion
pH, EC and TDS
pH of the analyzed water samples varied from 7.0 to 8.0 and the average pH was found to be 7.4 indicating slightly alkaline nature of the groundwater samples. Electrical conductivity (EC) tells about the conducting capacity of water which in turn is determined by the presence of dissolved ions. Higher the ionisable solids, greater will be the EC.EC is a measure of total dissolved solids (TDS) i.e. - it depend upon the ionic strength of the solution. Increase in the concentration of dissolved solids, increases the ionic strength of the solution. The measured EC of the groundwater in the study area varies from 238 to 1357 µS cm-1 with an average value of 666 µS cm-1. Concentration of total dissolved solids (TDS) in the groundwater of the study area ranged from 200 to 1157mg l-1 with an average value of 560mg l-1(Fig.2).Water can be classified in to fresh (TDS <1,000 mg L-1), brackish (>1,000 mg L-1), saline (>10,000 mg L-1) and brine (1,00,000 mg L-1) categories on the basis of TDS concentration (Freeze and Cherry 1979). Based on this classification, 94% of the groundwater of the study area belongs to fresh water and 6% belongs to brackish water.
Major ion chemistry
Among the major anions, bicarbonate was generally dominant and representing on average 60.6 % of the total anions. Chloride is the second dominant anion, representing on an average 20% of the total anions. Sulphate and nitrate were less dominant ions and contributing 14.5% and 4.5% to the total anions respectively(Fig. 3a). Fluoride is the least dominant anion of the total anions. The order of anions abundance in the groundwater was found as HCO3-> Cl-> SO42-> NO3->F-. Among major cations, calciumwas the dominant ions representing on average 48% of total cations. Sodium and magnesium ions were of secondary importance, representing on average 27% and 19% of total cations, respectively. Potassium was least dominant cation and representing 6% of the total cations (Fig.3b). The order of cation abundance was Ca2+> Na+>Mg2+>K+.
Suitability of groun dwater for drinking and domestic uses
The physical and chemical parameters of the analytical results of groundwater were compared with the standard guideline values recommended by the World Health Organisation (WHO,1997) and Bureau of Indian Standards (BIS, 2003) for drinking and public health standards (Table 1).The pH of the groundwater samples (7.0–8.0) are within the safe limit of 6.5–8.5, prescribed for drinking water. The values of TDS exceed the desirable limit of 500 mg L-1 in55.5 % samples of groundwater. The total hardness (TH) is the properties of water by which it prevents the lather formation with soap and increasing the boiling point of water. Hardness of the water is the property attributed to the presence of alkaline earths. Water can be classified into soft (75 mg L-1), moderately hard (75–150 mg L-1), hard (150–300 mg L-1) and very hard (>300 mg L-1) based on hardness (Sawyer and McCarty1967).The total hardness of the analysed groundwater of the study area varies between 120 and 598 mg L-1 (avg. 298 mg L-1) indicating moderately hard to very hard types of groundwater. The analytical data indicate that 7% groundwater samples moderately hard, 56% hard and 37 % very hard samples. The high hardness may cause encrustation on water supply distribution systems. There is some suggestive evidence that long term consumption of extremely hard water might lead to an increased incidence of urolithiasis, anecephaly, parental mortality, some types of cancer and cardio-vascular disorders (Agrawal and Jagetia 1997; Durvey et al. 1991).The chloride concentration in the groundwater of Ranchi township area varied between 30 to 176.3 mg L-1 (avg. 81 mg L-1). Chloride presents in a lower concentration in common rock types as compared to other constituents of natural water. It is assumed that bulk of the chloride in water is primarily either from atmospheric source or from seawater. Weathering of halite and evaporites is considered as the major lithogenic source of chloride (Singh 2013).Concentration of sulphate varies from 10 to 126 mg L-1 (avg. 59 mg L-1). Sulphate concentration in natural water is usually found between 2 and 80 mg L-1 and abnormal higher concentration of sulphate may be attributed to rock weathering or anthropogenic sources like industrial and agricultural effluents (Berner and Berner 1987). Concentrations of Cl- and SO42- are well within the desirable limit mg L-1. Concentration of nitrate in the analysed groundwater samples varies between 2.5 to 53.7 mg L-1 (avg. 18 mg L-1). Nitrate is an important pollutant in the environment, generally derived from atmospheric precipitation, agricultural fertilizers, human and animal excreta, biological fixation and nitrification of organic N and NH4 (Appelo and Postma1996). Concentration of NO3- exceeding the desirable limits of 45 mg L-1 in 7 % of the groundwater samples. Fluoride is an essential element for maintaining normal development of teeth and bones. The fluoride is beneficial to certain extent when present in the concentration of 0.8 to 1.0mg L-1 for classification of dental enamel especially for children below 8 years (Tiwari et al. 2003)where as causes dental fluorosis if present in excess of 1.5 mg L-1 and skeletal fluorosis beyond 3.0 mg L-1 if water consumed for a prolong period i.e. 6 months to several years (Nawlakhe and Bulusu 1989).Higher F- concentrationcauses dental and skeletal fluorosis such as mottling of teeth,deformation of ligaments and bending of spinal chord (Tiwari and Singh 2014). Concentration of F- is within recommended limit of 1.5 mg L-1in groundwater samples.
Table 1: Summary statistics of the analytical data and compare with WHO and
Indian Standard (IS: 10500) for domestic purposes
|
|
WHO(1997) |
WHO (1997) |
BIS 2003 (IS 10500) |
BIS 2003 (IS 10500) |
|||
|
Water quality parameters |
Units |
Range |
Average
|
Max. desirable |
Highest Permissible limits |
Max. desirable |
Highest Permissible limits |
|
pH |
- |
7.0 - 8.0 |
7.4 |
7.0-8.5 |
6.5-9.2 |
6.5-8.5 |
8.5-9.2 |
|
EC |
µS cm-1 |
238 - 1357 |
666 |
750 |
1,500 |
- |
- |
|
HCO3- |
mg L-1 |
90 - 488 |
245 |
200 |
600 |
200 |
600 |
|
F- |
mg L-1 |
0.1 – 1.4 |
0.6 |
0.6-0.9 |
1.5 |
1.0 |
1.5 |
|
Cl- |
mg L-1 |
30 – 176.3 |
81 |
250 |
600 |
250 |
1,000 |
|
NO3- |
mg L-1 |
2.5 – 53.7 |
18 |
- |
50 |
45 |
100 |
|
SO42- |
mg L-1 |
9.7 – 125.9 |
59 |
200 |
600 |
200 |
400 |
|
Na+ |
mg L-1 |
14.2 – 75.2 |
40.6 |
50 |
200 |
- |
- |
|
Ca2+ |
mg L-1 |
21.8 – 164 |
72 |
75 |
200 |
75 |
200 |
|
Mg2+ |
mg L-1 |
9.8 - 46 |
28 |
30 |
150 |
30 |
100 |
|
K+ |
mg L-1 |
1.6 – 19.3 |
8.5 |
100 |
200 |
- |
- |
|
TDS |
mg L-1 |
200 - 1157 |
560 |
500 |
1,500 |
500 |
2,000 |
|
TH |
mg L-1 |
120 - 598 |
298 |
100 |
500 |
300 |
600 |
Calcium and magnesium are the essential nutrient for the plant growth, animals and play an important role in the development of bone, nervous system and cell. One possible adverseeffect from ingesting high concentration of Ca2+ for long periods may be an increased risk of kidney stones (Maragella et al. 1996). Concentration of Ca2+ and Mg2+ are exceeding the desirable limits of 75 mg L-1 and 30 mg L-1 in 41 % and 37 % of the groundwater samples respectively. However, concentrations of both these ions are within the maximum permissible limit of 200 mg L-1 and 100 mg L-1(BIS 2003).Sodium and potassium are the most important elements occurring naturally. The major source of both the cations may be weathering of rocks (Singh et al., 1999) besides the sewage and industrial effluents. A higher sodium intake may cause hypertension, congenial heart diseases and kidney problems (Singh et al. 2008) and the excess amount of potassium present in the water sample may lead nervous and digestive disorder (Tiwari 2001). The recommended permissible limit for sodium and potassium concentration in drinking water is 200 mg L-1 (WHO 1997). Concentrations of Na+ and K+ are within the recommended limit of 200 mg L-1 in groundwater samples.
Suitability for Irrigation Use
Water is considered as an important resource which is required for the plant growth in agricultural production (Tiwari et al. 2013). Thus, the water quality evaluation in the area of study is carried out to determine their suitability for agriculture purposes. The suitability of the groundwater for irrigation is contingent on the effects on the mineral constituents of the water on both the plant and the soil. In fact, salts can be highly harmful. They can limit growth of plant physically, by restricting the taking up of water through modification of osmotic processes. Also salt may damage plant growth chemically by the effect of toxic substance upon metabolic processes. Parameters such as sodium absorption ratio (SAR), percent sodium (%Na), residual sodium carbonate (RSC) and permeability index (PI) for suitability of irrigation purpose have been discussed below:
Sodium absorption ratio (SAR)
Electrical conductivity and sodium concentration are very important in classifying irrigation water. The high salts in the water, besides affecting the growth of the plants directly, also affect the soil structure, permeability and aeration, which indirectly affect the plant growth. The U. S. Salinity Laboratory (1954) proposed a diagram for studying the suitability of groundwater for irrigation purposes based electrical conductivity and sodium adsorption ratio. In this diagram, irrigation water are classified as low (EC = 250 µS cm-1), medium (EC = 750-2250 µS cm-1) and very high (EC = 2250-5000 µS cm-1), salinity classes (USSL 1954). High salt concentration in water leads to formation of saline soil, while a high sodium concentration leads to development of an alkaline soil. The sodium or alkali hazard expressed in terms of SAR and estimated by the formula
SAR = Na / [ Ca + Mg]0.5
concentration are in meq 1-1
On the basis of SAR value, water are classified into low (SAR<6), medium (SAR 6-12), high (SAR 12-18) and very high (SAR>18)alkali waters. There is a significant relationship between SAR values of irrigation water and the extent to which sodium is adsorbed by the soils. If water used for irrigation is high in sodium and low in calcium, the cation exchange complex may become saturated with sodium.This can destroy the soil structure owing to dispersion of the clay particles. The calculated value of SAR in the groundwater of Ranchi township ranges from 0.6 to 2.0(avg. 1.0).The plot of data on US salinity diagram (USSL 1954) in which EC is taken as salinity hazard and SAR as alkalinity hazard shows that 55.5% of the samples fall in C2S1 categories indicating good to permissible quality of water for irrigation uses (Fig. 4). Due to low sodium and medium salinity, water of C2S1 class can be used for irrigation purpose on almost all soil with little danger of sodium problem. About 37% of the samples falls in the categories C3S1, indicating high salinity and low alkali water. High salinity water (C3) can not be used on soils with restricted and requires special management of salinity control. Such water can be used to irrigate salt- tolerant and semi-tolerant crop under favorable drainage conditions.
Percent sodium (%NA)
Percent sodium (%Na) is widely used for evaluation the suitability of water quality for irrigation (Wilcox, 1955). High percentage of Na+ with respect to (Ca2+, Mg2+, Na+) in irrigation water, causes deflocculating and impairing of soil permeability (Singh et al., 2008). The Indian Standard (BIS, 1991) recommends maximum sodium percentage (%Na) of 60% for irrigation water. The sodium percentage (%Na) can be determined by the formula
% Na = Na+ K/ (Ca+Mg+Na+K)x 100
concentration are in meq 1-1
The percent sodium in the study area ranged from 16 to 42 % (average 25.6%). The plot of analytical data on the Wilcox (1955) diagram relating EC and %Na show that water samples fall in two classes. About 63% of the water samples are excellent to good and 37% good to permissible quality, which may be used for irrigation purposes without any hazard (Fig. 5).
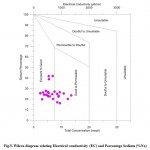 |
Figure 5: Wilcox diagram relating Electrical conductivity (EC) and Percentage Sodium (%Na) Click here to View Figure |
Residual sodium carbonate (RSC)
The quantity of HCO3- and CO3- in excess of alkaline earths (Ca2++Mg2+) expressed as RSC also influences the suitability of water for irrigationpurposes.The effect of carbonate and bicarbonate and suitability of water for irrigation can be assessed by computing the residual sodium carbonate (RSC) values by the following formula
RSC = (Co3 + HCO3) - (Ca + Mg)
concentration are in meq 1-1
RSC was considered to be indicative of sodicity hazard in water. Irrigation water having RSC value >5 meq l-1 is considered as harmful to growth of plant, while water with RSC value above 2.5 meq l-1 are not considered suitable for irrigation. In all of analyzed groundwater samples (100%), RSC values were below 2.5 meq l-1and water is found suitable for irrigation uses.
Permeability index (PI)
Permeability Index (PI) is another parameter for assessing the suitability of water for irrigation uses. Doneen (1964) classified irrigation waters based on the Permeability Index (PI). PI can be determined by the formula PI = (Na + √ HCO3)/ (Ca+ Mg + Na) x 100 all concentrations are in meq 1-1 Soil permeability is affected by long-term use of water rich in Na+, Ca2+, Mg2+, and HCO3-.Doneen (1964)classified irrigation water in three PI classes. Class-I and Class-II water types are suitable for irrigation with 75% or more of maximum permeability, while Class-III type of water, with 25% of maximum permeability, are unsuitable for irrigation. Plotting the dataon Donnen’s chart indicate that the 52% percent of the water samples fall in Class–I and 48% in Class-II in the Doneen’s chart implying that the water is of good quality for irrigation purposes with 75% or more of maximum permeability (Domenico and Schwartz, 1990) (Fig. 6).
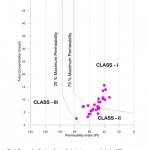 |
Figure 6: Doneen classification of water for irrigation uses on the basis of PI Click here to View Figure |
Conclusion
The groundwater of Ranchi township area is slightly alkaline in nature. The chemistry of groundwater is dominated by Ca2+ and Na+ in the cationic and HCO3- and Cl- in anionic abundances. In majority of the samples, the analyzed parameters are well within the desirable limits and water is potable for drinking purposes. However, concentrations of EC, TDS, TH, Ca2+, and Mg2+exceed the desirable limit at few sitesand needs treatment before its utilization. The groundwater of this area is very much affected by various natural sourcesand anthropogenic sources.The quality assessment of water for irrigation uses show that most of the groundwater can be used in irrigation without any treatment, considering all the calculated parameters like salinity hazard, sodium adsorption ratio (SAR), residual sodium carbonate (RSC) and permeability index (PI). However, high salinity values at few sites restrict the suitability of the water for irrigation uses and demand special management plan for the area.
Acknowledgement
The authors are grateful to Professor D. C. Panigarhi, Director, Indian School of Mines for his kind supportand authors are sincerely thankful to the Head of the Department of Environmental Science & Engineering, Indian School of Mines, Dhanbad, India, for his moral support and suggestions in the preparation of the paper. We thank Mr. Binay Prakash Panigarhi and other laboratory colleagues for their support and encouragement.
Reference
- Agrawal V. and Jagetia M., Hydrogeochemical assessment of groundwater quality in Udaipur city, Rajasthan, India, Proceedings of National Conference on Dimension of Environmental Stress in India. Dept. of Geology, MS University, Baroda, pp 151–154., (1997).
- Akoteyon et al., Determination of water quality index and suitability of urban river for municipal water supply in Lagos-Nigeria, Eur J Sci Res.,54(2): 263–271, (2011).
- Appelo C.A.J. and PostmaD., Geochemistry, groundwater and pollution, AA Balkema Publishers Rotterdam, (1993).
- Berner E. K. and Berner R. A., The global water cycle: geochemistry and environment, Prentice-Hall, Englewood Cliffs, (1987).
- BIS, “Indian standard drinking water specifications IS:10500. Bureau of Indian Standards, New Delhi, India”, 1991.
- BIS., Indian standard drinking water specifications IS10500:1991, edition 2.2 (2003–2009), Bureau of Indian Standards, New Delhi, (2003).
- Chatterjee R.,Tarafder G. andPaul S., Groundwater quality assessment of Dhanbad district, Jharkhand, India, Bulletin of engineering geology and the environment, 69(1): 137-141, (2010).
- Das S. et al., Source of high fluoride in ground water of Anugul, Dhenkenal District, Orrissa, Pollution Research,17(4): 385–392, (1998).
- Dhindsa S. S., BheelP. and MusturiaY., Hydrochemical study of ground water quality variation in Tonk District, Rajasthan, Indian Journal of Environment and Ecoplanning, 8(1): 129–136, (2004).
- DomenicoP. A. and SchwartzF. W., Physical and chemical hydrogeology (2nd edn) Wiley, New York, (1990).
- Doneen L. D., Notes on water quality in agriculture, Water science and engineering. Department of Water Sciences and Engineering, University of California, Davis. (1964).
- Durvey V. S. et al., Handbook on the methodology of water quality assessment, Rajasthan Agriculture University, Bikaner,(1991).
- FreezeR. A. and CherryJ. A., Groundwater,Prentice-Hall, Englewood Cliffs, (1979).
- Jain C. K et al., Assessment of ground water quality for drinking purpose, District Nainital, Uttarakhand, India, Environmental monitoring and assessment, 166(1-4): 663-676, (2010).
- JainC. K., Arsenic contamination in ground water: Indian scenario, Indian Journal of Environmental Health, 44(3): 238–243., (2002).
- Khurshid S., Zaheeruddin. andShbeer M. U., Degradation of water quality due to heavy metal pollution in Faridabad District, Haryana, India, Pollution Research,16(1): 41–43, (1997).
- KumarR.et al., Water resources of India, Curr Sci., 89: 794–81, (2005).
- KumaresanM. andRiyazddin P., Major ion chemistry of environmental samples around sub-urban of Chenai city. Curr. Sci., 9: 1668-1677, (2006).
- Maragella M., et al., Effects of mineral composition of drinking water on risk for stone formation and bone metabolism in idiopathic calcium nephrolithiasis, Ciln Sci.,9: 1313–318, (1996).
- MeenakumariH. R. andHosmani, S. P., Physicochemical and biological quality of ground water in Mysore City, Karnataka, Indian Journal of Environment and Ecoplanning, 7(1): 79–82, (2003).
- NawlakheW. G. and BulusuK. R, Water treatment technologies for removal of excessive fluoride. In C. P. Gupta (Ed.) Appropriate methodology for development and management of groundwater resources in developing countries, New Delhi: Oxford and IBH Publishers Ltd., 2, 815- 826, (1989).
- Ozlem, Tunc. Dede. et al., The use of water quality index models for the evaluation of surface water quality: A case study for Kirmir Basin, Ankara, Turkey, Water Qual. Expo. Healt.,5: 41–56,(2013).
- Raju N. J. et al., Hydro geochemistry for the assessment of groundwater quality in Varanasi: a fast-urbanizing center in Uttar Pradesh,India, Environmental monitoring and assessment, 173(1-4), 279-300, (2011).
- RamakrishnaiahC. R. et al., Assessment of water quality index for the groundwater in Tumkur Taluk, Karnataka State, India, Journal of Chemistry, 6(2): 523-530, (2009).
- Ramasubramanian V. et al., Analysis of physico-chemical characteristics of ground water quality and quality index in and around Sivakasi Town, Indian Journal of Environment and Ecoplanning, 8(1): 171–176, (2004).
- Salve P. R.et al., Assessment of groundwater quality with respect to fluoride, Bulletin of environmental contamination and toxicology, 81(3): 289-293, (2008).
- SawyerC. N. And McCartyP. L., Chemistry of sanitary engineers, 2nd ed. McGraw Hill, New York, pp 518, (1967).
- SinghA. K.,Raj B., Tiwari A. K. and MahatoM. K.,Evaluation of hydrogeochemical processes and groundwater quality in the Jhansi district of Bundelkhand region, India, Environmental Earth Sciences, 70(3): 1225-1247, (2013).
- Singh A.K., Tewary B. K. andSinha A., Hydrochemistry and quality assessment of groundwater in part of NOIDA metropolitan city, Uttar PradeshJournal of the Geological Society of India, 78(6): 523-540, (2011).
- Singh, A. K. et al., Aquatic geochemistry of Dhanbad district, coal city of India: source evaluation and quality assessment, J. Geol. Soc. India,69: 1088–1102.(2007).
- Singh, A. K.et al., Hydrogeochemical processes and quality assessment of groundwater in Dumka and Jamtara districts, Jharkhand, India, Environmental Earth Sciences,67(8): 2175-2191, (2012).
- Singh, A. K.et al., Major ion chemistry, weathering processes and water quality assessment in upper catchment of Damodar River basin, India, Environ. Geol.,54: 745–758, (2008).
- Sohani D., Pande S. andSrivastava V. S., Ground water quality at Tribal Town: Nandurbar (Maharashtra), Indian Journal of Environment and Ecoplanning, 5(2), 475–479, (2001).
- Tiwari, A. K. et al., Fluoride content in drinking water and ground water quality in rural areas of Tehsil Mau district, Chitrakoot, Indian J. Environmental Protection, 23(9): 1045-1050, (2003).
- Tiwary R. K., Environmental impact of coal mining on water regime and its management, Water Air Soil Pollut.,132: 185–199, (2001).
- Tiwari A. K., Singh P. K. and Mahato M. K., Chemistry of Groundwater and Their Adverse Effects on Human Health: A Review, Indian Journal of Health and Wellbeing,4(4): 923-927, (2013).
- Tiwari A. K., Mahato M.K. and Singh A.K., Quality assessment and suitability for irrigation uses of surface water of Pratapgarh district,Indian J. Environmental Protection,33(5): 370-378, (2013).
- TiwariA. K. andSingh A. K., Hydrogeochemical investigation and groundwater quality assessment of Pratapgarh district, Uttar Pradesh, Journal of the Geological Society of India, 83(3): 329-343, (2014).
- Venugopal T. et al., Environmental impact assessment and seasonal variation study of the groundwater in the vicinity of River Adyar, Chennai, India, Environmental monitoring and assessment, 149(1-4), 81-97, (2009).
- WHO., Guidelines for drinking-water quality, vol 1, Recommendations. World Health Organisation, Geneva, pp 1–4, (1997).
- WHO., Water, sanitation and hygiene links to health—facts and figures, World Health Organization, Geneva, (2004).
- WilcoxL. V., Classification and use of irrigation waters, USDA Circular 969, Washington DC, USA, pp 19, (1955).


