Hydrogeochemical Facies of Hot Springs Water in Jebel Mara Mountain, Darfur, Western Sudan
Sami H. Mohamed1 * and Abuagla Y. Ahmed2
http://dx.doi.org/10.12944/CWE.9.3.08
Hydrogeochemical assessment have been carried out to study the concentration ofNa+, K+, Mg2+, Ca2+, Cl-,SO42-, HCO3-, and other parameters like temperature, pH, electric conductivity (EC), total hardness(T.H) and total dissolved solid (TDS) in ten hot springs water samples of some parts of Jebel Mara Mountain, Western Sudan. The results of water analysis revealed the average values of pH,electrical conductivity, total dissolved solids and total hardness, 9.46, 428 µS/cm, 667.2 mg/l and 102 mg/l respectively. The pH, TDS and EC variations confirmed light-salty nature of groundwater. It is also apparent from the results that, average concentrations of sodium, potassium, calcium,magnesium, chloride, sulphate,and bicarbonate ions were 43.6, 16.4, 53.7, 44, 37.5, 26.2, 428.5 mg/l, respectively. Chloride ion concentration ranged from (30 to 46 mg/l), sulphate ion concentration ranged from (10 to 40mg/l) and carbonate concentration measured ranged from (215 to 800 mg/l).The results were found to be above the recommended values given by W.H.O., 1984) and warranty further recommended studies for the best improvement and utilization of springs water.
Copy the following to cite this article:
Mohamed S. H, Ahmed A. Y. Hydrogeochemical Facies of Hot Springs Water in Jebel Mara Mountain, Darfur, Western Sudan. Curr World Environ 2014;9 (3) DOI:http://dx.doi.org/10.12944/CWE.9.3.08
Copy the following to cite this URL:
Mohamed S. H, Ahmed A. Y. Hydrogeochemical Facies of Hot Springs Water in Jebel Mara Mountain, Darfur, Western Sudan. Curr World Environ 2014;9(3). Available from: http://www.cwejournal.org/?p=7058
Download article (pdf) Citation Manager Publish History
Introduction
In all solution environments bare metal ions are in continuous search of a partner. The environment of interest is water where in all metals; cations are hydrated to form aquo complexes (Cohen Shanes,2001).Water analysis is very challenging due to the low concentrations of elements so they are susceptible to enter element interference and matrix effect (N. Kahraman and Fahrunisia, 1976).
There are some 1.5 × 10⁹ km3 of water on the surface of the Earth. Of this 98.3 per centis in the oceans/seas and 1.6 per cent in the form of ice. The remaining 0.1 per cent exists as groundwater and in lakes and rivers. All of this water, and the water used, has been a part of the natural water cycle, or global hydro logical cycle, at some time. This cycle is based on the continuous movement of water between the surface of the Earth and the atmosphere. The water cycle involves a dynamic balance between the two processes of evaporation and precipitation. However,some water may manage to move downwards under the influence of gravity (termedinfiltration), through porous rock strata, until it reaches an impenetrable layer. Here it collects and becomes the groundwater that is the source of wells and of the springs that feed streams, rivers and lakes.The surface of this groundwater is called the water table.Under natural conditions, a water table will fall or rise according to prevailing weather conditions, and whether or not it is being used as a water supply to a spring or as areservoir for human use. Since groundwater spends a great deal of time in contact with subterranean rocks, what dissolved materials it contains will be a reflection of the geology of those rocks, as well as the surface material it has passed through. (Wright, 2003). In areas where the natural rock is rich in fluoride or where there is geothermal or volcanic activity, veryhigh fluoride levels, up to 50 mg/L, may be found in groundwater or hot springs. (Zhang, 2007).
Location and Geology of Jebel Mara Mountains
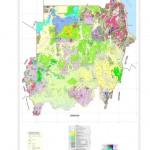
Jebel Mara volcanic complex situated in Western and Southern Darfur State, western Sudan, with highest part situated some 80 miles from El Fashir town (capital of North Darfur State). The complex appears to have been formed during Tertiary but explosive and intrusive activity probably extended into Pleistocene and seen into recent. The predominant rocks are mainly basalt, but trachyte and phonolite are said to be common locally. Pyroclastic rocks occur are found near the crater, and the Jebel Mara itself is described as massive crater 5 Km. in diameter with two crater lakes, one saline (atron), the other fairly fresh, surrounded by walls of ash and tuff, pumice occurs locally.(ref 1) A number of hot springs were observed throughout the area especially near the crater.
In apparent contrast to the arid climate, there are many discharge springs in the western part of Dariba crater, in Jebel Mara Mountains. These springs contains an unusually high concentration of sulphur vapor, high discharge and high dissolved material which lead to high content of anions and cations, the on goining research shows that in the ten springs watershed, the springs also contribute significantly to the hydrologic budget of the system (Unpublished data).Ground water issuing from hot springs in ash basalt, are believe to be consist of local recharge from Dariba Crater (Cater lake). More than 2 Km. to the south east water from Dariba Crater believes to come in inter-basin flow to reach the hot springs through fissures and cracks connected to each other. Bathing in natural thermal waters is very popular in Jebel Mara area. Thermal waters have also been used for medical therapy.
Description of the Study Area
The area under consideration located in arid to a semi arid climate between 24°25ʹ -24°35ʹ E and latitude 13° 10ʹ -13° 20ʹ N. Ten hot springs located there, are characterized by two main seasons; ( a) Dry season started approximately from Nov. to May, and (b) rainy season from June to Oct. The climate in semi arid condition varies from region to region and from season to season. During the Manson, the average rainfall varies from about 900 mm. in the western districts to more than 1100 mm. at the upper zone (hilly area). The average temperature varies from 15° C (during January) to 40° C (during May). The natural lake (Dariba Crater) located just 1.5 to 2 Km. southwest of the hot springs (Fig1). About ten warm springs were recorded on Jebel Idwa, a subsidiary cone about 2 Km far from Dariba Crater. Some hot springs and fumaroles along the northwest margin of the inner Dariba Crater lake were recorded, the other hot springs were situated Near Koronga village. The temperature of hot springs ranging from 55° to more than 60° C. Marah Mountains is a range of volcanic peaks created by a massif that rises up to 3,000 m. It is located in the center of Darfur region of Sudan. The highest point is Deriba Crater (two lakes are there the largest and the smallest). The upper reaches of the massif is a small area of temperate climate with high rainfall and permanent springs of water. The last eruption occurred around 2000 BC.
|
|
Figure 1: "Map of the Area" |
Materials and Methods
Water samples were collected from ten hot springs near Koronga village, about 2 Km away from Dariba Crater during May 2002, using polyethylene bottles.At each station, temperature, pH, and specific electrical conductivity of water were determined before filtering, using thermometer, pH meter and E.C meters, respectively. All samples were analyzed at Al Neelain University laboratory, School of Applied Earth Sciences & Technology and Vet. Research labratory, Soba, Khartoum state for major ion chemistry, using standard methods for examination of water and waste water, American Public Health Association (APHA,1984), American Water Works Association (AWWA,1984), and Water Control Federation (WCF,1985). Standard classical methods Jackson, (1958), Trivedy and Goel, (1984) were also used. Total dissolved solids (T.D.S) were computed by multiplying the S.E.C by the factor (0.65), Bicarbonate (HCO3-) were estimated by titrating the samples with HCl, total hardness (TH) as CaCO3 were analyzed tetrimetrically using standard E.D.T.A solution. Chloride (Cl-) was estimated by titration using standard AgNO3 solution. Sulphate (SO42-) measured by gravimetric method using barium chloride to precipitate the salt.Magnesium (Mg2+) was calculated from the total hardness. Calcium (Ca2+), Sodium (Na+) and Potassium (K+) were measured using flame photometer. All parameters are expressed in milligram per liter (mg/l) except E.C (expressed in Ms/ cm.). The analyzed precession for the measurement of cations (Ca2+, Mg2+, Na+ and K+), anions (HCO3-, Cl-and SO42-) were indicated by the ionic balance error, which is observed to be within the stipulated limit of ± 5%.
Results and Discussions
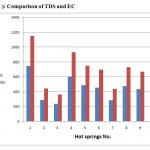
Chemical and physical analyses of the ten hot springs water samples were presented in Table (1) and,the results showed high temperature in all springs (range from 50 – 60 ). The highest value of pH, average 9.46, indicates an alkaline nature of water. The desirable limit of pH values for drinking water has been given by the World Health Organization (W.H.O, 1984) is varying from 7.00 to 8.50, while the maximum permissible limit level is 9.2.Electrical conductivity (E.C) in water from hot springs was varying from 240 µ /cm (spring No.3) to 746 µ /cm, (spring No.1). The concentrations of T.D.S. in hot springs were varying from 365 to 1150 mg/l. Generally all samples show higher concentrations of T.D.S values. All T.D.S values were more than 500 mg/ l). The upper limit give by W.H.O, 1984 is 1000 mg/l. Comparison between T.D.S and E.C values, Fig.(2), shows that when values of TDS increase the values of E.C increased simultaneously.The TDS and EC variation confirmed light salty nature of groundwater Springs No. 1 & 4 shows higher values of TDS (more than 800 mg/l). Samples analysis for total hardness (TH) has been classified as medium hard water except samples No.7 classified as hard water, the standards of hardness for drinking water supply vary; the World Health Organization (1984) suggested an upper limit is 500 mg/l of CaCO3. The American Water Works Association has prescribed an upper limit of 800mg/l of CaCO3 for ideal water Hem, (1989), BBS Sinbal and R.P. Gupta, 1999). The concentration of calcium varies from 24 to 95 mg/l. and has no harmful effect. From Table 1, springs No. 1, 4, and 9 shows higher concentrations of calcium (above 68 mg/l) .All values of calcium in hot springs were normal and fall within the permissible limit given by W.H.O, (1984). According to E.E.C. (European Economic Community) the recommended value is up to 50 mg/l, where as the I.S.I. (Indian Standard Institution) the recommended value is 30 mg/l. No recommended value given by W.H.O. regarding this ion. The high values of magnesium from all hot springs waters have been examined. This is mainly due to presence of olivine, pyroxene and rocks covering the whole study area. About 60% of the samples were taken from springs has higher concentration of Sodium (more than 60 mg/l) where as 40% of the samples showed concentration less than 50 mg/l. Sodium considered harmful to persons suffering from Cardiac disease and high blood pressure. Therefore, the concentration of sodium should be within the limit recommended by W.H.O., (1984) as 200 mg/l for drinking water. Regarding the samples analysis for Potassium (K+) springs No. 1,4,5,8 and 9 has high values. Among the cations, the concentrations of Ca2+ , Mg2+ , Na+ and K+ ions ranged from 24 to 95 , 15 to 80, 10 to 75 ,5 to 35 mg/l.Comparison between presence of cations of hot springs in the order of Ca>Mg> Na >K.
Table 1: Results of physical and chemical analyses of water samples from ten hot springs
|
Spring No. |
pH |
E.C µS/cm |
T.D.S mg/l |
T.H mg/l |
Na+ mg/l |
K+ mg/l |
Ca2+ mg/l |
Mg2+ mg/l |
Cl- mg/l |
SO42- mg/l |
HCO3- mg/l |
|
1 |
9.70 |
746 |
1150 |
175 |
75 |
35 |
95 |
80 |
35 |
25 |
800 |
|
2 |
9.59 |
290 |
445 |
60 |
30 |
10 |
25 |
35 |
30 |
10 |
300 |
|
3 |
9.27 |
240 |
365 |
65 |
10 |
5 |
50 |
15 |
35 |
30 |
215 |
|
4 |
9.49 |
606 |
930 |
130 |
70 |
25 |
85 |
45 |
46 |
25 |
630 |
|
5 |
9.65 |
488 |
750 |
100 |
45 |
20 |
35 |
65 |
35 |
40 |
500 |
|
6 |
9.66 |
455 |
700 |
115 |
60 |
15 |
70 |
45 |
45 |
25 |
420 |
|
7 |
9.50 |
288 |
440 |
57 |
32 |
11 |
24 |
33 |
32 |
12 |
295 |
|
8 |
9.00 |
475 |
730 |
135 |
44 |
19 |
33 |
62 |
36 |
39 |
490 |
|
9 |
9.50 |
436 |
668 |
111 |
58 |
16 |
68 |
42 |
43 |
23 |
410 |
|
10 |
9.20 |
256 |
494 |
72 |
12 |
8 |
52 |
18 |
38 |
33 |
225 |
|
Average |
9.46 |
428 |
667.2 |
102 |
43.6 |
16.4 |
53.7 |
44 |
37.5 |
26.2 |
428.5 |
|
ST.D |
0.23 |
164.31 |
244.12 |
38.75 |
22.63 |
8.89 |
25.07 |
20.51 |
5.44 |
9.97 |
185.37 |
|
Min. |
9 |
240 |
365 |
57 |
10 |
5 |
24 |
15 |
30 |
10 |
215 |
|
Max. |
9.7 |
746 |
1150 |
175 |
75 |
35 |
95 |
80 |
46 |
40 |
800 |
|
|
Figure 2: Comparison of TDS and EC |
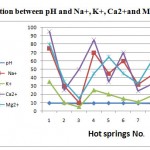
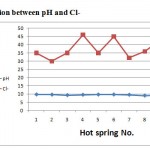
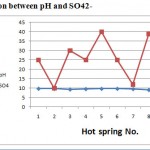
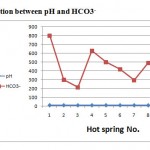
Regarding the dissolved anions, chloride concentrations were varying from 30 to 46. Chlorides concentrations in hot springs are restricted in range (less than 55 mg/l). Sulphate concentrations were varying from 10 to 40 mg/l, less than 75 mg/l. All samples analyses for sulphate fall within the permissible limit. Bicarbonate ion concentration ranged from 215 to 300. The averages of anions were 428.5, 37.5, and 26.2 mg/l respectively. The order of their abundance (epm %) is HCO3->Cl-> SO42-. Variations in chemical parameters of hot springs with pH were shown in Figs. (3),(4),(5) and (6), the pH values depend on the chemical parameters with coefficient correlation of the order Cl-> Na >K>HCO3-> Mg> Ca> SO42-.
|
|
Figure 3: Relation between pH |
|
|
Figure 4: Relation between pH and Cl- |
|
|
Figure 5: Relation between pH and SO42- |
|
|
Figure. 6: Relation between pH and HCO3- |
Conclusions
Basic information on the concentration levels of EC, TDS, TH, Na+, K+, Ca2+, Mg2+, Cl-, SO42- and HCO3- in hot springs at different locations near Koronga village, at Jebel Maramountain, Western Sudan has been obtained in this study. The following concluding observations can be made on the basis of the data presented:
-
Some springs flow all the year around whereas some spring are only flow for part of the year
-
All Samples taken from hot springs has its temperature ranged from 55° to 60°C, higher pH values which consider alkaline in range (9.00−9.66), high T.D.S. (365−1150 mg/l), rich in sodium (10−75 mg/l), rich in bicarbonate (215−800 mg/l) and higher total hardness. Springs No. 1,4 and 8 can be classified as hard water. Chloride ions concentrations in hot springs are restricted in range (less than 55 mg/l). Sulphate ions concentration wasless than 75 mg/l.
-
All samples analyses for sulphate fall within the permissible limit.
-
Alkalinities concentrations range from moderates to high values (from 215 to 800 mg/l. It appears that alkalinity decreases toward direction. Water taken from hot spring classified as Calcium -Sodium –Bicarbonate Chloride type. In the study area, thermal water associated with Tertiary rocks. Heat for thermal waters comes from volcanic, tectonic activity and deep water circulation in the fracture rocks. All Samples from hot springs classified as C1S1* andC1S2*. All geothermal waters in Jebel Mara Mountain are closely associated to joints and fractures of Tertiary basalt. All hot springs waters classified as medium hard water except spring No.7.
-
Natural disaster such as earthquake, drought, volcanic eruption, or landslides can affect the nature of hot springs; some may move location, others may increase or decrease in yield.
According to the results obtained from the data analyses and the previous discussion, the following recommendations and further studies require to be given due consideration
-
To protect springs from pollution and contamination, the spring’s area should then be fenced to keep animals and people out of the area.
-
Further geological surveys should be carried out together with subsequent chemical analysis (trace elements should be studied)
-
More research to be carried out in the whole area (Jebel Mara), to give detailed studies to evaluate quantitatively and qualitatively the potentialities of the hot springs.
-
We recommend that springs waters can be used for geothermal electricity to supply large area.
*Abbreviations used by United States Department of Agriculture (U.S.D.A., 1954) to classify water on the basis of total salinity and sodium, (C1low salinity water, S1 Low sodium water, S2 medium sodium water)
References
-
A.P.H.A (1975). American Public Health Association, Standard Methods for theExaminationof Water–Waste Water, 14th edit., A.P.H.A., A.W.W.A., andW.P.C.F., Washington D.C.
-
A.P.H.A (1984). American Public Health Association, Standard Methods for theExaminationof Water – Waste Water, 17th edit., A.P.H.A., A.W.W.A., and.P.C.F., Washington D.C.
-
A.P.H.A, (1992). Standard methods for the Examination of Water and Waste Water, American Public Health Association, Washington D.C.
-
Cohen, T. and Shanes, S.Q., (2001),Trace metals in fish and invertibrates of three Californian Coastal Wetland, Marine pollution bulletin Vol. (42), No. (3), p.224
-
Hem J.D., (1959). Study and interpretation of the Chemical Characteristics of Natural Water,2 nd ed., U.S.A. Geological Survey, Water Supply, United States Geo.Survey andWaterSupply.
-
Hem J.D., (1971). Study and interpretation of the Chemical Characteristics of NaturalWater, 2nd ed., U.S.A. Geological Survey, Water Supply, United
-
N., Kahraman and Fahrunisia I. Olmez, (Identification of inorganic pollutants in stream water) at: measurements detection and control of environmental pollutants, IAEA (1976).
-
W.H.O., (1984). Guidelines for Drinking Water, Water Quality, Vol.1, 2, 3, Health criteria and other supporting information, Geneva.
-
W.H.O., (1995).Guidelines for Drinking Water, Water Quality,2nd edit ,Vol.1, W.H.O., EasternMediterranean Regional office, Geneva. Health Criteria and other Supporting Information, Geneva.
-
Wright, J., Environmental chemistry, Routledge, (2003),New York, . p280
-
Zhang, C., (2007), Fundamentals of Environmental Sampling and Analysis, John Wiley & Sons, New Jersey, p 393


