Knowledge-Based System for Environmental Monitoring of Contract Areas in the Caspian Sea
R.A. Karayev1 * , K.A. Aliyev2 , N.YU. Sadikhova1 and X.F. Imamverdiyeva1
1
Innovation Technical and Construction Servies LLP,
Baku,
Az1025
Azerbaijan
http://dx.doi.org/10.12944/CWE.9.3.07
The paper presents a system of environmental monitoring (EM) of Contract Areas, which allows to differentiating the impact caused by the activities of the operator of Contract Area, and the impact caused by extraneous sources of pollution (adjacent oil fields development, industrial, agricultural and municipal discharges, mud volcanoes, dumping, etc.). As impact indicators used benthic communities (motionless infauna), widely used in world offshore practice. System refers to category of knowledge-based support tools of EM. System of this category opens up additional opportunities to improve the adequacy and effectiveness of the EM in the difficult conditions of the Caspian Sea, exacerbated by the “new oil bum” on the Caspian shelf and geopolitical situation prevailing in region after the collapse of the Soviet Union.
Copy the following to cite this article:
Karayev R.A, Aliyev K.A, Sadikhova N.Y, Imamverdiyeva X.F. Knowledge-Based System for Environmental Monitoring of Contract Areas in the Caspian Sea. Curr World Environ 2014;9 (3) DOI:http://dx.doi.org/10.12944/CWE.9.3.07
Copy the following to cite this URL:
Karayev R.A, Aliyev K.A, Sadikhova N.Y, Imamverdiyeva X.F. Knowledge-Based System for Environmental Monitoring of Contract Areas in the Caspian Sea. Curr World Environ 2014;9(3). Available from: http://www.cwejournal.org/?p=6804
Download article (pdf)
Citation Manager
Publish History
Introduction
Currently, the throughout offshore Caspian environmental monitoring of Contract Areas is carried out according with the principles of “best international practice",1 formed under conditions of open water bodies (North Sea, Gulf of Mexico, the Persian Gulf, Gulf of Alaska, etc).
Unfortunately, these principles do not reflect the conceptual features of theCaspian Sea: closed water body, long term historical pollution, the close proximity of numerous natural and anthropogenic sources of pollution, the critical state of the sea ecosystem, the ecological capacity drop majority of its plots, etc.
With the growing scale of oil production these circumstances can lead to very inadequate environmental impact assessment from activity of concrete operators.2,3 For a long time in the region raises the question of the development of EM systems that allow some way to identify the impact caused by external sources of pollution located outside the Contract Area.4,5,6,7
Today the question of the development of such systems gets a special acuteness for the following considerations:
1. Planned to large-scale growth of oil production in the Caspian shelf (figure 1).
|
|
Figure 1: Offshore prospects of Caspian Sea |
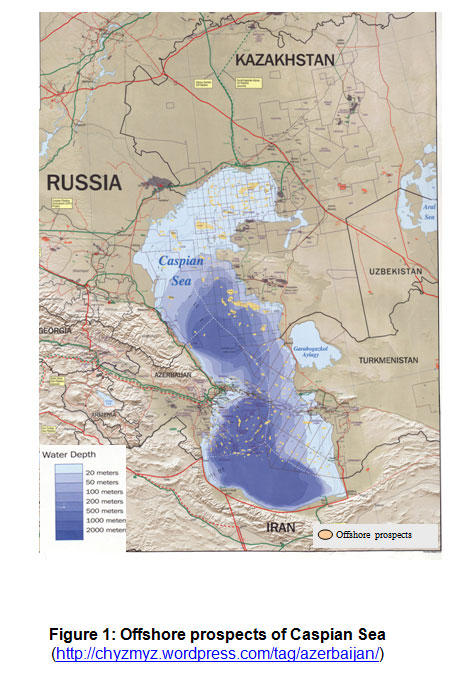
In particular, the planned to development of the sub salt mega structures in the Eastern of the North Caspian, characterized by ultra-high formation pressure (850-1200 atmospheres), high temperature (120-1400 С) and high sulfur content (up to 25%).2
The elaboration of these fields is connected with the possibility of major accidents leading to large-scale transboundary pollution.7 Along with this, the all Contract Areas of theCaspian Seaare under the constant influence of numerous external pollution sources. Under these conditions, each of the operators falling within high-risk zone, interested in identifying "another's" impact on his Contract Area.
2. With the growing scale of oil production inevitably will be tightening environmental legislation, and accordingly sanctions for pollution.
3. Under these conditions, each of the companies will seek to satisfy the requirements of national environmental standards and international Tehran Conventions8 (www.caspianenvironment.org) and do not bear the burden of responsibility for the "another’s" impact.
The task of development of a system of differentiated monitoring (Δ-monitoring) has no analogues in international offshore practice and can not be solved within the traditional approaches, used by operators of the region.4,9,10,11
For solving this task new approaches are required and new monitoring tools.
Some prospects in this direction open knowledge-based approach, which is based on ideas and methods of knowledge engineering [Waterman]. Below is represented the knowledge-based system of Δ-monitoring, demonstrating possibilities of knowledge engineering in the part of differentiation of the impacts caused by activities of the operator of Contract Area and impacts caused by external sources of pollution
The strategy of the Δ-monitoring Impact indicators
Essence of the strategy Δ-monitoring, we describe on an example of a particular type of bio-indicators of anthropogenic impact - benthic communities. In world offshore practice, the benthic communities (motionless infauna) for long time and is widely used as standard indicators of anthropogenic impact.4,9,12,13,18 A long time they remain at their places of permanent habitation and statistical significant responding to prolonged oil and chemical pollution.
Impact indexes
Generally accepted indexes characterizing state and degree of impact are: species structure, total biomass, density, species richness, diversity indexesShannon, Pielou, Simpson et al.,4,9,14,15,16,17
The calculation of these indexes is based on the data of field measurements performed on a specially designed network of stations
The strategy of building a network of sampling stations
In the system of Δ-monitoring the network stations of benthic monitoring is built on the principle "two-level monitoring" (US EPA, 1991).11,13
In accordance to this principle, organize the "background polygon" (BP) and "impact polygon" (IP) Contract Area. Polygons organized taking into account the physical-chemical and biological characteristics of the marine environment of the Contract Area and neighboring areas of the sea.
Background polygon - it is ring stations located at the distance at which, by hypothesis, the impact of the operator has little or no. Impact polygon - it is ring stations located as close as possible to the center of the point of action of the operator (stationary platform, floating drilling rig, an artificial island, etc), where the impact of the operator can be manifested with the highest probability (Fig. 2).
|
|
Figure 2: Layout of the placement stations |
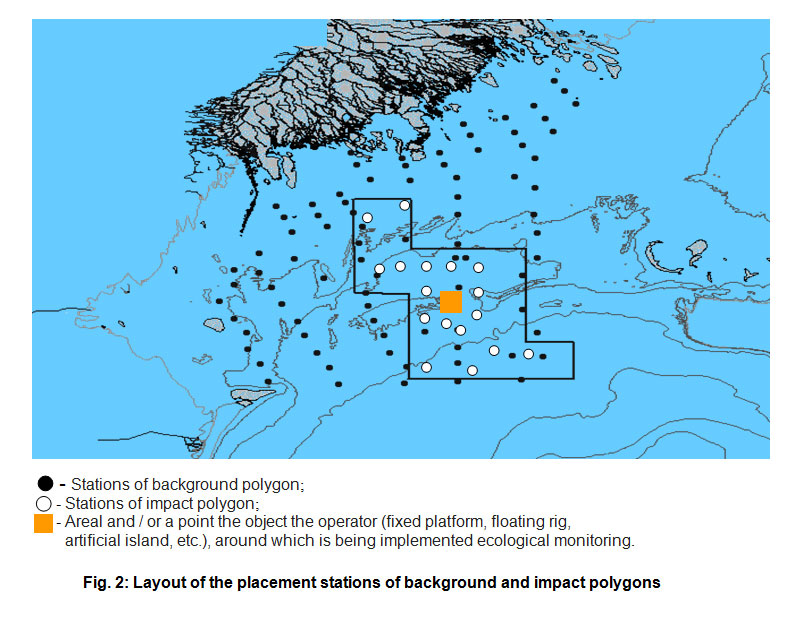
When selecting the network of stations addresses factors such as topography of the seabed, sea currents, bottom sediment type, water depth, potential external sources of pollution, their location and possible types of impacts, chemical parameters of water in the area of development and projected discharges of operator into the marine environment (drilling mud, sludge, cement, process water, domestic sewage, drainage effluents).
Choosing spatiotemporal scheme of background polygon and impact polygon in the Caspian Sea can be made taking into account the recommendations contained in the.10,11
Background polygon is designed to provide relevant data for a certain period of time. He is fixed and remains so throughout the analysis time.
Impact polygon designed to obtain information about the location and value of impact. This polygon may be partially or completely increased depending of impact registration. If the impact registered then polygon increases by arbitrarily small value as long until no registration impact. Thus, it is determined where the impact is concentrated
Choice of impact indexes
As the main indexes of the impact are selected characteristics of benthic communities, reflecting the dominant taxons of benthic infauna, its original condition and spatial distribution, the possible types of "oil succession" communities established by the results of field-analogies development.
Statement of the task Δ-monitoring
The task Δ-monitoring is to design the differentiator D(t0,tn), which provides mapping

where t0, tn - the beginning and end of the cycle (phase) field development; I(S) - the standard indexes impact on the benthic communities in the Contract Area, S - scales for indexes assessment; R - extraneous sources of pollution (oil and gas nearby enterprises in the coastal and the shelf zone, historical pollution, mud volcanoes, griffins, agricultural, industrial and municipal discharges, dumpings);
Δ0 (P, I, S) - index of residual impact from the operator's activities Contract Area;
Δ(P, R, I, S)- index of total residual impacts caused by activities of operator and extraneous sources of pollution.
Task of differentiator D(t0,tn) is to provide a differentiated assessment of the impact caused by the activities of the operator, and the impacts caused by extraneous sources of pollution.
Logic of operation of the differentiator D(t0,tn)
Logic of operation of the differentiator D(t0,tn) developed as a result of expert discussions. In discussions were highly helpful participation of local experts fromKazakhstan,Russia, andIran, and specialists from environmental departments British Petroleum, Agip, Total, Lukoil.
These discussions allowed the identification metaheuristics of Δ-monitoring, which allows to distinguishing between changes in the benthic communities caused by external influences (natural, technogenic), on changes in benthic communities caused by the activities of the operator Changes of the first kind are detected by analysis of samples from stations of the background polygon. Changes of the second kind are detected by the joint analysis conducted for samples from stations of background and impact polygons.
Procedure building the differentiator D(t0,tn)
Procedure building the differentiator D(t0,tn) includes the following steps.
Step 1: Choice of impact index (indexes).
As an index can be selected, for example, the most popular in the regional projectsShannon index.19,20 Shannonindex, widely used for the integrated assessment of biodiversity, is also a good ecological indicator of the state benthic communities. On value of this index can judge the degree of transformation of the structure of benthic communities under the impact of stress factors.
Step 2: The selected impact index are mapped to following four different values:
(1) The value of this index outside the area of impact (background polygon) before the start field development (BEFORE_BP) (2) The value of this index inside the area of potential impacts (impact polygon) before development (BEFORE_IP); (3) The value of the index outside the area of impact after the start of development (AFTER_BP) (4) The value of the index inside the area of impact after the start of development (AFTER_IP).
Step 3: Logic of operation of the differentiator D(t0,tn) on these four values is formed with the following considerations.
Remark 1: The difference between values (2) and (4) is the change that occurred on the development area, and thus provides an apparent level of impact. But one must consider the possibility of natural changes in the biological resource that occurred at the same time as the changes apparently caused by the field development.
Remark 2: The difference between values (3) and (4) would tentatively provide this clarification. But the possibilities then arise that (a) values (3) and (4) may not have been affected by the same influences over time; or (b) if they were, they may have started from different predevelopment levels. Thus, value (I) must be compared with value (3) to clear up possibility (a), and value (I) must be compared with value (2) to clear up possibility (b).
Remark 3: The overall results of these comparisons (i.e., result of work of the differentiator D(t0,tn)) would then indicate whether the observed difference between values (2) and (4) represented a true impact caused by the operator activities.
Step 4: Considerations set out above, can not be formalized on the basis of traditional mathematical approaches. However, they simply can be formalized with the help of knowledge-based approach. In this case, the differentiator should include knowledge base (KB) and inference mechanism (IM), which are basic components of the knowledge-based support tools [21]. KB contains the formalized heuristics ("formulas") for solving of the task. IM provides a solution of the task on admission at his input initial data. In accordance with the Remarks 1, 2, 3, knowledge base will include the following four ratios R1, R2, R3, and R4, which defined on four values of selected impact index: KB:: = (R1, R2, R3, R4), where R1 = (BEFORE_BP)/(TOTAL_BP) R2 = (AFTER_IP)/(AFTER_TOTAL) R3 = (AFTER_IP)/(TOTAL_IP) R4 = (BEFORE_BP)/(BEFORE_TOTAL) TOTAL_BP = (BEFORE_BP) + (AFTER_BP) TOTAL_IP = (BEFORE_IP) + (AFTER_IP) AFTER_TOTAL = (AFTER_IP) + (AFTER_BP) BEFORE_TOTAL = (BEFORE_IP) + (BEFORE_BP). R e m a r k 4. Years of experience hydrobiological studies show that in the marine undisturbed ecosystems Shannon index, usually, is in the range of 1, 5 to 5 bits/individual [17, 20]. An easy analysis shows that for these values of the Shannonindex the values of the ratios R1÷R4 will vary in the interval (0, 1).
Step 5: Inference mechanism, which solves the problem of differentiation impact, analyzes ratios R1÷R4 in accordance with the reasoning (heuristics), set out in Remarks 1, 2, 3:
IM:: = ₳ (R1, R2, R3, R4) → D(t0, tn).
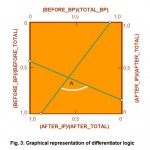
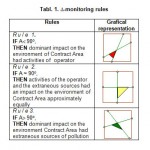
A good way to describe the work of IM is a graphical representation. These values of ratios R1 – R4 are plotted on a graph as shown in Figure 3. The ratio values are connected with straight lines, left to right and top to bottom, and the lower right quadrant angle created by the two crossed lines is measured. If the angle is less than 90°, then the prevailing negative impact on the environment Contract Area has had operator's activity. If the angle is greater than 90°, this means that the dominant impact on the environment Contract Area has had external sources pollution. Angle 90 ° indicates that the impacts from external sources of pollution and from operator's activity were approximately equal.
|
|
Figure 3: Graphic representation of differentiator logic |
Step 6: Δ-monitoring logic outlined above, can be formulated in the form of production rules presented in Table.1.
|
|
Table 1: ∆-monitoring rules |
Conclusion
Due to the limited format outside of article remained a number of important issues that were identified in the process field tests of the system Δ-monitoring. They are due to the circumstance that along with the anthropogenic impact on the characteristics of benthic communities (abundance, biomass, species diversity, etc.) can affect a number of other factors:
-
the non-uniform distribution of benthos on the bottom of the monitoring area, caused by a patchy distribution of sediments, the depth of the sea and the regime of sea currents, which transport the stirred up sediments;
-
the spatial error of sampling,
-
benthos shifting at the bottom during strong storms.
Nevertheless, presented version of the Δ-monitoring may be considered, in our opinion, as a demonstration prototype is of practical interest for scientists, developers of environmental monitoring systems22 and employees of environmental agencies of the region.
In developing the industrial versions of system for specific Contract Areas may be used recommendations10,11,13 and extensive information base, available in on-line library of the Caspian Environment Programme.23
Presented system is one example of the potential opportunities of knowledge-based approach and the knowledge-based tools for monitoring engineering. Such tools offer new opportunities for adequate environmental monitoring of offshore operations in difficult conditions of theCaspian Sea. The introduction of such tools is extremely necessary due to the growing scale of oil extracting and tense geopolitical situation prevailing in the region after the collapse of the Soviet Union.
References
-
Offshore Environmental Monitoring for the Oil and Gas Industry. International Association of Oil and Gas Producers. Report, â„– 457 (2012), http://www.ogp.org.uk/pubs/457.pdf.
-
Karpyuk M.I., Katunin D.N. Proc. of the 1st Intern. Conf. “Problems of the Caspian Ecosystem Conservation under Conditions of Oil and Gas Fields Development. 93-98 (2005) (in Russian).
-
Karayev R.A. Proc. of the 1st Intern. Conf. "Problems of the Caspian ecosystem conservation under oil and gas development", 88-93 (2005) (in Russian).
-
Levell D. Pilot Environmental Survey of the Chirag Oil field. A report produced for BP by the Field Studies Research Centre, 97-121 (1993).
-
Karayev R.A. Oil industry, 5: 65-68 (1999) (in Russian).
-
Karayev R.A. et al. Interdisciplinary Environmental Review, 5(1): 18–29 (2003).
-
Diarov M.D., Gilazhov E.G., and Yergaliyev T.Zh. Proc. of the 1st Intern. Conf. “Problems of the Caspian Ecosystem Conservation under Conditions of Oil and Gas Fields Development. 76-80 (2005) (in Russian).
-
Framework Convention for the Protection of the Marine Environment of the Caspian Sea (Teheran Convention) (2003) http://www.tehranconvention.org/spip.php?article1
-
Minton R. Ocean Industry, 8: 46-51 (1991).
-
Program of industrial environmental monitoring oil company "Lukoil" in the Northern part of the Caspian Sea(2012), http://www.caspianmonitoring.ru/mono/mono1/pril.pdf.
-
Rules of organization and environmental monitoring during oil operations in the Kazakh sector of the Caspian Sea. 523 (2012) http://normativ.kz/view/40947/.
-
JAMP Guidelines for Monitoring Contaminants in Biota.OsloandParisCommissions Joint Assessment and Monitoring Programme (1997).
-
Review of the ecological monitoring of Kravtsovskoe (D_6) offshore oilfield. ООО Lukoil. (2004-2008), http://www.lukoil.ru/materials/doc/ecology/eko_lukoil_2012web.pdf .
-
Begon M., Harper J.L., and Townsend C.R., Ecology: Individuals, Populations, and Communities, 3rd edition. Blackwell Science Ltd.,Cambridge,MA, 547 (1996).
-
Pesenko Y.A. Principles and methods of quantitative analysis of faunal studies,Moscow: Nauka, 369 (1982) (in Russian).
-
Olsgard F., and Gray J. S. Marine Ecology Progress Series, 122: 277–306 (1995).
-
Toldo Jr. E., and Ayup-ZouainR.N.DeepSeaResearch, 56: 1–3 (2009).
-
HELCOM Recommendation 18/2 “On the Sea Bottom Exploitation and Utilization”, http://helcom.fi/Recommendations/Rec%2018-2.pdf.
-
Magurran, A. E. Ecological Diversity and its Measurement.PrincetonUniversityPress,Princeton,N.J., 543 (1988).
-
Rosenzweig, M. L. Species Diversity in Space and Time.CambridgeUniversityPress,New York, 375 (1995).
-
Waterman D.A. Guide on Expert Systems,Addison-Wesley,New York, 437 (1986).
-
Petrechenkova V., Ostrovskaya E. Organization of environmental monitoring in theCaspian Seaat national and international levels. UNESCO-IHE Institute for Water Education,Netherlands(2012) http://www.inweb.gr/twm4/abs/PETRECHENKOVA%20Valeria.pdf.
-
Sources of Caspian environmental information. Caspian SeaEnvironment doc. http://www.caspianenvironment.org/newsite/DocCenter/BIODIVERSITY%20INFORMATION%20SYSTEM%20and%20MONITORING%20PROGRAMME/Sources%20of%20Caspian%20environmental%20information_(v.4).doc


