Primary Inventorization of Electronic Waste in Bhopal City
P P. S. Chandel1 * , S. Sarsaiya2 , S. Gautam2 , G. Singh Mandloi2 , V. Nigam2 and R. Gour 2
1
School of Environmental Biology,
A.P.S. University,
Rewa,
Madhya Pradesh
India
2
International Institute of Waste Management (IIWM),
Bhopal,
Madhya Pradesh
India
http://dx.doi.org/10.12944/CWE.9.3.31
Copy the following to cite this article:
Chandel P. P. S, Sarsaiya S, Gautam S, Mandloi G. S, Nigam V, Gour R. Primary Inventorization of Electronic Waste in Bhopal City. Curr World Environ 2014;9 (3) DOI:http://dx.doi.org/10.12944/CWE.9.3.31
Copy the following to cite this URL:
Chandel P. P. S, Sarsaiya S, Gautam S, Mandloi G. S, Nigam V, Gour R. Primary Inventorization of Electronic Waste in Bhopal City. Curr World Environ 2014;9(3). Available from: http://www.cwejournal.org/?p=6837
Download article (pdf) Citation Manager Publish History
The largest and fastest growing manufacturing industry is the “electronic industry” due to the tremendous growth in the field of information technology all over the world. All electronic and electrical items such as computers, televisions, mobile phones etc. on completion of their useful life, are being discarded rapidly and contribute to the huge quantum of e-waste(Robinson, 2009). The generation of this e-wastehas grown manifold in the last two decades and would continue to accelerate at a fast pace. As the fastest growing component of municipal waste across the world, it is estimated that more than 50 million ton(MT) of e-waste is generated globally every year. In other words, these would fill enough containers on a train to go round the world once (Schwarzer et al., 2005). A report of the United Nations predicted that by 2020, e-waste from old computers would jump by 400 per cent on 2007 levels in China and by 500 per cent in India. China already produces about 2.3 million tons of e-waste domestically, second only to the U.S. with about three million tons (Young, 2010).
In India, E-waste is one of the fastest growing waste streams due to increasing “market penetration” in developing countries, “replacement market” in developed countries and “high obsolescence rate”. It contains more than a 1000 different substances, which fall under “hazardous” and “non-hazardous” categories (Wath et al, 2010; WHO, 2010). Broadly, it consists of ferrous and non-ferrous metals, plastics, glass, wood and plywood, circuit boards, concrete and ceramics, rubber and other items. Iron and steel constitutes about 50% of the e-waste followed by plastics (21%), non ferrous metals (13%) and other constituents 16%. Non-ferrous metals consist of metals like copper, aluminum and precious metals like silver, gold, platinum, palladium etc. The presence of elements like lead, mercury, arsenic, cadmium, selenium, and hexavalent chromium and flame retardants beyond threshold quantities in e-waste classifies them as hazardous waste (Widmer et al., 2005; Aizawa et al., 2008).
In India, there are 10 States that contribute to 70 per cent of the total e-waste generated, while 65 cities generate more than 60 per cent of the total e-waste. Among the 10 largest e-waste generating states, Maharashtra ranks first followed by Tamil Nadu, Andhra Pradesh, Uttar Pradesh, West Bengal, Delhi, Karnataka, Gujarat, Madhya Pradesh and Punjab. Among the top ten cities generating e-waste, Mumbai ranks first followed by Delhi, Bengaluru, Chennai, Kolkata, Ahmedabad, Hyderabad, Pune, Surat and Nagpur.
The disposal of e-waste is a particular problem faced in many regions across the globe. The useful life of consumer electronic products is relatively short, and decreasing as a result of rapid changes in equipment features and capabilities (Kang and Schoenung, 2004). Environment and human health is affected by e-waste. E-waste takes up space in the communities it invades and can be very harmful to humans and animals. It is of concern mainly due to the toxicity and carcinogenicity of some of the substances if processed improperly. In view of the ill-effects of hazardous substances of electronic waste to both environment and health, several countries exhorted the need for a global agreement to address the problems and challenges posed by hazardous waste. However, the policy level initiatives regarding E-waste in India is quite rudimentary and needs immediate attention. As there is no separate collection of e-waste in India, there is no clear data and information on the quantity generated and disposed of each year and the resulting extent of environmental risk. The present study was mainly focused on the inventorization of E-waste namely televisions, personal computers, mobile phones, refrigerators, air conditioners, washing machines from two main group viz., households and business entities & institutions and also determine present status of E-waste based on source of generation for future action plans.
Materials and Methods
Site Selection
The study of e-waste Inventorization was conducted in Bhopal city which is one of the biggest city of central India. The household and business entities, institutions are the consumers of electrical and electronic equipment and also the e-waste generators. Hence they were targeted in this study (Fig. 1). The selection of the survey location was based on the population density and also the socioeconomic status of the areas.
Field Studies and Data Collection
Field data were collected through questionnaire-based survey and give better result than mail surveys. Information on knowledge level, attitude and practice on use and electrical electronic equipment (EEE) disposal was collected using questionnaires, provided by International Institute of Waste Management (IIWM), Bhopal. The study was covered following categories of electronic waste such as televisions, personal computers, mobile phones, refrigerators, air conditioners, washing machines for estimations and quantifications of e-waste produced. There were two main target respondents included in the survey. Thesewerehouseholds and business entities & institutions. In order to ensure a higher response rate, face to face interviews were appropriate for data collection. The distribution of the e-waste survey questionnaires were started on the 1st Feb 2014 and ended on the 30th of April 2014. A total of 150 sets of questionnaires were collected through site visit interviews. Of these, 70 questionnaires were collected from household respondents, and 80 to business entities and institutions respondents.
Results
The Generation of e-waste from Bhopal city was analyzed by collected the information on generation of e-waste by direct interview from following two sectors. These are:
Generation of electronic waste from households
To collect the information on generation of e-waste from households by television, computers, mobile phones, refrigerators, air conditioners, washing machines, waste batteries etc., total 85 houses were approached out of which 70 household responded. To date, in these 70 houses 72 televisions, 40 personal computers, 150 mobile phones, 48 refrigerators, 30 air conditioners, and 35 washing machines are using.
Out of 11 televisions, 7 computers, 63 mobile phones, 3 refrigerators, 2 air conditioners and 4 washing machines were discarded in last five year. In most of the houses, television, computers, mobile phones, refrigerators, air conditioners, washing machines are in good condition, however if any trouble arises, they get it repaired either from service centers or a person from service centers visits and rectify the items. In few cases these electrical and electronic equipment have repair needs then they repaired or stored in houses or donated to other family members or are being replaced. The total population of Bhopal is 23,68,145 and the total household in Bhopal is around 287170. The average weight of electronic waste from single household was estimated to be 2.86 kg.Hence, the total e-waste from total household of Bhopal is around822126.6 kg/year. The details are shown in Fig. 2-9.
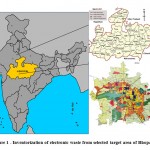 |
Figure 1: Inventorization of electronic waste from selected target area of Bhopal city Click here to View Figure |
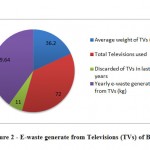 |
Figure 2: E-waste generate from Televisions (TVs) of Bhopal Click here to View Figure |
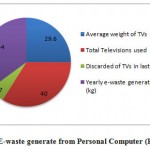 |
Figure 3: E-waste generate from Personal Computer (PCs) of Bhopal Click here to View Figure |
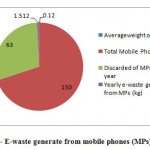 |
Figure 4: E-waste generate from mobile phones (MPs) of Bhopal Click here to View Figure |
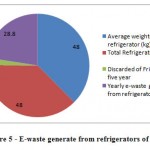 |
Figure 5: E-waste generate from refrigerators of Bhopal Click here to View Figure |
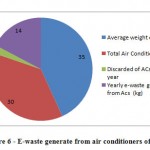 |
Figure 6: E-waste generate from air conditioners of Bhopal Click here to View Figure |
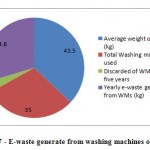 |
Figure 7: E-waste generate from washing machines of Bhopal Click here to View Figure |
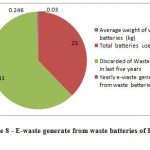 |
Figure 8: E-waste generate from waste batteries of Bhopal Click here to View Figure |
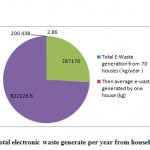 |
Figure 9: Total electronic waste generate per year from household of Bhopal Click here to View Figure |
Generation of electronic waste from Business entities and institutions
To collect the information on generation of e-waste from Business entities and institutions by television, computers, mobile phones, refrigerators, air conditioners, washing machines, waste batteries etc. In business entities include government and non government offices, banks, restaurant, hotels, and hospitals while in institutions included schools, colleges and universities etc. Total 100 unit (Business entities and institutions) were approached out of which 80 unit responded. To date, in these 80 Business entities and institutions, 5375 televisions, 3155 computers, 565 mobile phones, 1170 refrigerators, 1301 air conditioners, and 443 washing machines were in used. Business entities include government and non government offices, and institutions included colleges and universities etc. The e-waste generates from single business entities and institutions was 42.9 kg/year. Here we assumed that about ~3000 business entities are available in Bhopal. Hence, we calculated average weight of 3000 business entities was 128853.7 kg/year.The details are given below in Fig. 10-17.
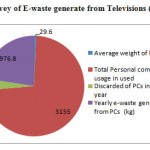 |
Figure 10: Survey of E-waste generate from Televisions (TVs) of Bhopal Click here to View Figure |
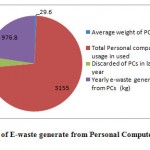 |
Figure 11: Survey of E-waste generate from Personal Computer (PCs) of Bhopal Click here to View Figure |
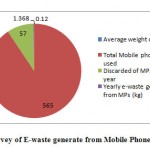 |
Figure 12: Survey of E-waste generate from Mobile Phone (MPs) of Bhopal Click here to View Figure |
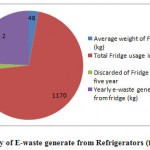 |
Figure 13: Survey of E-waste generate from Refrigerators (fridge) of Bhopal Click here to View Figure |
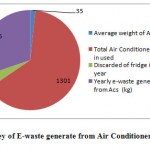 |
Figure 14: Survey of E-waste generate from Air Conditioners (ACs) of Bhopal Click here to View Figure |
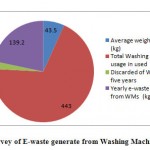 |
Figure 15: Survey of E-waste generate from Washing Machine (WMs) of Bhopal Click here to View Figure |
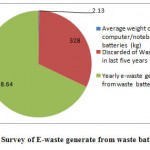 |
Figure 16: Survey of E-waste generate from waste batteries of Bhopal Click here to View Figure |
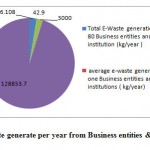 |
Figure 17: Total e-waste generate per year from Business entities & institutions of Bhopal Click here to View Figure |
Assessment of e-waste generation in Bhopal
Total e-waste generated by households in Bhopal: 822126.6 kg/year Total e-waste generated business entities and institutions in Bhopal: 128853.7 kg/year Total amount of e-waste generation annually in Bhopal: 950980.3 kg/year or 950.9 MT/Year
Discussion
The rapid growth and faster change in modules of electrical and electronic equipment are major issue that enhances the amount of e-waste generation. The hazardous nature of e-waste is one of the rapidly growing environment problems of the world and increasing amount of e-waste associated with the lack of awareness, appropriate management skills. At present, solid waste management is a mammoth task in India become more complicated by the invasion of e - waste. At present, Bhopal is a one of the fastest economic growing city and education hub of central India. Mass population of city spends their money in purchasing of different type electrical and electronic items for entertainment and to maintain their status symbol. The primary data which collect from interviews with various economic classes of households, and various categories of business entities and institution suggests that the generation of e-waste in Bhopal city is going to increased day by day, due to high obsolescence rates. The total electronic waste generated from Bhopal is 950 MT/year. The amount generated e-waste in Bhopal is 950980.3 kg/year. This figure increased many fold in coming years. Hence, in coming years it urgently required to setup an e-waste collection and treatment plant in Bhopal region for proper management of e-waste. Otherwise, like other metropolitan cities of India Bhopal will be face serious problem of e-waste. According to M.P. Pollution Control Board survey report, Bhopal was estimated to generatearound 415 MT of electronic waste in 2012.A survey was carried out by the Central Pollution Control Board during 2005. It was estimated that 1.347 lakh MT of e waste was generated in the country in the year 2005, which is expected to increase to about 8 lakh MT by 2012 (Singh, 2013).
Acknowledgement
The authors are thankful to International Institute of Waste Management (IIWM), Bhopal for infrastructure facilities. M.P. Council of Science & Technology, Bhopal is also thankfully acknowledged for their support.
References
- Robinson B.H. E-waste: An assessment of global production and environmental impacts. Sci. of the Total Environ. 408:183-191 (2009).
- Schwarzer S., and BonoA.D.E-waste, the hidden side of IT equipment's manufacturing and use, Environment Alert Bulletin.5 (2005).
- Young T. E-waste a growing problem for China and India, 22 February (2010). .
- Wath S. et al. A roadmap for development of sustainable E-waste management system in India. Sci. Total Environ. 409:19-32 (2010).
- WHO. Report On Inventorization of E-Waste in Two Cities in Andhra Pradesh And Karnataka (Hyderabad And Bangalore). Prepared by Environment Protection Training and Research Institute, Gachibowli, Hyderabad, Andhra Pradesh, India (2010).
- Widmer R., Heidi Oswald-Krapf , Deepali Sinha-Khetriwal, Max Schnellmann, Heinz Boni, Global perspectives on e-waste, Environmental Impact Assessment Review. 25: 436– 458 (2005).
- Aizawa H., Yoshida H., Sakai S. Current results and future perspectives for Japanese recycling of home electrical appliances. Resource, Conserv. Recycling 52(12):1399-1410 (2008).
- Kang H.Y., Schoenung J.M. Used consumer electronics: a comparative analysis of material recycling technologies, in: 2004 IEEE International Symposium on Electronics and the Environment. Phoenix, AZ, May 10-13 (2004).
- Singh R.P. India: A Matter of Electronic Waste; the Government Initiatives. Journal of Business Management & Social Sciences Research. 2(4): 15-20 (2013).


