The Health Costs of The Brick Kilns Emissions in Peshawar: A Policy Analysis.
Muhammad Rafiq1 * and Munir Khan1
http://dx.doi.org/10.12944/CWE.9.3.06
Air Pollution especially resulting from Brick kiln is a major Environmental problem of Pakistan in general and Peshawar in Particular. World Health Organization in a recent document has declared Peshawar as the sixth most polluted city of the world. We in our latest study have tried to estimate the health cost related to the release of PM10 from these kilns. For the said purpose, we collected primary data pertaining to pollution and socio-economic of the brick producing and nearby areas. We collected socio economic data from respondents living within 3 kilometer of the kilns and also from a control group which were further away. Sample size was set at two hundred households, i.e. one hundred households were taken from the kilns group and another100 samples from the control group. We have used health diary method to collect health information from the respondents. We have estimated two reduced form equations, i.e., health production function and demand for mitigation cost using Poisson and Tobit regression models. The PM10 level in the kilns region was very high it was at average level is 415ug/m3, and the control group the PM10 level is low it was 180 ug/m3. Our regression analysis estimated that by reducing PM10 to safe level, every individual can save PKR 3315 (or USD 31) per annum through only mitigation cost. Total welfare gain to reduce air quality to safe level through mitigation cot for district Peshawar is PKR 6692.985 million or (PKR 6.7 billion) per annum (USD 63.44 million). Besides, the productivity loss by individuals is estimated as .36 day per annum. The monetary benefit to avoid from the restricted day of working is PKR 198 for one household whereas for the city the monetary benefit of bringing down the PM10 level is PKR 107.935 million (or USD 1.023 million). The study is suggesting implementing of the ban on the use of rubber as a fuel in these bricks kiln. The study also recommends that these kiln owners be punished/ taxed as per section 17 of the 1997 Environmental act.
Copy the following to cite this article:
Rafiq M, Khan M. The Health Costs of The Brick Kilns Emissions in Peshawar: A Policy Analysis. Curr World Environ 2014;9 (3) DOI:http://dx.doi.org/10.12944/CWE.9.3.06
Copy the following to cite this URL:
Rafiq M, Khan M. The Health Costs of The Brick Kilns Emissions in Peshawar: A Policy Analysis. Curr World Environ 2014;9(3). Available from: http://www.cwejournal.org/?p=7052
Download article (pdf) Citation Manager Publish History
Introduction
The disastrous health effects of air pollution are well documented now in the epidemiological literature. High levels of ambient air pollution have been linked with diseases such as asthma, headache, blood pressure, cancer, heart diseases, bronchitis etc. This is an externality which inflicts a heavy monetary loss to the individual in term of increased health cost and a loss of productivity. Besides, it has direct bearing on the public exchequer in term of increased public sector spending. The ambient air quality in many cities in Pakistan is well above the national standards. World Health Organization in its recent publication has included Peshawar1 and Quetta amongst the top ten most polluted cities across the globe.2
The reasons for rising air pollution levels particularly in Peshawar are many; however, the focus of the present study is on the use of rubber in the production of brick. The kiln industry is as old as that of the Indus Valley Civilization (2500-1500 BC). Fired bricks were also used by the ancient people of the civilizations of Egypt and Mesopotamia for building tombs and temples. Although the design, shape and weight of bricks have undergone numerous historical changes, the production technology has experienced very limited changes’ (Javid, 2006)
|
|
Annexure 1: Rectangle in map of the kiln group area |

Pakistan is the third largest country in the world in the brick production. China, India, Pakistan and Bangladesh produce 75% of the global production of bricks (Baum 2007). It is the main source of ambient air pollution. In Bangladesh 38% air is polluted by brick kilns.3
|
|
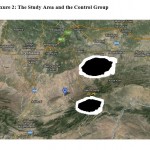
Annexure 2: The Study Area and the Control Group |
There are 450 brick kilns in and around Peshawar. One brick kiln produces 7500 bricks per day. In these kilns coal, rubber and wood are used. Fuel oil is used at the starting time. Every kiln consumes 90 to 180 tons of coal, 10 to 15 tons of wood and 4 to 6 tons of rubber per month. (Sardar ,2000).
However, rubber is banned as a fuel throughout the country in the kilns under section 17 of the environmental protection act 1997. However, the inabilities of the regulators and enforcers, and governance issues have resulted in reduced social welfare in terms of increased health costs.
Therefore, present study is the economic analysis of a public policy failure. We are providing the economic value of kiln emissions, in particular the non-implementation of emission standards set for the health benefit of people living in Peshawar, North Western Pakistan.
The State of Environmental regulations in the Province
Pakistan, Environmental Protection Agency KP is responsible for the regulation and implementation of the Environmental laws in the province. These regulations are outlined in the Environmental Protection act 1997. This act was passed on 6th December, 1997. It has certain rules and regulations about noise pollution, air pollution and water pollution. But, the Section 14, section 13 and section 11 are air pollution related clauses. Section 17 pronounces the fine for the offenders.
Section 14, EPA act 1997:
“Where the federal and provincial is satisfied that the discharge or emission of any effluent water, air and noise pollution or the disposal of waste or handling the hazardous substance or any other substance is likely to occur or occurring or has accrued in violation of this act.”
Section 13, EPA act 1997:
“The Pakistan Environmental Protection Act, 1997 requires that no person may import hazardous substances of which chemical activity is toxic, explosive, flammable, corrosive, radioactive, causes directly or in combination with other matters, an adverse environmental effect.”
Section11, EPA act, 1997:
“No person shall discharge and omit or allow the discharge or emission of any effluent or waste or air pollution or noise in amount, concentration or level which is in excess of the national environmental quality standard”
Section 17, EPA, 1997:
This section is about the penalties which are imposed on the offenders of sections 11, 13 and 14 of environmental protection act 1997.
“The maximum penalties under section 17 are one million PKR and the additional 100,000 PKR4 continue to be charged when the offence is continuing under section 11 and 13. This section does not specify a minimum penalty, so it is understood that magistrate enjoys discretion in sentencing.” (Fuzia 2012)
“The maximum penalty under section 17 is 100, 00, additional penalty is 1000 per day for continuing violation. This applies to offence related to the handling, under section 14, of the environmental protection act 1997.”(Fuzia 2012)
However, according to the brick kilns owner the fine amount is just 5000 PKR for the violation. Though, the magistrate enjoys full freedom in imposing fine for the violation, but the governance mechanism, political pressure, graft and many other reasons are inflicting a very heavy external cost on the society. Therefore, this study is an effort to value this health cost for the residents of Peshawar as a result of this policy failure.
Theoretical Framework
Given the objectives of our study, we have employed the Health Production Function.This is a variant of Household Production Function (HPF). The theory eventually leads to work day lost function (WDL) and demand for mitigation cost[1] function, in order to estimate the health benefit of reduced air pollution. Health production function and demand for mitigation cost is in implicit in the utility function. Usha (2006), Chowdery et al (2010), Naveen (2012) and Hearth (2012) have used the same theoretical lens.
The utility function is
U=U(X,L,H,Q) ……..(1)
Where, X shows the consumption of marketed goods, L represents the leisure time available to an individual, H represent work day lost (WDL) due to ambient air pollution, Q stands for the level of ambient air pollution. The individuals gain utility from X and L while disutility from H and Q.
An individual can gain safe health by combining mitigation activities with the given level of air pollution (Q) given his health status and other socio-economic characteristics. The health production function is given below.
H= (M, Q, A, Z) ……. (2)
Where, H is the production function or Work Days Lost, M is the demand for mitigation activities, A show the activity that consist number of days an individual’s stays indoor to avoid polluted region ,Q represents the ambient air pollution, and Z is the vector of individual’s characteristics just like income, Sex, Age etc.
The above model shows that the individuals maintain his health status in polluted ambient air through mitigation cost.
The individual faces the following budgetary limitations.
I=Y+W (T-L-H) =X+PmΜ+PaΑ ……. (3)
Where, Y is non-wage income, W is wage rate, (T-L-H) is the time spent at work (T is total time) Pm and Pa is the prices per unit of mitigation cost and work day lost.
The (Q) which is the ambient air pollution, prices of mitigation activities (Pm ), wage rate is (W), income (I) and other endogenous variables, the individuals maximize (I) with respect to X,M.A and L with budget constraint. Solving the following problem,
Μax G=∪=∪(X,L,H,Q)+λ[Y+W(T-L-H)-X-Pa-Pm] ..……(4)
Where, ÊŽ is the langrage multiplier.
This gives us marginal willingness to pay (MWTP), demand function for mitigation and aversion, plus WDL function or health production function.
M=M (W Pm, Pa, H, Q, X, Z) ……. (5)
A=A (W,Pm,Pa,HQ,XZ) ……..(6)
MWTP=W.dh⁄dq+Pm.dm⁄dq+Pa .dm/dq+(UH⁄λ).dh⁄dq .…….(7)
Equation (7) represents the Marginal Willingness to Pay (MWTP) or the health benefit from the decreased air pollution. This is the sum of observable reduction in the cost of illness, mitigation cost and monetary benefit of disutility of illness. The estimation of MWTP require the estimation of health production function and mitigation cost function simultaneously.
The monetary gain from the reduction in ambient air pollution is captured by first three equations. The averting activities are difficult to measure accurately, the general practice to consider the lower bound estimate is called cost of illness.
COI=W,dh⁄dq+Pm.dm⁄dq …….(8)
The above model represents the health benefits from reduce air pollution, in other words opportunity cost and mitigation cost.
Description of the Study Site
Peshawar derives its name from a Sanskrit word ‘Pushpapura’, meaning the city of flowers. Peshawar lies between 33° 44′ and 34° 15′ north latitude and 71° 22′ and 71° 42′ east longitude. The total area of this district is 1,257 square km. According to 1998 census, the total population of Peshawar is 2.019 million. Peshawar is one of the biggest markets for brick kilns. (Ahmad et al 2012). 450 registered brick kilns are operational in Peshawar.8 We, for the sake of our study have considered two regions of the district; the kilns area and the control area (without kilns). The kiln industry omits pollution from its basements and also omits through the 15 meter high chimney. Within the 3 kilometer of kilns the air quality is very bad, if we extrapolate our result to the entire city on the basis of 3 KM radius, then our estimation will be exaggerated. The control group is away from the kilns. Considering this important fact, we have decided to use the average of the two regions as total willingness to pay. Nonetheless, due to time and financial constraints, we did n’t take the to talk iln’s area as the study group.
Sampling and Data Collection
The study area is Baghbanan; kilns market whereas, the control group is Janakor.7 For this purpose we demarcated the kiln area using the Google map. There is a very high concentration of air pollutants within the three kilometer radius of kilns.Hence, we decided to consider this three kilometer radius area as the study area. We decided to collect household level data by setting the sample size to be around 200 households from both the group, which is ten percent of the local population. We required data on two major accounts; pollution and climate data, moreover the household level data on health status, income, air pollution related sickness, medical expenses etc. It is important to mention here that by household data, we mean all the information related to the members of the family. Therefore our numbers of observation are approximately twenty six hundred for the two rounds of the survey.
There are no monitoring stations inside Peshawar, so we had to request a government lab; Pakistan Council of Scientific & Industrial research (PCSIR) to provide us the pollutants’ data.8
We then collected the house hold level information pertaining to socio-economic factors, and medical costs. There were two rounds of data collection. Both the rounds were during cool season (mostly dry season). The first round was from first of November, 2013 till the fifteen8 See the map in annexure1-29 Part of the rural and urban areas of Peshawar, See the map10 They collected us the data on the day we started the survey. It was collected at two locations, and then they approximated the data using wind speed, rain etc. (Kilns group area and control group area). of December, whereas the second round was for next fifteen days. We did this to overcome any sort of biases in extrapolation.
During the first round we collect Socio-Economic Characteristics and Health Diary. Health diary consists of mitigation cost and work days lost. For the second round the Mitigation and work day lost data was collected.
Variables to be measured
For the purpose of estimation of Health Production Function, we have considered the following endogenous and exogenous variables.
Particulate Matter (PM10)
This is the main explanatory variable. We have four values for this variable that is, two values for the study area and two values for the controlled place.We had the data about other pollutants such as NOX, SOX, but PM10 is considered the most dangerous pollutant, and the contribution of the kilns industry to PM10 is almost sixty percent.
Sex
This variable refers to gender of the individual and is equal to 1 for male and 0 for female and otherwise.
Age
This is the age of the individual members of the sampled household. Aging increases the chances of falling illness.
Age 2
This is the square of age to capture the non-linearity between age and illness.
SMK
This is dummy variable which is equal to 1 for smoking and 0 otherwise. It is assume that smokers are more likely to fall illness.
EDU
This is a dummy variable referring 1 as literate and 0 as illiterate individuals. It is expected that educated peoples are more aware of ambient air pollution than uneducated.
SH
This variable show the structure of the house. If you are living in a muddy house, the chance of illness are high as compared to the cemented houses.
INC
This refers to the monthly income of the individual. People with high income want to live a better life and want to safe from the environmental problems.
OCP
This variable is for occupation, those who are working are more probable to get ill then those who do not.
The difference in Temperature (DTEMP)
It is the difference of the values of daily maximum temperatures in last 15days. The temperature is in Fahrenheit scale its swings cause’s acute illness.
Estimation of the WDL function
Estimation technique depends upon the nature of the data.The data was collected in December for one month and for two consecutive rounds. The salient feature of the data is that it is a count data; (1) the dependent variable is the count number of the work day loss in the last fifteen days. (2) Second feature is that we have repeated observations of the same individual. Therefore, it is a Panel Data.11 We have used Poisson and negative binomial regressions12 for our panel data. Estimation of Poisson regression is below.
probYit=(yit/xit)=Uite^(-u it/yit)
where,
yit=1.2.3.4 …. (9)
For the linearity log is taken.
Lnuit= αi+β x1 it +β2 x2it……..+βs xsit α+b2 x2it+b3 x3it+⋯.bs xsit ......(10)
However, it is noted that the practice of Poisson regression is restricted in many way. Firstly, it is based on the assumption that the events occurs independently over time. The independence assumption may break down, as there is dynamic dependency between successive occurrences. Let suppose the prior occurrence of an events such work days lost due to air pollution may increase the probability of the subsequent events. Nevertheless, the above is the reduce form of health production function or WDL function.
Estimation of mitigation cost function:
For the purpose of estimating the medical cost, we have employed the Tobit regression for our data. This is because for several observations the medical expenses are zero, given this problem, the least square estimates are not appropriate. Moreover, conditional density to explain the conditional distribution of the medical cost is inconsistent with the fact that the data on mitigation expenditure contains several zeros. Therefore, the Tobit model is the best choice.
Mit=α+βxit+u if the RHS >O
0, Otherwise
Where, Mit is the probability of the ith household having positive mitigation at time T and Xit show the vector of individual’s characteristics such as income education ,weather condition etc.
Econometric Specification
Empirically we have estimated the following two reduced form equations which are the household health production function or WDL function and demand function for mitigating activities. Random effects panel data regression model is used to estimate these equations.
H=α_0+_1 PM10+β_(2 ) sex+β_(3 ) age+ β_4 age2+β_(5 ) smk+β_(6 ) edu+β_(7 ) sh+β_8 inc+β_9 ocp+β_10 detem+v
……(11)
〖M=α〗_0+β_1 PM10+β_(2 ) sex+β_(3 ) age+ β_4 age2+β_(5 ) smk+β_(6 ) edu+β_(7 ) sh+β_8 inc+β_9 ocp+β_10 detem+v
…….(12)
The dependent variable used in the equation (11) is Work Lost Days (WDL). WDL represents the number of workdays lost per person in the last fifteen day due air borne diseases.
Mitigating Activities (M): Mitigating activities (M) include expenses incurred as a result of air pollution related diseases. These expenditures consists costs of medicines, doctor’s fees, diagnostic tests, hospital cost, travel to doctor’s clinic, etc., per person, per year. The independent variables that affect the health production function and mitigating have been explained in the variable to be measured section.
Results and Discussion
Table 1shows the descriptive statistics of the selected variables. Total mitigation cost ranges between 0 PKR to 21400 PKR for the thirty days. Whereas, the average medicines cost is 84 per month. The opportunity cost or work days lost is average 10 days in a month. This is especially true about the kiln group where were severely affected by the ambient air quality. Particulate matters concentration for 24 hours is very high amongst the kilns group which is around 430 per ug/m.3 But the average level turns out to be337 ug/m.3 42 percentof the household are female and remaining are male. The maximum age is 87 years and the minimum age is six months. Twenty percent are smokers. Only 36 percent are Educated. We remind here that that the literacy rate includes the informal education, religious education, and all those who can read and write are termed literate. 78 percent are living in muddy and stones houses. The average income per day is 137 PKR. In these twoareas, on the average 27 percent individuals have jobs.
|
Descriptive Statistics |
||||||
|
Variables |
Total number of sample is 200, both control |
Observation |
Minimum |
Maximum |
Mean |
Std. Deviation |
|
TC |
Total mitigation cost |
2654 |
0 |
21400 |
84.18 |
639.465 |
|
WDL |
Work day lost in |
2654 |
0 |
15 |
10 |
.729 |
|
PM10 |
Particulate matter |
2654 |
175 |
430 |
335.55 |
115.309 |
|
SEX |
Sex dummy (1 if male) |
2654 |
0 |
1 |
.58 |
.493 |
|
AGE |
Age of the respondent in years |
2654 |
.5 |
87.0 |
23.880 |
17.5384 |
|
SOMK |
Smoke dummy |
2654 |
0 |
1 |
.02 |
.139 |
|
EDU |
Education dummy |
2654 |
0 |
1 |
.36 |
.481 |
|
SH |
house structure dummy (1 if cement, o for |
2654 |
0 |
1 |
.22 |
.416 |
|
DETEM |
Difference in temperature in month |
2654 |
1 |
4.5 |
2.750 |
1.7503 |
|
INC |
Income of the individuals |
2654 |
0 |
2000 |
137.88 |
260.974 |
|
OCP |
Occupation of the individuals |
2654 |
0 |
1 |
.27 |
.442 |
We present the estimation results of WDL function in Table 2, and the results of mitigation cost in Table 3.
Table 2: Random effect Poisson& Negative Binomial regression; HPF
|
Dependent Variable (WDL) |
Random effect Poisson regression |
Negative binomial regression |
||
|
Independent Variables |
Coefficient |
Std error, Z value |
coefficient |
Std error, Z value |
|
Const |
-24.24958 |
436.8663(-0.06) |
-25.22716 |
506.3448(-0.05) |
|
Pm10 |
.0241445 |
.0054019 (4.47)*** |
.0301418 |
.0147601(2.04)*** |
|
Sex |
.0138719 |
.157427(0.09) |
-.0377626 |
.4567414(-0.08) |
|
Age |
-.0180569 |
0.0134138(-1.15) |
-.0332301 |
.0459012(-0.72) |
|
Age2 |
.0001419 |
.0002021(0.70) |
.0004642 |
.0006859 (0.68) |
|
Smok |
-1.122815 |
.6405482(-1.75)** |
-1.08322 |
1.505402 (-0.72) |
|
Edu |
-.3245261 |
.1740632(-1.86) |
-.2229335 |
.4919602(-0.45) |
|
Sh |
-.7020858 |
.208864 (-3.36) *** |
-.8010949 |
.5291312(-1.51)** |
|
Detem |
2.756106 |
97.08206(0.03) |
2.432666 |
112.525(0.02) |
|
Inc |
.0003052 |
.0004058(0.75) |
.0005248 |
.0016218(0.32) |
|
Ocp |
.5328491 |
.2795423(1.91)* |
.4823015 |
1.002546(0.48) |
|
Log likelihood |
-976.58019 |
-443.73553 |
|
|
|
Wald chi |
290.57 |
65.88 |
|
|
|
Number of observation |
2654 |
2654 |
|
|
Table 3: Random effect Tobit & OLS Models
|
Dependent Variable TC |
Random effect Tobit regression |
OLS Regression |
||
|
Independent variable |
Coefficient |
Std error, |
Coefficient |
Std error, Z value |
|
Const |
-12739.59 |
1387.54 (-9.18)*** |
-204.15 |
68.089 (-2.99) *** |
|
Pm10 |
11.63774 |
2.3388 (4.98) *** |
0.484029 |
0.127684 (3.79) *** |
|
Sex |
305.8156 |
436.5671 (0.70) |
9.54124 |
30.1308 (0.3167) |
|
Age |
47.75747 |
34.46357 (1.39) |
4.36004 |
2.65502 (1.6422) |
|
Age2 |
-.3441562 |
.4916382 (-0.70) |
-0.03716 |
-0.03716 (-0.939) |
|
Smok |
2032.644 |
836.04 (2.40) *** |
376.804 |
90.729 (4.1531) *** |
|
Edu |
-649.1251 |
442.9315 (-1.47) |
-21.7472 |
29.878 (-0.7279) |
|
Sh |
-982.4096 |
526.3213 (-1.87)* |
-54.2538 |
30.0065 (-1.8081) * |
|
Detem |
324.9071 |
97.82931 (3.32) *** |
20.5258 |
7.04391 (2.9140) *** |
|
Inc |
1.046852 |
1.08826 (0.96) |
0.0101521 |
0.0980096 (0.1036) |
|
Ocp |
747.5034 |
737.5879 (1.01) |
13.4332 |
60.5571 (0.2218) |
|
Sigma (u) |
1086.75 |
281.634 |
R square |
0.024164 |
|
Sigma (e) |
3767.561 |
262.0015 |
|
|
|
Rho |
.076812 |
.0370275 |
|
|
|
Log likelihood |
-1742.2605 |
|
-20879.42 |
|
|
Wald chi 2 |
74.32 |
|
|
|
|
Number of observation |
2654 total observation. |
2654 total observation. |
||
|
***, ** and * indicate significance at 1%, 5% and 10% levels |
||||
Health Production Function or WDL Function
In the WDL model, the dependent variable is all those days which are lost due to air pollution. Health production function is estimated through Poisson and Negative Binomial Regressions. There are 2654 observations from 200 households.
Poisson Regression Model
In Poisson regression model PM10 and DTEMP are statistically significant. However, the sign of the three variables have changed and do not make sense. Sex has positive coefficient, it means that female are more affected than male. SH and EDU have negative coefficients, it means if the structure is cemented, the chances of illness are low, and when education increases then WDL are decreased. DTEMP, INCM and OCP have positive relation to health production function.
Negative Binomial Regression Model
In negative binomial regression model PM10, which is the main variable is statistically significant but the sign of four of our variables are unexpected.
Demand Function for Mitigation Cost:
It is also called mitigation cost function. In it, the mitigation cost is the dependent variable; the independent variables are the same variables which have been used in the WDL function. Demand for mitigation cost is estimated through Tobit and OLS regression models. Total observations are 2654.
Tobit Regression Results:
Tobit regression results are in table 3. Total cost of mitigation is a dependent variable. PM10, SMK, SH and DTEMP and structure of the house, SH are statistically significant. A one unit change in PM10 will results in 1.63 unit change in total mitigation cost. Signs of all variables as expected.
Welfare Gains of Reduced Air Pollution
The Welfare gain from reduced air pollution by just putting the current policy of non-use of rubber in the kilns in district Peshawar can be explained in terms of reduction in the work day lost (WDL) and reduction of mitigation cost, using estimated health production function and demand for mitigation cost to estimate health benefits in district Peshawar.
Reduction in the form of Lower Mitigation Cost (Medical Expenditure):
For calculating monetary benefits from reducing in the medical cost, we multiplied the coefficient of PM10 with the change in the PM10 level from present 335 µg/m3 to 120 µg/m3 and this multiplied with 2411 in order to annualize the welfare gains from a reduction in the medical expenses.
β*prob(MC>O) *∆pm10*24
The average level of PM10 is 335µg/m3 in both study areas. The standard level of MP10 is 120µg/m3 (WHO, Herat 2012). The difference in PM10 is 215µg/m3.
Applying the above formula for reduction in PM10 to safe level, every individual can save PKR 3315 (or USD 31) per annum through mitigation cost. This if extrapolated for district Peshawar, then the total welfare gain for district Peshawar12 is PKR 6692.985 million or (PKR 6.7 billion) per annum (SD 63.44 million).
Welfare Gains from Reduction in the Work Days Lost
We calculated the number of restricted days through Poisson regression model. To calculate the work days lost in PKR we calculate the average employment level in sample group and predicted value of Poisson regression. One unit increase in PM10 level can save 0.0000698 days per 15 days. The average working labor is 27% of sample data. Per day income of individuals in sample data is 550 PKR. This employment level can be extrapolated to the entire district of Peshawar. The following formula is Restricted day per annum: α * eΣ x *∆pm10* 24
Poisson regression estimates that marginal saving of 0.0000698 days per 15 days a unit reduction in PM10. Reduction in pollution level to the required safe level can save 0.36 day for an individual per annum. From the sample data, we know that the average wage rate of the working individual in the study area is PK RS 550. The estimated benefit by avoiding restricted day is PKR 198 per annum. In the sample data employment rate of individual is 27 %.we extrapolate it to the entire city, the estimated benefit is PKR 107.935 million (or USD 1.023 million).
There are various regional studies done on ambient air pollution to find out the health benefits of reduce air pollution to a safer level. Table 4 indicates the cross country comparison of the health benefits. This includes a 2006 study done in Kanpur, India, with a population of 3 million. The estimated health benefits are 213 million INR. The table is also reporting the welfare impacts for the city of Dhaka, Bangladesh which is 2.39 billion Taka in 2010. The population of Dhaka at the time of survey was 120 million. The study for Kathmandu (2012) demonstrates the benefits to be 6085 million Nepali Rupees. For Sri Lanka the amount is 2.96 million SLR. Our estimated results of 6.81 billion PKR are well within the range.
Table 4: Cross Country Comparison of the Estimated Health Benefits
|
Serial No |
Countries |
Cities |
Time Period |
Population of the Cities |
Welfare Benefit to Reduce Air Pollution to Safe Level. |
|
1 |
India |
Kanpur |
2008 |
3 million |
Rs 213 million. |
|
2 |
Bangladesh |
Dhaka |
2010 |
12.3 million |
Taka 2.39 billion or USD 34.09 million. |
|
3 |
Nepal |
Kathmandu |
2012 |
1.645 million |
NRS 6,085 million (USD 80.53 million) |
|
4 |
Sri Lanka |
3 km radius of cement industry in district Puttalam |
2012 |
0.004232 million |
SLR 2.96 million or (USD 29,600). |
|
5 |
Pakistan |
for whole Pakistan |
2006 |
132.352 million |
RS 62 billion to |
|
6 |
Pakistan |
Peshawar |
2014 |
2.019 million |
PKR 6.81 billion or |
Conclusions
The study finds that the ambient air pollution has a significantly negative impact on human health. It is concluded that the implementation of the governmental law regarding air pollution can significantly increase the Welfare gain in terms of low mitigation cost and reduced work days lost. Annual average welfare gain from the decreased work days lost is PKR 107.935 million (or USD 1.023 million). Reduction in the mitigation cost can be in the tune of 6.80092 billion PKR. We recommend the use the cement brick as an alternative to the Present one. The Study is useful policy analysis and we urge the official to overcome the policy gaps by addressing the problem in an appropriate manner. The study shall serve as a springboard for more studies on this area.
References
- Abu-Allaban, M., & Abu-Qudais, H. Impact Assessment of Ambient Air Quality by Cement Industry: A Case Study in Jordan. Taiwan Association for Aerosol Research ISSN: 1680-8584 print / 2071-1409 online (2011).
- Adhikari, N. Measuring the Health benefit from reducing air pollution katmando valley. nepal: Published by the South Asian Network for Development and Environmental Economics (SANDEE) (2012).
- Akbar, S. Health Impacts of Outdoor Air Pollution. The World Bank (2003).
- BOGAHAWATTE, C., & HERATH, J. Air Quality and Cement Production: Examining the. Published by the South Asian Network for Development and Environmental Economics , (2012) 35.
- CHOWDHURY, T., & IMRAN, M. morbidity cost of vahculer air pollution in dakha. South Asian Network for Development and Environmental Economics (SANDEE (2010).
- Countery synthsis report on urban air quality in managment (2006).
- Greentech Knowledge Solutions. Brick Kilns Performance Assessment. New Delh (2012).
- GUPTA, U. Valuation of UrbanAirPollution:A Case Study of Kanpur City in India. Kanpur: South Asian Network for Development and Environmental Economics (SANDEE) (2008).
- Hossain, M., & Abdullah, A. M. Securing the Environment: Potentiality of Green Brick in Bangladesh. BUP Journal, (2012) 1(1).
- Iqbal*, M. J. Bonded Labor in the Brick Kiln Industry of Pakistan . The Lahore Journal of Economics , (2006) pp. 99-119.
- Ismail, M., Muhammad, D., Ullah Khan, F., Munsif, F., Ahmad, T., Ali, m., et al. Effect Of Brick Kilns’ Emissions On Heavy Metal (Cd And Cr) Content Of Contiguous Soil And Plants. Sarhad J. Agric. (2012) 28(3).
- javid, m. www.emission from kilns.com (2006).
- Khan, M., Khan, A. R., Tasheen Aslam, M.,Anwer, T., & Shah, J. stduy of atmosphric pollution vachlurs exuasted in bussy jamrod road pehawar. j.schem. soc.pk (2008) 30.
- Khan, S., & Jan, M. R. Assisment Of Envronmental And Socio. Economic Factorsof Brick Kilns In District Peshawar. Geol. Bull. Univ. Peshawar, (2000) 33, 97-102.
- Murty, M. N., Gulati, S. C., & Banerjee, A. Health Benefits from Urban Air Pollution. South Asian Network of Economic Institutions (2003).
- Pant, K. P. Estimating Health Benefits when Behaviors are Endogenous: A Case of Indoor Air Pollution in Rural Nepal. South Asian Network for Development and Environmental Economics (SANDEE (2008).


