Aquatic Insects as Bioindicators of Water Quality in the Achenkovil River, Kerala, India.
Sujitha S
*
 , Sreejai R
and Beena S Kurup
, Sreejai R
and Beena S Kurup
1
Department of Zoology, St. Stephen's College,
Pathanapuram, University of Kerala,
India
http://dx.doi.org/10.12944/CWE.18.3.22
Copy the following to cite this article:
Sujitha S, Sreejai R, Kurup B. S. Aquatic Insects as Bioindicators of Water Quality in the Achenkovil River, Kerala, India. Curr World Environ 2023;18(3). DOI:http://dx.doi.org/10.12944/CWE.18.3.22
Copy the following to cite this URL:
Sujitha S, Sreejai R, Kurup B. S. Aquatic Insects as Bioindicators of Water Quality in the Achenkovil River, Kerala, India. Curr World Environ 2023;18(3).
Download article (pdf)
Citation Manager
Publish History

Introduction
Freshwater ecosystems cover less than 10% of the total Earth's surface, yet they accommodate more than 10% of all known animal species. 1 Among them, more than 60% are aquatic insect fauna with rich diversity and abundance. Most of them are semiaquatic, with one or more life cycles in an aquatic habitat followed by a terrestrial habitat. The immature stages of Ephemeroptera, Plecoptera, Trichoptera, and Odonata are exclusively aquatic and are the predominant groups of aquatic insects found in many streams and rivers. Diptera, Coleoptera, Megaloptera, Hemiptera, etc. may also include some aquatic representatives.
2 They play an important role in aquatic and terrestrial habitats as primary consumers and detritivores, and they serve as food resources for many aquatic and terrestrial predators. Their community structure, distribution, diversity, and abundance depend on habitat type and environmental variables such as temperature, dissolved oxygen, nutrients, and food availability. Most aquatic insects are sensitive to pollution and anthropogenic stress.They are abundant and highly diverse in their habits and habitats, and they are highly sensitive to changing environmental conditions.Hence, they are commonly employed in biomonitoring studies in lentic and lotic systems.
3 Aquatic insects are ideal indicators of ecosystem diversity and health and play an important role in ecosystem stability. 4Since, aquatic insects are feasible indicators of water quality, both aquatic insects and water quality are interrelated. 5 Therefore, it will be possible to track changes in the factors governing water quality as well as the ecological integrity of streams and rivers through the study of the diversity, composition, structure, and abundance of aquatic insects.
Materials and Methods
Field of study
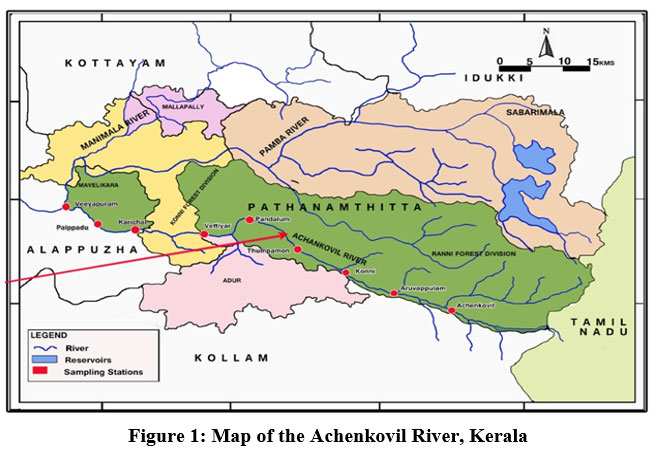
The Achenkovil River rises within the Konni reserve forest of the Pathanamthitta district in the Western Ghats, close to Devarmalai, at 9°19'0" N, 76°28'0" E. It flows through Pathanamthitta, Kollam, and Alappuzha districts before joining the Pamba River. It benefits Kerala's Pathanamthitta district. The river runs upstream into the Kollam district in small parts, and it joins the Pamba River at Veeyapuram in the Alappuzha district of Kerala (Figure 1). The basin spans 1,484 km³, the river is 128 km long, and an average of 2287 million cubic meters of water flow through it annually.
The study area experiences three distinct seasons: the premonsoon (February–May), the monsoon (June–September), and the postmonsoon (October–January). It has a tropical climate. In the midland and lowland areas, flooding is frequent during the rainy season. Kayamkulam Lake triggers saline intrusion into the lowland area when the water flow diminishes in the pre-monsoon season. This causes numerous technical issues in this area and negatively impacts the aquatic flora and fauna.
 | Figure 1: Map of the Achenkovil River, Kerala
|
Methods
In the Achenkovil River basin, a reconnaissance survey will be conducted to identify appropriate sites for sampling. Samples were collected in the early hours of the morning, between 6 and 11.30 hours. A sampling that was conducted every two months covered three seasons: pre-monsoon, monsoon, and post-monsoon. Nine stations in all—three from the river's upstream, midstream, and downstream segments—were chosen for sampling.
Macrobenthic insects were collected using D-frame nets (500µm). Three halls of the samples were collected for precision. The insect fauna was sorted, and the samples were moved to a white plastic tray for quick identification. To facilitate future research, the samples were kept in 80% ethanol. 6,7,8,9,10 The samples were identified up to their genus or species level under a stereomicroscope (Magnus MSZ-BI LED) and with the help of standard works on taxonomy.
Using a Niskin sampler, bottom water samples were gathered for physicochemical analysis. 11 A mercury thermometer was used to monitor the temperature of the water sample at the field itself. At the site, manganous sulfate and alkaline potassium iodide were used to treat the water samples for measuring DO and BOD.11 The Winkler method was used in the laboratory to analyze the samples of DO and BOD. A pH meter was used to calculate the pH, a gravimetric method was used to assess TDS (mg/l), a nephelometric method was used to measure turbidity (NTU), a systronics water analyzer 371 was used to measure salinity (ppt.), conductivity (µS/cm), and the spectrophotometric method was used to determine the amounts of phosphate and nitrate. (APHA 2017).
Evaluation of Statistics
Principal component analysis (PCA) was utilized to examine the discrepancy in ecological variables, and Pearson's correlation and Canonical Correlation were employed to observe the association between aquatic insect fauna and water quality parameters. The community structure was assessed using biodiversity indices. Software such as PAST was used to monitor CCA, Pearson’s correlation, and biodiversity indexes, while PCA was performed using SPSS.
Results
Environmental variables
The spatial variation of the studied physicochemical parameters with their standard deviations is given (Table 1 & 2). The PCA of the water quality parameters showed a total of 75.95% variance. A significant positive relationship with TDS, EC, and salinity was observed with a strong positive loading value greater than 0.75, and an average positive association with pH was demonstrated with a loading value of >0.50 on the first PCA axis, which accounted for 31.58% of the total variability. Making up 22.92% of the deviation, the PC2 axis showed a moderately positive correlation with turbidity and a significant positive correlation with phosphate and nitrate. With robust positive association between BOD and temperature of the water, as well as a moderately negative relationship with DO, PC3 explained 21.45% of the variability. 12Water quality parameters can be evaluated for variation using a loading value higher than 0.75.
Table 1: displays the mean and standard deviation of the physicochemical parameters that were investigated during the research period in Achenkovil River, Kerala.
Stations | WT (°C) | Turbidity (NTU) | BOD (mg/l) | DO (mg/l) | TDS (mg/l) |
S1 | 23.91 ±2.06 | 4.83 ±4.79 | 1.39 ±0.79 | 6.77 ±0.97 | 101.7 ±22.53 |
S2 | 25.26 ±1.55 | 5.04 ±2.99 | 1.65 ±0.67 | 6.48 ±0.97 | 117.7 ±36.53 |
S3 | 25.33 ±1.21 | 5.48 ±2.17 | 2.10 ±0.76 | 5.90 ±1.09 | 112.1 ±35.40 |
S4 | 26.23 ±1.10 | 5.52 ±2.71 | 2.20 ±0.64 | 6.16 ±0.92 | 119.6 ±30.48 |
S5 | 26.92 ±1.00 | 6.69 ±1.80 | 2.93 ±1.60 | 6.26 ±0.95 | 113.0 ±31.49 |
S6 | 26.99 ±0.79 | 6.96 ±2.25 | 2.90 ±1.64 | 5.90 ±1.07 | 150.6 ±44.94 |
S7 | 27.25 ±0.72 | 7.93 ±2.35 | 2.61 ±0.81 | 5.54 ±0.87 | 149.9 ±34.75 |
S8 | 28.10 ±0.99 | 8.58 ±2.79 | 2.94 ±0.60 | 5.25 ±1.13 | 317.6 ±123.7 |
S9 | 28.65 ±1.27 | 8.75 ±2.50 | 2.87 ±0.63 | 4.95 ±0.94 | 337.4±120.0 |
Table 2: displays the mean and standard deviation of the physicochemical parameters that were investigated during the research period in Achenkovil River, Kerala.
Stations | pH | EC (µs/cm) | Salinity (ppt.) | Phosphate (mg/l) | Nitrate (mg/l) |
S1 | 6.85 ±0.30 | 74.95 ±14.45 | 0 | 0.48 ±0.17 | 0.74 ±0.16 |
S2 | 6.74 ±0.19 | 64.13 ±13.24 | 0 | 0.49 ±0.14 | 0.92 ±0.16 |
S3 | 6.81 ±0.12 | 59.57 ±12.80 | 0.001 ±0.003 | 0.58 ±0.15 | 0.87 ±0.23 |
S4 | 6.78 ±0.18 | 66.89 ±14.29 | 0.001 ±0.003 | 0.66 ±0.17 | 0.92 ±0.22 |
S5 | 6.87 ±0.22 | 72.54 ±21.03 | 0.002 ±0.004 | 0.55 ±0.19 | 0.94 ±0.18 |
S6 | 6.87 ±0.36 | 75.94 ±19.08 | 0.002 ±0.006 | 0.60 ±0.20 | 0.99 ±0.21 |
S7 | 6.81 ±0.39 | 82.78 ±11.74 | 0.012 ±0.007 | 0.56 ±0.18 | 0.88 ±0.21 |
S8 | 6.94 ±0.35 | 173.6 ±167.1 | 0.259 ±0.156 | 0.80 ±0.24 | 1.01 ±0.17 |
S9 | 7.13 ±0.24 | 183.0 ±172.0 | 0.266 ±0.171 | 1.08 ±0.17 | 1.08 ±0.20 |
Aquatic insect fauna
In the current study, 10736 individuals from 8 orders, 21 families, 35 genera, and 36 species were included in the composition and distribution of the insect fauna. Ephemeroptera, Zygoptera, Plecoptera, Coleoptera, Anisoptera, Hemiptera, Diptera and Trichoptera are the major orders. With eleven species, Ephemeroptera was the most abundant group, followed by Anisoptera with six. Diptera, Coleoptera, and Trichoptera each contributed 5 species and 1 species each of Plecoptera, Hemiptera, and Zygoptera. The percentage contribution of Ephemeroptera was 40% of the total aquatic insect fauna and was represented by six families- Leptophlebidae, Heptageniidae, Baetidae, Caenidae, Prosopistomatidae, and Teloganodidae. The second abundant group was Diptera, accounting for 22% of the total aquatic fauna with two families, Chironomidae and Ceratopogonidae, followed by Trichoptera (20%) with four families- Economidae, Philopotamidae, Hydropsychidae, and Leptoceridae. Anisoptera and Coleoptera accounted for 7% and 5% respectively, with two and four families. The families Gomphidae and Libellulidae belong to Anisoptera. The order Coleoptera included Dytiscidae, Psephanidae, Elmidae, and Hydrophilidae. The Plecoptera contributed 4% of the total insect fauna studied and was represented by a single family, Perlidae. The orders Zygoptera and Hemiptera contributed only 1% of the total insect fauna studied and were represented by single families Euphaeidae and Nepidae, respectively (Table: 3).
Table 3: shows the taxonomic makeup, relative abundance (RA), and site occurrence (UP: Upstream, MD: Midstream, DW: Downstream) of the aquatic insect fauna that was collected in the Achenkovil River in Kerala.
Order/Family | Genus/Species | RA UP | MD RA | DW RA |
Ephemeroptera | ||||
Leptophlebidae | Notophlebia jobi Sivaramakrishnan and Peters, 1984 | 8.85 | 5.13 | 2.67 |
Leptophlebidae | Nathanella indica Sivaramakrishnan, Venkataraman and Balasubramanian, 1996 | 6.03 | 7.01 | 1.46 |
Leptophlebidae | Notophlebia ganeshi Kluge, 2014 | 7.67 | 7.04 | 0.91 |
Caenidae | Clypeocaenis bisetosa Soldan, 1978 | 3.97 | 6.23 | 13.32 |
Caenidae | Caenis sp. Stephens, 1836 | 0.86 | 0 | 0 |
Teloganodidae | Teloganella indica Selvakumar, Sivaramakrishnan and Jacobus, 2014 | 2.8 | 0 | 0 |
Teloganodidae | Teloganodes kodai Sartori, 2008 | 3 | 0 | 0 |
Baetidae | Acentrella (Liebebiella) vera Muller-Liebenau, 1982 | 3.26 | 2.95 | 5.05 |
Baetidae | Nigrobaetis paramakalyani Kubendran and Balasubramanian, 2015 | 3.24 | 3.24 | 4.69 |
Heptageniidae | Afronurus kumbakkaraiensis Venkataraman and Sivaramakrishnan, 1989 | 6.65 | 3.18 | 0 |
Prosopistomatidae | Prosopistoma indicum | 0.92 | 0.58 | 0 |
Peters, 1967 | ||||
Plecoptera |
|
|
|
|
Perlidae | Neoperla Needham, 1905 | 3.09 | 0 | 0 |
Perlidae | Planoperla Latreille, 1802 | 4.16 | 0 | 0 |
Diptera |
|
|
|
|
Chironomidae | Chironomous sp. Meigen, 1803 | 1.2 | 11.78 | 19.42 |
Chironomidae | Ablabesmya Newman, 1834 | 0.97 | 12.56 | 16.25 |
Chironomidae | Clinotanypus Kieffer, 1923 | 0.19 | 3.15 | 16.6 |
Ceratopogonidae | Dasyhelea Kieffer, 1911 | 0 | 0.45 | 13.87 |
Ceratopogonidae | Bezzia Kieffer, 1899 | 0 | 0.1 | 2.37 |
Hemiptera |
|
|
|
|
Nepidae | Nepa sp. Linnaeus, 1758 | 1.29 | 0.06 | 0 |
Zygoptera |
|
|
|
|
Euphaeidae | Euphaea sp. Selys, 1840 | 1.04 | 0.13 | 0 |
Anisoptera |
|
|
|
|
Gomphidae | Paragomphus sp. Cowley, 1934 | 2.4 | 1.56 | 0.1 |
Gomphidae | Lestinogomphuss sp. Martin, 1911 | 1.25 | 0.62 | 0.86 |
Gomphidae | Stylogomphus sp. Fraser, 1922 | 0.48 | 0.91 | 0.1 |
Gomphidae | Stylurus sp. Needham, 1897 | 0.55 | 1.23 | 0.2 |
Gomphidae | Stylogomphus sp. Fraser, 1922 | 2.29 | 4.96 | 0.35 |
Libellulidae | Crocothemis serviilia Drury, 1770 | 1.13 | 0.52 | 0 |
Coleoptera |
|
|
|
|
Dytiscidae | Agabus sp. Leach, 1817 | 0.42 | 0.55 | 0 |
Psephenidae | Eubrinax sp. Lacordaire, 1857 | 1.87 | 2.14 | 0.55 |
Elmidae | Cylloepus sp. Erichson, 1847 | 1.9 | 1.62 | 0.1 |
Hydrophilidae | Chaetarthria sp. Stephens, 1835 | 0.02 | 0.84 | 0 |
Hydrophilidae | Hydrophilus sp. Latreille, 1802 | 1.34 | 1.33 | 0.15 |
Trichoptera |
|
|
|
|
Economidae | Economous sp. Ulmer, 1903 | 1.8 | 1.14 | 0.25 |
Philopotamidae | Chimarra sp. Stephens, 1829 | 2.12 | 1.33 | 0.71 |
Hydropsychidae | Cheumatopsyche sp. Wallengren, 1891 | 11.21 | 6.91 | 0 |
Hydropsychidae | Macrostemium sp. Kolenati, 1859 | 8.82 | 9.7 | 0 |
Leptoceridae | Ceraclea sp. Stephens, 1829 | 3.23 | 1.04 | 0 |
Correlation analysis
In order to track the relationship between aquatic insect fauna and environmental variables, CCA and Pearson's correlation coefficient were employed. The axis 1 of CCA plot explained 79.3% of the total deviation within the aquatic insect fauna dataset, while the second axis explained 12.71% of the discrepancy. The aquatic insect group Diptera displays an upward trend with environmental variables, including water temperature, turbidity, BOD, electrical conductivity, TDS, pH, salinity, phosphate, and nitrate. In a similar vein, Hemiptera, Ephemeroptera, Zygoptera, Plecoptera, Coleoptera, Anisoptera, and Trichoptera all exhibited negative correlations with DO. Aquatic insects and other aquatic faunas have a complex community structure that is influenced by environmental factors. From the ordination plot of CCA, it can be concluded that aquatic insects undergo spatial variations based on their environmental needs (Figure: 2).
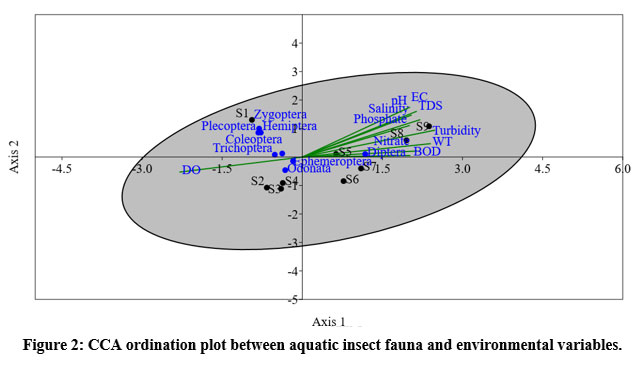 | Figure 2: CCA ordination plot between aquatic insect fauna and environmental variables.
|
Pearson’s correlation coefficient (Two-tailed)
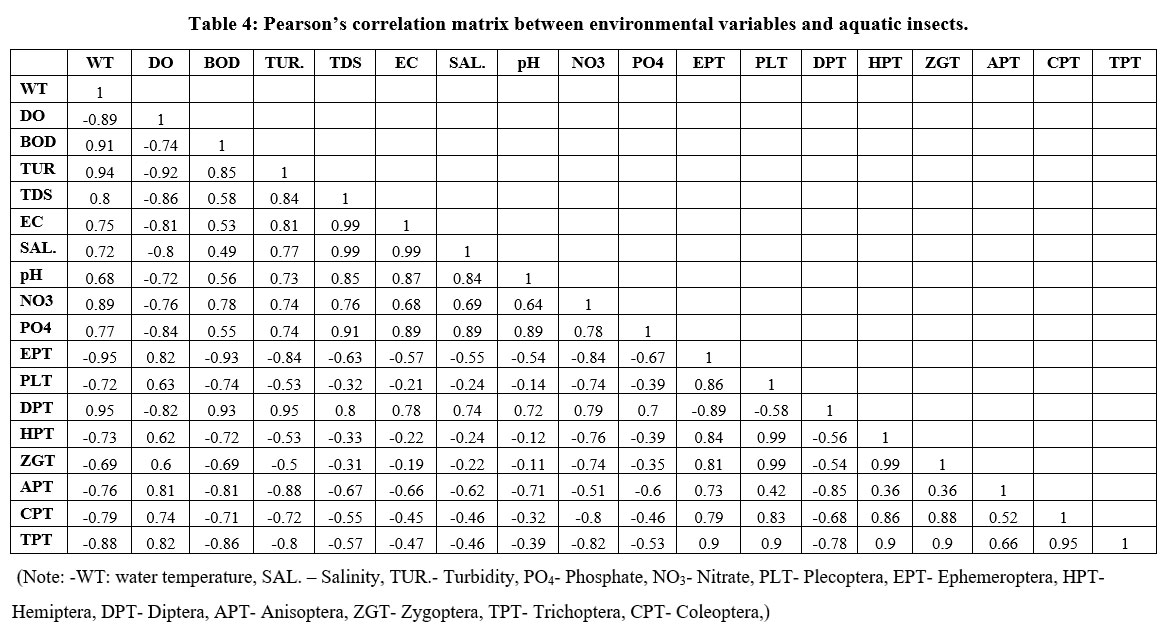
The Pearson’s correlation matrix is given in Table 4. All collected aquatic insects showed a positive correlation with DO, except Diptera, which showed a negative correlation.
The aquatic insect group Diptera has a positive correlation with temperature, turbidity, biochemical oxygen demand, electrical conductivity, total dissolved solids, pH, salinity, phosphate, nitrate; on the other hand, Zygoptera, Ephemeroptera, Hemiptera, Plecoptera, Coleoptera, Anisoptera, and Trichoptera have a negative relationship with these variable. The results of both CCA and the correlatin matrix are very similar. The study clearly reveals the influence of water quality variations in the Achenkovil River.
 | Table 4: Pearson’s correlation matrix between environmental variables and aquatic insects.
|
Biodiversity Indices
The highest number of individuals (3010 Ind/m2) was found at station 1 (S1)-, while the lowest number of individuals (566 Ind/m2) was found at station 9 (S9)-. Spatial variation in biodiversity was studied using diversity indices (Table: 5). Ephemeroptera dominated in S1, followed by Trichoptera and Plecoptera, and the least represented group was Diptera. The majority of taxa that are sensitive to pollution were not present in the river's downstream sections, while groups that are tolerant of pollution, like chironomids, were abundant.
Table 5: Station-wise variation of biodiversity indices
Simpson index | Shannon index | Margalef index | Dominance index | Eveness index | |
S1 | 0.94 | 3.08 | 3.87 | 0.06 | 0.68 |
S2 | 0.94 | 3.03 | 4.21 | 0.06 | 0.65 |
S3 | 0.93 | 2.95 | 4.15 | 0.07 | 0.64 |
S4 | 0.93 | 2.96 | 3.91 | 0.07 | 0.66 |
S5 | 0.89 | 2.6 | 3.8 | 0.11 | 0.5 |
S6 | 0.91 | 2.69 | 3.7 | 0.09 | 0.56 |
S7 | 0.88 | 2.4 | 3.07 | 0.12 | 0.52 |
S8 | 0.84 | 1.99 | 1.82 | 0.16 | 0.56 |
S9 | 0.83 | 1.97 | 1.89 | 0.17 | 0.55 |
Discussion
The application of PCA revealed the importance of environmental variables in affecting the water quality of the studied stations. Of the PC1 variables, TDS, conductivity, salinity, and pH made up 31.58%. It was believed that the discrepancies in the water were caused by the influx of salt water from Kayamkulam Lake. At station 9, the highest salinity and electrical conductivity values were observed. This could be as a result of saltwater from Kayamkulam Lake intruding into the downstream portion of the river owing to a decrease in water depth and flow velocity during the premonsoon season (S8 & S9). As a result, the salinity value rises and the electrical conductivity values rise in tandem. 13When photosynthetic activity increases, a corresponding increase in pH was noted in many studies. This could be the cause of station 9's elevated pH value. Of the PC2 variables, nitrate, phosphate, and turbidity accounted for 22.92%. The maximum value for turbidity was also noticed at station 9 during the monsoon. This may be because heavy rain is accompanied by surface runoff, which brings in sand, clay, silt, organic matter, etc. into the water body. 14 Turbidity hurts the biological productivity of aquatic ecosystems. 15 In addition, the monsoon season causes the addition of nitrate and phosphate into the water body from agricultural land, thereby contributing to a hike in the values for nitrate and phosphate. PC3 accounted for 21.45% of the variables with respect to water temperature, BOD, and DO. One significant environmental factor that significantly affects the physicochemical and biological properties of water is temperature.16 The absence of canopy cover, high solar radiation, little precipitation, low water levels, and clear skies could all be contributing factors to the temperature maxima in S9. Station 1 is characterized by low temperature and high DO values (S1). The reference site, S1, is surrounded by dense vegetation that shields surface water from direct heat and is situated in Kerala's deep Western Ghats forests. As temperature rises, the DO of the body of water falls.17Warmer water holds less DO because it becomes easily saturated with oxygen. 18Moreover, the riverbed of station 1 has a rugged topography, which increases the water turbulence and thereby a hike in the DO values. The maximum hike in the value of BOD was reported from station 8 (S8). 19Low water velocity, low rainfall, and high temperatures might be the cause of this hike.
The relationship between aquatic insect fauna and water quality parameters is shown in Figure: 2 and Table: 4. Of the total deviation, 79.3% was explored by the first canonical axis and 12.71% by the second (Figure: 2). A positive correlation with BOD, TDS, turbidity, electrical conductivity, pH, salinity, phosphate, and nitrate was found in this study. These factors are associated with the aquatic insect order Diptera. The relationships between DO and Plecoptera, Ephemeroptera, Zygoptera, Anisoptera, Hemiptera, Trichoptera, and Coleoptera were inverse. The results of the correlation coefficient and CCA were extremely similar. This study reveals the close connection between Achenkovil River's aquatic insect fauna and environmental factors. 13In freshwater ecosystems, insects are widely regarded as the most prevalent macroinvertebrates among the diverse group of aquatic organisms.
20 The diversity and community structure of aquatic insects are profoundly affected by seasonal and spatial variation. Aquatic organisms exhibit dynamic community structure and composition in response to environmental factors and hydrobiological features. Large microhabitat diversity and clean water quality of the upstream station favours a rich diversity of aquatic insect fauna. Greater microhabitat diversity and improved water quality are indicated by the rise in the diversity of aquatic insect fauna in the Achenkovil River's upstream area. 21Similarly, the high richness and abundance of EPT in the upstream stretch and their decrease or absence in the downstream stretch may be due to deteriorating habitat and water quality.
8Most species of Ephemeroptera cannot withstand environmental stress, so their presence indicates a relatively positive or stable condition. Plecopterans are highly sensitive to environmental degradation. 22 Because healthy vegetation provides food and breeding grounds, coleopterans are widely distributed in areas with good vegetation and can withstand moderate levels of pollution.23Plecoptera and Trichoptera are highly sensitive to pollution and therefore present only in clean and well-oxygenated water. 24This could be the cause of their profusion in the reference site. To track different kinds of disturbances in the waterbody, some EPT members are employed. 25Studies have shown that, among the Dipterans, the chironomids form the dominant taxa in many natural as well as in the 26non-natural environments. 27The Habitat heterogeneity formed as a result of complex vegetation, nature of substrate, and physicochemical characteristics, etc., plays a central role in shaping the abundance and community structure of odonates. 28A decline in macrofaunal abundance in the mid-stream and downstream portions of the river may be due to significant human threats and a high pollution load, which eventually results in a deterioration of the water quality. 22 Taxa that are resistant to pollution, like chironomids, can tolerate increases in TDS, electrical conductivity, turbidity, and even low DO levels. They can even withstand low oxygen levels. 29Moreover several chironomids in the collected sample is an indication of severe anthropogenic threats. Therefore, they are widely used as bioindicators in water quality monitoring studies. 25The number of sensitive species decreases and that of tolerant species increases when there is a shift in water quality from clean to poor. The downstream stretch of the river is always under severe anthropogenic stress, such as higher instream and near -stream activities, dumping of poultry waste, and intrusion of salt water etc. 21,30 Similar studies have shown that these activities ultimately lead to the extinction of aquatic fauna and a decline in the quality of the water.
Biodiversity indices help us understand the different types of species in a community. Values for biodiversity indices, such as species diversity, richness, dominance, and evenness, can be used to assess station-wise variability in the water's health status. As Simpson emphasizes the quantity and relative abundance of each species, Shannon bases her findings on species richness and evenness. The sample size and percentage of common species are important factors determined by the evenness and dominance indices. Margalef’s index is a simple measure of species richness. Station 1 had the highest values for Shannon, Simpson and Eveness, while Station 2 had Margalef's and Station 9 had dominance. In the same way, station 9 had the least values for Simpson and Shannon, while station 8 had the lowest values for the Margalef index and station 5 had the lowest values for Evenness_e?H/S. 25The absence of sensitive taxa and the presence of more tolerant taxa such as Chironomids may result in high dominance, resulting in a reduction of species richness and diversity. The reference site S1 is characterized by thick canopy cover preventing excessive hikes in water temperature, high DO levels, and habitat heterogeneity for aquatic organisms, leading to increased diversity. A Shannon index and Margalef index values below 3 indicates organic pollution in the waterbody. Stations 3 through 9 had Shannon index values below 3, and stations 8 and 9 had Margalef index values below 3. 31 In the Alaro stream in Ibadan, Kabir and Offioong-obtained a similar outcome. For any biological system, the simple and most useful method is to assess its species diversity. 32Species diversity is an efficient ecological tool that helps to understand the relationship between species diversity and the nature of the environment. When determining the relative level of pollution in different waterbodies, aquatic insect abundance and presence are important factors to consider. The aquatic insect fauna was, therefore, studied because of their ubiquitous presence in all sorts of water and their potential to indicate the degree of pollution. 33 To maintain a proper and stable ecosystem service, it is necessary to understand the dynamics of biological communities.
Conclusion
Many anthropogenic threats were present in the middle and downstream sections, which caused significant fluctuations in the water quality parameters that affect the diversity and abundance of aquatic insect fauna. Poor water quality is evident in the middle and downstream sections of this river, as evidenced by lack of pollution-sensitive species in these sections and their abundance in the upstream section. The higher concentrations of conductivity, salinity, TDS, and turbidity in the downstream segment of the river are due to the influence of saltwater intrusion from Kayamkulam Lake. This is also a major reason for the absence of pollution-sensitive species in this segment of the river. The CCA analysis revealed a clear separation of aquatic insect groups based on the changes that occurred in the water quality on a spatial scale. This study offers fresh perspectives on the Achenkovil River's conservation strategies in the face of numerous man-made dangers.
Acknowledgments
We are grateful to the University Grants Commission, New Delhi for providing a Senior Research Fellowship (ID. No.365892) to the first author. We are also thankful to the Principal of St.Stephen’s College, Pathanapuram for providing us with the necessary facilities to conduct the research work.
Conflict of Interest
The author(s) declares no conflict of interest.
Funding Source
UGC JRF Fellowship : Grand No. 365892 UGC circular No. and date No. F.16-6 (Dec. 2016/2017 (NET) UGC. Ref. No.957/(OBC) (CSIR- UGC NET DEC. 2016).
References
- Hershey A. E., Lamberti G. A., Chaloner D. T. and Northington R. M. Aquatic insect ecology. In Ecology and classification of North American freshwater invertebrates. 2010; 659-694. Academic Press.
CrossRef - Vilenica M., Vuataz L., and Yanai Z. Introduction to the Special Issue “Aquatic Insects: Biodiversity, Ecology, and Conservation Challenges”. 2022; 14(7), 573.
CrossRef - El Alami M., Yaagoubi S., Gattolliat J. L., Sartori M. and Dakki M. Diversity and Distribution of Mayflies from Morocco (Ephemeroptera, Insecta). 2022; 14(6), 498.
CrossRef - Vian C. V., Harun S., Hee K. B., Hui A. W. B. and Fikri A. H. Aquatic Insects and Water Quality Study at Kimanis River, Crocker Range National Park, Sabah, Malaysia. Journal of Tropical Biology & Conservation (JTBC). 2018; 15, 223â-245.
CrossRef - Arimoro F. O. and Ikomi R. B. Ecological integrity of upper Warri River, Niger Delta using aquatic insects as bioindicators. Ecological indicators. 2009; 9(3), 455-461.
CrossRef - Yule C. M. and Sen Y. H. Freshwater invertebrates of the Malaysian region. Academy of Sciences Malaysia. 2004
- Thorp J. H. and Rogers D. C. Thorp and Covich's Freshwater Invertebrates, London: Elsevier. 2015; 65-82.
CrossRef - Merritt R. W. and Cummins K. W. An introduction to the aquatic insects of North America. Kendall Hunt. 1996
- Dudgeon D. Tropical Asian streams: zoobenthos, ecology and conservation. Hong Kong University Press. 1999
- Selvakumar C., Subramanian K. A. and Sivaramakrishnan K. G. Mayflies (Insecta: Ephemeroptera) of India. In Indian Insects: 2019; 7-28. CRC Press. ISBN: 978-61-8171.
CrossRef - APHA. Standard Methods for the Examination of Water and Wastewater, 27th edition. American Public Health Association, Washington, D.C: 2017; 1,220.
- Liu C. W., Lin K. H. and Kuo Y. M. Application of factor analysis in the assessment of groundwater quality in a Blackfoot disease area in Taiwan. Science of the total environment. 2003; 313(1-3), 77-89.
CrossRef - Craft C., Vymazal Jand Kropfelova L. Carbon sequestration and nutrient accumulation in the floodplain and depressional wetlands. Ecological Engineering. 2018; 114:137-145.
CrossRef - Mahajan S and Billore D. Seasonal variations and Assessment of water quality of Nagchoon pond of Khandwa District (MP) India. Current World Environment. 2014; 9(3): 829.
CrossRef - Varol M., Gokot B., Bekleyen A. and Sen B. Spatial and temporal variations in surface water quality of the dam reservoirs in the Tigris River basin, Turkey. Catena. 2012; 92: 11-21.
CrossRef - Abhilash H. R and Mahadevaswamy M. Assessment of Water Quality Parameters and Aquatic Insect Assemblages in Dalvoy Lake, Mysore District, Karnataka, India. Current World Environment. 2021; 16(2): 514-529.
CrossRef - Yang S., Liang, M., Qin Z., Qian, Y., Li, M. and Cao, Y. A novel assessment considering spatial and temporal variations of water quality to identify pollution sources in urban rivers. Scientific report. 2021; 11(1): 1-11.
CrossRef - Kannel P. R., Lee S., Lee Y. S., Kanel S. R and Khan S. P. Application of water quality indices and dissolved oxygen as indicators for river water classification and urban impact assessment. Environmental monitoring and assessment. 2017; 132(1): 93-110.
CrossRef - Girija T. R., Mahanta C and Chandramouli V. Water quality assessment of an untreated effluent impacted urban stream: the Bharalu tributary of the Brahmaputra River, India. Environmental monitoring and assessment. 2007; 130(1), 221-236.
CrossRef - Sasikala V., Saravanakumar A and Balasubramanian T. Spatial and temporal distribution of macrobenthos in Point Calimere of Southeast coast of India, Indian journal of Geomarine Sciences. 2017; 46(2): 377-384.
- Masese F. O., Raburu P. O and Muchiri M. A preliminary benthic macroinvertebrate index of biotic integrity (B-IBI) for monitoring the Moiben River, Lake Victoria Basin, Kenya. African Journal of Aquatic Science. 2009; 34(1), 1-14. https://doi.org/10.2989/AJAS.2009.34.1.1.726
CrossRef - Popoola K. K., Sowunmi A. A. and Amusat A. I. Comparative study of Physico-chemical parameters with national and international standards and the insect community of Erelu Reservoir in Oyo town, Oyo State, Nigeria. International Journal of Water Resources and Environmental Engineering. 2019; 11(3): 56-65.
CrossRef - Priyanka G.L and Prasad G (2013). Diversity of aquatic insects (Ephemeroptera, Plecoptera and Trichoptera) in Kallar stream and its tributaries, 2013; 2: 493-499.
- Abhijna U. G., Ratheesh R and Kumar A. B. Distribution and diversity of aquatic insects of Vellayani lake in Kerala. Journal of Environmental Biology. 2013; 34(3): 605-611.
- Copatti E., Ross M., Copatti B. R. and Seibel L. F. Bioassessment using benthic macroinvertebrates of the water quality in the Tigreiro river, Jacuí Basin. Acta Scientiarum. Biological Sciences. 2013; 35(4): 521-529.
CrossRef - Hepp L. U., Milesi S. V., Biasi C. and Restello R. M. Effects of agricultural and urban impacts on macroinvertebrates assemblages in streams (Rio Grande do Sul, Brazil). Zoologia (curitiba). 2010; 27, 106-113. https://doi.org/10.1590/S1984-46702010000100016
CrossRef - Wijesooriya M. M., Jayalath M. G., Perera S. J. and Samanmali C. The Odonate fauna (Insecta: Odonata) of Belihuloya, southern intermediate zone of Sri Lanka: A preliminary assessment and conservation implications. Journal of Asia-Pacific Biodiversity. 2022; 15(3): 311-328.
CrossRef - Kumar C. S., Sundar S. and Arunachalam M. Diversity and Distribution of Mayflies (Insecta: Ephemeroptera) in Tamirabarani River of Southern Western Ghats, India. Int. J. Appl. Bioresearch. 2012; 5: 1-7.
- Al-Shami S., Rawi C. S. M., Nor S. A. M., Ahmad A. H. and Ali A. Morphological deformities in Chironomus spp. (Diptera: Chironomidae) larvae as a tool for impact assessment of anthropogenic and environmental stresses on three rivers in the Juru River System, Penang, Malaysia. Environmental Entomology. 2010; 39(1): 210-222.
CrossRef - Malmqvist B., and Rundle S. Threats to the running water ecosystems of the world. Environmental conservation. 2002; 29(2), 134-153. https://doi.org/10.1017/S0376892902000097
CrossRef - Kabir P. K. O. and Offioong I. V. Macrobenthic invertebrates survey and physicochemical parameters of Alaro stream, Oluyole industrial estate, Ibadan. Nigerian Journal of Ecology. 2016; 15(1): 110-120.
- Dalia Susan V., Satheesh Kumar P. and Pillai N. G. K. Biodiversity and seasonal variation of benthic macrofauna in Minicoy Island, Lakshadweep, India. Acta Oceanologica Sinica. 2014; 33(10), 58-73. https://doi.org/10.1007/s13131-014-0541-3
CrossRef - Moura L. C. D. S., Santos S. M. D., Souza C. A. D., Santos C. R. A. D. and Bortolini J. C. Phytoplankton richness and abundance in response to seasonality and spatiality in a tropical reservoir. Acta Limnologica Brasiliensia. 2021; 33. https://doi.org/10.1590/S2179-975X11419
CrossRef


