Assessment of Heavy Metal Contamination in Vegetables from Industrial Areas of Haryana
Jyoti Rani1
 , Sonia Rani2
, Deepak Kumar1
, Abhilasha Yadav1
, Tripti Agarwal3
and Sudesh Chaudhary1
*
, Sonia Rani2
, Deepak Kumar1
, Abhilasha Yadav1
, Tripti Agarwal3
and Sudesh Chaudhary1
*
1
Centre of Excellence for Energy and Environmental Studies,
Deenbandhu Chhotu Ram University of Science and Technology,
Murthal, Sonepat,
Haryana
India
2
Applied Science and Humanities,
Panipat Institute of Engineering and Technology,
Panipat,
Haryana
India
3
Department of Agriculture and Environmental Science,
National Institute of Food Technology Entrepreneurship and Management,
Sonepat,
Haryana
India
Copy the following to cite this article:
Rani J, Rani S, Kumar D, Yadav A, Agarwal T, Chaudhary S. Assessment of Heavy Metal Contamination in Vegetables from Industrial Areas of Haryana. Curr World Environ 2025;20(2).
Copy the following to cite this URL:
Rani J, Rani S, Kumar D, Yadav A, Agarwal T, Chaudhary S. Assessment of Heavy Metal Contamination in Vegetables from Industrial Areas of Haryana. Curr World Environ 2025;20(2).
Citation Manager Publish History

Introduction
The rapid industrialization, population explosion, and unsustainable utilization of natural resources have resulted in an increase in all kinds of pollution in recent decades. As the environment has no boundaries, the pollutants move from one form of medium to another, like the lead emitted in the atmosphere by using leaded petrol, which left its residues on the plants, soil, and water. All the pollutants are equally harmful, but heavy metals have several health effects on humans and plants. Heavy metals can be transferred from one form to another and can change their oxidation states, which decides the toxicity level of heavy metals.1 In addition, long-term exposure to lead can cause hypertension, nephritis, and cardiovascular disorders in children as well as negatively impact brain development.2 Also, Zn can lower immunological function and high-density lipoprotein levels, whereas Pd can result in contact dermatitis.3 Furthermore, it was shown that HM interacted with nuclear proteins and DNA, resulting in irreversible alterations and confirmational changes that could trigger apoptosis, carcinogenesis, or cell cycle modification. The International Agency for Research on Cancer (IARC) has designated As and its chemical constituents as Group 1 carcinogens. promotes cancers of the skin, lungs, and bladder.4,5 Once in the environment, heavy metals spread into the soil, air, and water through the dumping of waste and then cycle between living and non-living components through various pathways. These metals can enter our body by three routes i.e. inhalation, ingestion, and skin contact.6 Any metal will be termed as a contaminant when it is present at an unwanted location in such a form and concentration that may cause detrimental environmental and human health effects. Heavy metals may get bio-accumulated and biomagnified at each trophic level through the food chain. Irrigating water, soil concentration, soil type, fertilisers, atmospheric deposition, climate, plant species, and harvest maturity are important variables that affect HM bioaccumulation in vegetables.7 Environmental metal pollutants have the ability to settle on soils, where they may be absorbed by plants or build up on leaves and other aerial components. In general, compared to fruits, nuts, and grains, green vegetables tend to collect higher concentrations of pollutants. Increased human activity is directly related to the rise in atmospheric deposition of pollutants in soil, which raises the amounts of metals in vegetable edible parts.8,9 Many heavy metals like Ni, Cd, Pb, etc., are mutagenic, non-biodegradable, and carcinogenic. Vegetables make an essential part of human diet as they serve as a source of nutrients, energy, and microelements. The natural sources for heavy metals are forest fire, bubble bursting, sea spray, leaves and stems, volcanic eruption, and volatilization, etc.10,11 The anthropogenic sources of heavy metals can be classified as agricultural, industrial, and transportation.12,13 Heavy metals like Pb, Cd, As, Hg, etc. have a toxic and long-lasting effect on human health whereas Cu, Zn, Fe, Mn, Co and Ni are not only required for human growth but also essential micronutrients for plants as they help in plant growth, development, and signal transduction. Heavy metals combine with one or more reactive groups hydroxyl, carbonyl, sulfur, and nitrogen that are essential for the normal physiological functions.14 The effect of heavy metals depends on their form and exposure dose taken by a human. Hazardous materials like dioxins, volatile organic compounds, and heavy metals have been released into the environment as a result of increased garbage production and poor waste management.15 The excessive amount of heavy metals in agricultural soils reduce crop quality and can result in deleterious health effects to the consumers.16 Vegetables cultivated in heavy metals contaminated soils can accumulate these metals in their non-edible and edible parts.17 Organic matter, pH, cations exchange capacity, and texture of soil decide the mobility and availability of metals for the vegetation.18 Among food, vegetables are the common diet for humans across the world because it contains essential elements for normal growth. It has been shown that along with acting as a source of essential elements these vegetables may also be a potential source of toxic heavy metals when grown on heavy metals contaminated soil.19 Even while HM contamination in food, especially vegetables, has been the subject of various research conducted globally,20-23,9 this problem is still a major worry locally. The limited research on heavy metal contamination in vegetables dates back to before 2010,24,25 prior to the start of the chronic waste management crisis. Few studies have evaluated HM contamination in locally consumed fish, cheese, herbs, and spices.26,27 While a more recent study28 looked into copper, nickel, zinc, and manganese pollution. Only one study29 looked at aluminium contamination in a variety of foods, including vegetables. This study aimed to analyze heavy metals contamination in vegetables samples of the industrial areas of Haryana and the health risks associated with the exposure to these heavy metals to the consumers.
Material and Method
The study area included four districts of Haryana i.e. Gurugram, Faridabad, Sonepat and Panipat and is having more than 60 percent industries of the state. The different types of industries located in the area include metal and mineral-based, agro-based, electrical machinery, engineering units, repair and servicing, textile, auto parts, rubber, plastic, petro based motorcycle parts, diesel engines, etc.30 The emission from these industries may contribute a significant amount of heavy metals pollution in the surrounding area. The present study area is irrigated by groundwater except for one site located in Sonipat city, which is irrigated with wastewater. A total of 111 different types of vegetables samples were collected from the Industrial areas of Haryana during the winter season (October 2017 to February 2018) for analysis of heavy metals during. Description of the vegetables collected from the study area is given below in table 1:
Table 1: Description of the vegetable samples collected from study area
| S. No. | Vegetable (s) | Scientific name of vegetables | Number of vegetable samples collected (n) |
| 1 | Beet root leaves | Beta vulgaris | (n=4) |
| 2 | Beetroot | Beta vulgaris | (n=4) |
| 3 | Brinjal | Solanum melongena L. | (n=3) |
| 4 | Cabbage | Brassica oleracea var. capitata | (n=4) |
| 5 | Carrot leaves | Daucas carota L. | (n=4) |
| 6 | Carrot | Daucas carota L. | (n=4) |
| 7 | Cauliflower | Brassica oleracea L. var. botrytis | (n=9) |
| 8 | Chenopodium | Chenopodium album | (n=3) |
| 9 | Coriander | Coriandrum sativum L. | (n=5) |
| 10 | Fenugreek | Trigonella foenum-graecum | (n=8) |
| 11 | Mustard | Brassica nigra | (n=10) |
| 12 | Onion | Allium cepa | (n=4) |
| 13 | Onion leaves | Allium cepa | (n=4) |
| 14 | Potato | Solanum tuberosum | (n=4) |
| 15 | Pumpkin | Cucurbita | (n=4) |
| 16 | Radish | Raphanus raphanistrum subsp. sativus (L.) | (n=14) |
| 17 | Round guard | Lagenaria siceraria | (n=4) |
| 18 | Spinach | Spinacia oleracea | (n=15) |
| 19 | Turnip | Brassica rapa subsp. rapa | (n=4) |
The wet acid digestion technique and Atomic Absorption Spectrophotometry (AAS) were used to measure the content of heavy metals in vegetable samples.31 After properly cleaning fresh vegetable samples with deionised water to remove any surface impurities, they were allowed to air dry before being oven-dried at 60°C until their weight remained consistent. A stainless-steel grinder was then used to grind the dry samples, and they were subsequently sieved through a 2 mm mesh screen. A tri-acid mixture consisting of concentrated nitric acid (HNO?), sulphuric acid (H?SO?), and perchloric acid (HClO?) in a 5:1:1 (v/v/v) ratio was applied to 1.0 g of the powdered vegetable samples for digestion. A clear solution, signifying full digestion of the organic materials, was obtained by heating the mixture on a hot plate between 1500 and 180°C.32,33 Heating between 150–180°C ensures the complete oxidation of organic matter due to the strong oxidative properties of the acid mixture, eliminating the need for H?O?. It is sufficient to ensure efficient oxidation of organic matter; absence of residual organic material, perchloric acid plays a similar oxidative role and is capable of destroying tough organic bonds without additional oxidizers like H?O?. After cooling, the digest was filtered using Whatman No. 42 filter paper and diluted with double-distilled water to reach the desired final volume. An Atomic Absorption Spectrophotometer (Model: Lab India 8000A)34 was used to measure the amounts of specific heavy metals, such as Pb, Cd, Cr, Ni, Zn, Cu, and Fe. Each sample was analyzed in triplicate to assess the precision and accuracy of the results. Standard solutions with concentrations ranging from 0.02 to 10 ppm (r2 = 0.999) were used to calibrate the device. The results were found within 5 % of certified values for every heavy metal with the correlation coefficient value 0.999. The data with value 0 indicates the heavy metals concentrations below the limits of detection. To ensure accuracy and precision, a blank and a standard solution were examined after every ten samples. Quality assurance was ensured through the use of reagent blanks, triplicates, and reference standard. Calibration of instruments was performed regularly to maintain accuracy. This approach is in line with accepted practices as outlined Moore and chapman2. Total potential non - carcinogenic health risk due to different metals by various exposure pathways was calculated as the sum of Hazard Quotients (HQs) as per literature.35,36 The Pearson’s correlation coefficient (r) with two-tailed significance level, principal component analysis (PCA), and cluster analysis (CA) using complete linkage method were applied to understand the relation between different metals.
Results
Heavy metals in vegetables
Metal concentrations detected in the collected vegetable samples were compared to the permissible limit of FAO/WHO standards, as well as, the concentrations reported in earlier studies. Mean concentration of heavy metals in the vegetables collected from NCR region of Haryana, India, is shown in the Table 2. The collected vegetables were categorized into different groups like leaves, fruits, bulb, root and flower. The relative abundance of heavy metal in the vegetable samples was higher amount of Fe followed by Al, Mn, Zn, Cu, Cr, Ni, Pb, Cd, Co. In leafy vegetables, the higher amount of Fe followed by Zn, Al, Mn, Cu, Ni, Cr, Pb, Co, Cd while in case of fruity vegetables, the heavy metals concentration was Fe, Al, Zn, Mn, Cu, Ni, Cr, Pb, Cd in bulb, the higher amount of Fe and Al was followed by Zn, Mn, Cu, Cr, Ni, Cd, Co, Pb, in rooty vegetables, the higher amount of Fe was followed by Al, Zn, Mn, Cu, Cr, Ni, Pb, in case of tuber and in the flower vegetables the higher amount of Fe was followed by Al, Zn, Mn, Cu, Cr, Ni, Pb, Co, Cd. Iron was the most prominent heavy metal detected in all the vegetables. The slight change in relative abundance of heavy metals in different categories of vegetables shows the different accumulation capacity for different metals amongst vegetables. Aluminium was detected in all the vegetable samples with minimum and maximum value observed in pumpkin (13.85 mg/kg) and mustard (333.88 mg/kg). Very high concentration of Al was found in cabbage, carrot, pumpkin and turnip in the present study as compared to Antoine et al.37 Cadmium was detected in all the vegetables except in onion leaves, round gourd, and potato. The minimum value of cadmium was found in cabbage and pumpkin (0.05 mg/kg) and the maximum value was in beet leaves (0.5 mg/kg). Amongst leafy vegetable mustard, beetroot, spinach, chenopodium, and carrot leaves exceeded the PL of 0.2 mg/kg. All other vegetables have crossed the permissible limit of 0.05 mg/kg prescribed by FAO/WHO.38 The leafy vegetables have a high foliar surface area that can absorb heavy metals from atmospheric deposition route.34,39 Concentration of Cobalt was found above permissible limits in mustard, fenugreek, beet leaves, carrot leaves, spinach, chenopodium, cauliflower, radish, brinjal, pumpkin, and round gourd. The minimum value of Cobalt was found in brinjal (0.05 mg/kg) while the maximum (0.25mg/kg) was in beet leaves. All the studied leafy vegetables exceeded the permissible limit of total chromium prescribed by FAO/WHO, except carrot leaves, chenopodium, and onion leaves. Among root vegetables, radish and turnip exceeded the permissible limits of chromium while in fruity vegetable only brinjal exceeded the permissible limit. In potato also the chromium concentration was higher than the permissible limit of FAO/WHO.39 The value of chromium was the minimum in onion bulbs (1.37 mg/kg) and the highest was found in mustard (6.38 mg/kg). The concentration of copper in each sample was significantly lower than the WHO/FAO permitted limit of 40 mg/kg.40 Copper concentration was found to be lowest in cabbage (3.02 mg/kg) and the highest in pumpkin (20.4 mg kg-1).
Table 2: Heavy metal concentration milligram per kilogram dry weight (mg/kg. dw) in vegetables samples
S. No. | Vegetable (s) | Heavy Metals (mg/kg. dw) winter | |||||||||
Al | Cd | Co | Cr | Cu | Fe | Mn | Ni | Pb | Zn | ||
1 | Beet leaves | 68.3 | 0.5 | 0.25 ± 0.05 | 3.75 ± | 11.2 ± | 143.2 | 54.1± | 1.75 | ND | 29.9 |
2 | Beetroot | 24.65 | 0.15 | ND | 1.5 ± | 11.15 ± | 69.65 | 19.4 ± | 0.8 | ND | 27 |
3 | Brinjal | 72.55 | 0.1 | 0.05 ± 0.01 | 2.52 ± | 9.37 ± | 109.48 | 24.12 | 1.42 | 0.18 | 25.92 |
4 | Cabbage | 21.68 | 0.05 | ND | 4.06 ± | 3.03 ± | 75.64 | 27.44 | 0.98 | 0.15 | 24.56 |
5 | Carrot leaves | 250.95 | 0.2 ± | ND | 1.9 ± | 7.6 ± | 496.35 | 29.35 | 1.4 | ND | 18.25 |
6 | Carrot | 27.48 | 0.325 ± | ND | 1.5 ± | 6.98 ± | 70.35 | 12.23 | 1.25 | ND | 18.05 |
7 | Cauliflower | 42.56 | 0.11 | 0.2 | 1.96 | 4.14 ± | 90.39 | 16.81 | 1.12 | 0.34 | 27.27 |
8 | Chenopodium | 111.87 | 0.2 ± | 0.22 | 2± | 8.02 ± | 198.23 | 57.37 | 6.13 | ND | 44.92 |
9 | Coriander | 233.27 | 0.15 ± | 0.08 | 2.67 | 11.38 ± | 419.6 | 40.61 | 1.7 | 1.23 | 43.11 |
10 | Fenugreek | 193.34 | 0.11 ± | 0.13 | 4.48 | 9.06 | 444.09 ± 261.32 | 39.43 | 1.81 | 0.42 | 37.05 |
11 | Mustard | 333.88 | 0.33 ± | 0.1 | 6.39 | 10.51 | 730.72 ± 274.58 | 57.31 | 2.58 | 4.01 | 41.81 |
12 | Onion | 20.05 | 0.13 ± | -- | 1.38 | 5.88 | 51.83 | 13.15 ± | 2.35 | 0.15 | 20.7 |
13 | Onion leaves (n=4) | 47.95 | ND | ND | 1.45 | 5.35 | 98.45 | 11.3 ± | 0.95 | ND | 15.55 |
14 | Potato | 26.55 | ND | ND | 3.35 | 6.45 | 100.8 | 8.7 | 1.85 | 0.8 | 16.2 |
15 | Pumpkin | 13.85 | 0.05 ± | 0.15 | 2.05 | 20.4 | 32.5 | 30.35 | 2.75 | ND | 70.35 |
16 | Radish | 60.01 | 0.19 ± | 0.2 | 4.74 | 3.54 | 103.30 | 15.69 | 1.09 | 0.16 | 20.54 |
17 | Round guard (n=4) | 15.2 | ND | 0.15 | 1.6 | 12.9 | 63.5 | 17.65 | 2.3 | ND | 49.85 |
18 | Spinach | 319.94 | 0.47 | 0.13 | 4.04 | 10.72 | 487.96 ± 296.72 | 86.98 | 1.87 | 1.57 | 40.19 |
19 | Turnip | 158.4 | 0.2 ± | ND | 2.6 | 3.45 | 166.9 | 16.35 | 0.85 | ND | 20.7 |
High accumulation of Fe was found in nearly all vegetable samples, whereas it exceeded the permissible limit (425 mg kg-1) of FAO/WHO in mustard, fenugreek, spinach, and carrot leaves.41 The minimum concentration of iron was observed in pumpkin (32.5 mg kg-1) and the highest concentration was observed in mustard (730.72 mg kg-1). The average concentration of Fe reported in bitter gourd, brinjal, and tomato in our study is higher than the concentration reported in various parts of India.42,43 The mean concentrations of iron reported here are higher than the concentration in the vegetables observed by Khan et al.41
Concentration of Manganese was maximum in spinach (86.99mg kg-1)) and the minimum concentration in potato (8.7 mg kg-1). The mean concentration of Mn in vegetable samples was within the permissible limit of WHO/ FAO.41 Same mean concentration for Mn in the vegetables was reported by Khan et al.41 A high concentration of Mn was reported in the present study in coriander,43 spinach,44 and fenugreek.42
The mean concentrations of Ni were above the permissible limit in pumpkin, round gourd, potato, and onion bulb. The lowest Ni concentration (mg kg-1) was found in beetroot (0.8) and the highest was in chenopodium (6.13). The average concentration of Ni reported in mustard in the present study is 2 times higher than the concentration reported in wastewater irrigated mustard from Varanasi, India.45 Ni concentration in our study is higher than the concentration reported in spinach, cabbage, cauliflower, coriander, carrot, beetroot, and onion 46, onion,47 radish,48 potato, and mustard.45 Mustard, fenugreek, coriander leaves, and spinach were found to contain high levels of lead. Pb levels in cauliflower, radish, brinjal, potato, and onion were higher than allowed by FAO/WHO guidelines. According to FAO/WHO,38 the permissible limit of lead for leafy vegetables is 0.3 mg/kg, whereas the limit for tuberous and bulbous vegetables is 0.1 mg/kg.
The minimum concentration of lead (mg kg-1) was found in onion bulbs (0.15) while the maximum in mustard (4.01). Pb concentration in spinach, potatoes, cabbage, and cauliflower in present study was higher than the concentration reported by Bo et al.48 Prenatal exposure to lead causes abnormality in offspring, reduces the Ca2+ ion absorption in the body and affects the soft tissues like the brain, heart, kidney, and central nervous system; and is also known as mutagen, teratogen, and carcinogens.49-51
Mean concentration of zinc (mg kg-1) was found minimum in onion leaves (15.55) and the maximum was in Pumpkin (70.35). Pumpkin exceeded the permissible limits of Zn (60 mg kg-1) prescribed by FAO/WHO standards.34 The average concentration of Zn reported in radish and mustard was 2 times higher than the concentration reported in Varanasi, India,45 and in potato it was four times higher than the concentration reported in India and China.48,45 Zn concentration in our study is higher than the concentration reported in cabbage and onion,52,47 Spinach,53,46,43,54 radish, beetroot, and mustard,45 potato,52 and brinjal.53
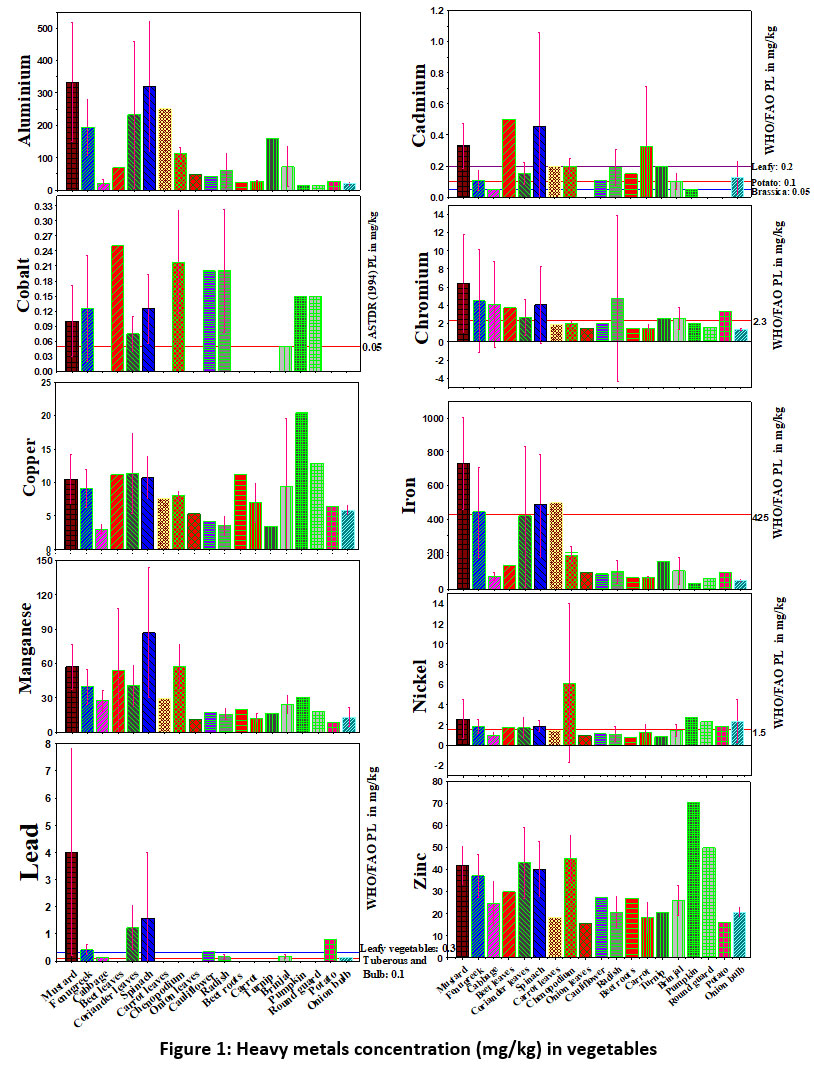 | Figure 1 Heavy metals concentration (mg/kg) in vegetables
|
Statistical analysis of heavy metals
Pearson correlation Matrix showed significantly positive correlation (p<0.05) of Al, Fe, Mn with Pb, and Cu with Zn (Table 3). Three principal components were obtained by principal component analysis using varimax with Kaiser Normalization. Percentages of variance explained by three principal components are 36.70%, 24.16%, and 17.03% with the cumulative percentage of 77.90 % (Table 4). PC 1 has shown the maximum loading of Al, Fe, Cr, Pb, and Mn indicating their mixed source of origin i.e. natural as well as anthropogenic. Industries are potential sources of Al, Fe, Cr, Pb, and Mn while Al, Fe, and Mn are also present in the earth's crust relatively in abundant amounts. PC 2 is strongly correlated with Zn and Cu along with some amount of Ni. Zn and Cu can be added by the application of fertilizers in the soil while Ni may be present as a contaminant in fertilizer, irrigation water, and sewage sludge. Air can also be a potential source of metals deposition in the vegetables. PC 3 showed the maximum loading of Co and Cd. The dendrogram (Figure 2) and PCA (Figure 4) suggested the formation of two primary clusters i.e. Al-Fe-Pb and Cu-Zn, indicating a mixed source of anthropogenic input for these metals which can be industrial and agricultural. Dendrogram using linkage between groups method was used to classify the studied vegetables into several groups as shown in the Figure 3. The vegetables were classified into different groups depending upon average heavy metal concentrations in them. Cluster analysis showed a strong significant correlation among all the vegetables except for turnip, pumpkin, and round gourd by forming primary clusters with a distance of 5 on the scale. Further, it can be seen that most of the leafy vegetables are grouped together like mustard, fenugreek, coriander leaves, carrot leaves, and fruit vegetables that are pumpkin and round guard were placed in the same group (Figure 3).
Table 3: Inter-metal Pearson’s correlation for winter vegetables collected from NCR, India
Heavy metal | Al | Cd | Co | Cr | Cu | Fe | Mn | Ni | Pb | Zn |
Al | 1 | |||||||||
Cd | .512* | 1 | ||||||||
Co | .050 | .325 | 1 | |||||||
Cr | .535* | .376 | .281 | 1 | ||||||
Cu | .092 | .079 | .297 | -.063 | 1 | |||||
Fe | .963** | .438 | .052 | .594** | .128 | 1 | ||||
Mn | .710** | .676** | .465* | .492* | .364 | .660** | 1 | |||
Ni | .108 | .070 | .451 | -.024 | .309 | .132 | .442 | 1 | ||
Pb | .698** | .336 | .047 | .695** | .144 | .767** | .509* | .113 | 1 | |
Zn | .164 | -.001 | .525* | .093 | .832** | .181 | .482* | .535* | .223 | 1 |
Table 4. PCA analysis for winter vegetables
Heavy metal | Factor 1 | Factor 2 | Factor 3 |
Al | .925 | .061 | .115 |
Cd | .467 | -.132 | .691 |
Co | -.052 | .409 | .793 |
Cr | .712 | -.102 | .296 |
Cu | .079 | .883 | -.033 |
Fe | .948 | .100 | .053 |
Mn | .634 | .367 | .568 |
Ni | -.008 | .612 | .390 |
Pb | .876 | .131 | -.025 |
Zn | .114 | .949 | .131 |
Eigen Value | 3.671 | 2.416 | 1.703 |
% of Variance | 36.707 | 24.161 | 17.029 |
Cumulative % | 36.707 | 60.868 | 77.897 |
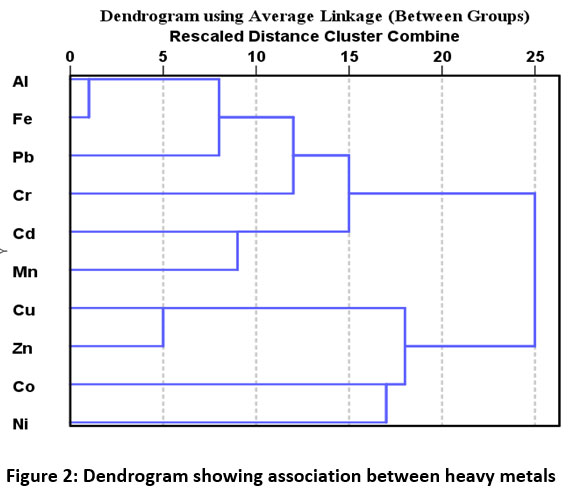 | Figure 2: Dendrogram showing association between heavy metals
|
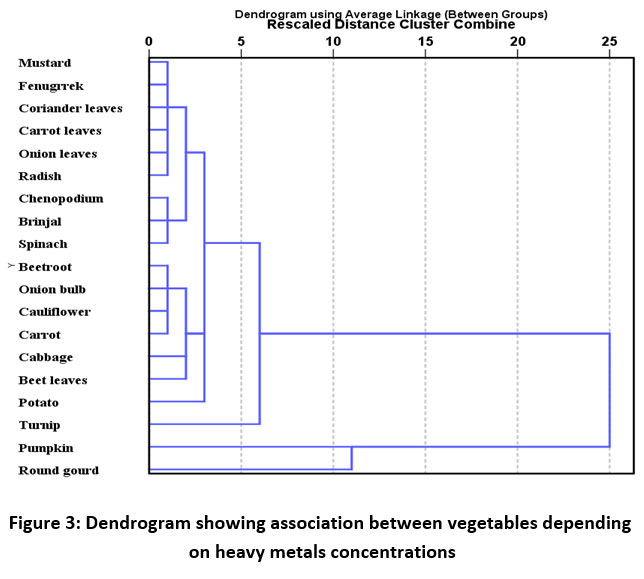 | Figure 3: Dendrogram showing association between vegetables depending on heavy metals concentrations
|
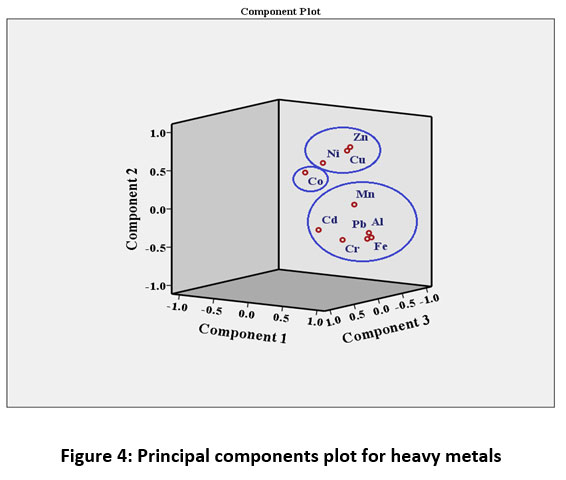 | Figure 4: Principal components plot for heavy metals
|
Metal Pollution Index (MPI) Assessment
A metal pollution index is an effective tool for assessing metal pollution in vegetables. Among all collected different vegetable samples, the minimum value of MPI was found in brinjal while maximum in carrot leaves (Figure. 5). MPI in the different collected vegetables from NCR, India followed the decreasing order as carrot leaves, mustard, spinach, chenopodium, beet leaves, turnip, potato, round guard, coriander leaves, carrot, beetroot, fenugreek, cauliflower, onion leaves, pumpkin, onion bulb, cabbage, radish and brinjal with MPI values as 11.32, 10.32, 9.12, 8.55, 8.07, 7.8, 7.68, 7.04, 6.41, 6.06, 6.05, 5.9, 5.29, 4.77, 4.55, 3.6, 3.59, 3.43 and 3.30, respectively.
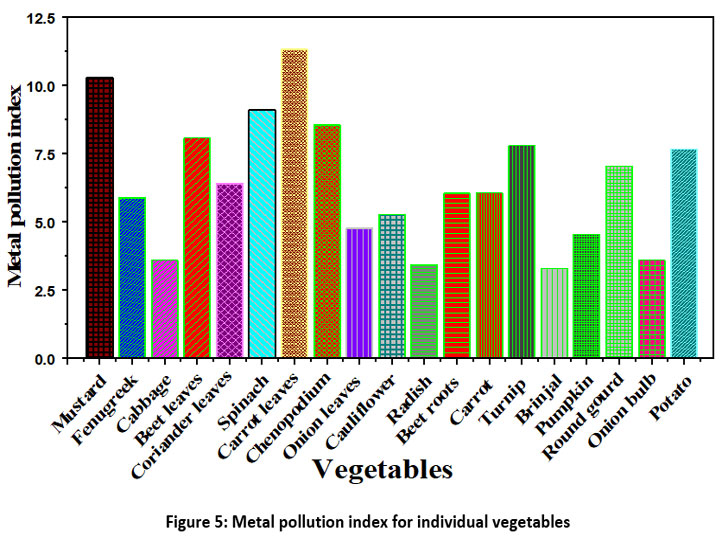 | Figure 5: Metal pollution index for individual vegetables
|
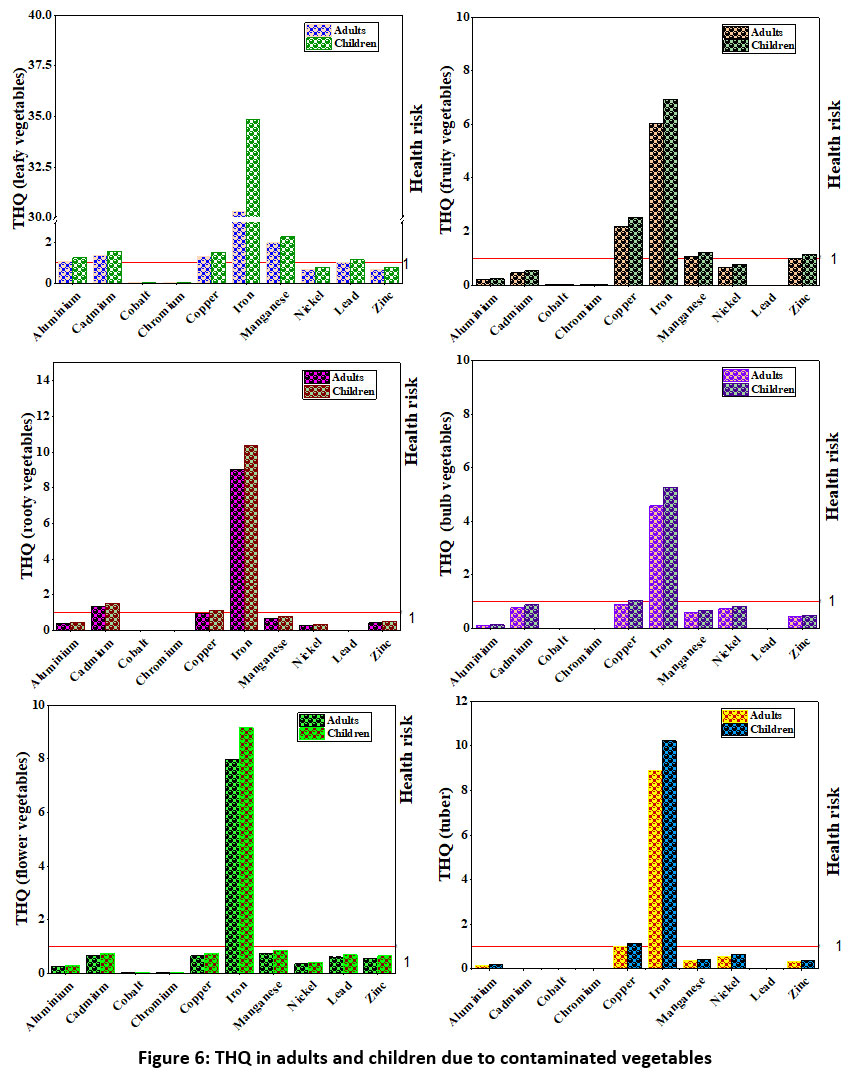
Health risk assessment
The THQ for non-carcinogenic risk of the studied metal from consuming vegetables for adults and children are shown in the Figure 6. The estimation of THQ provides an indication of the potential risk probability in a population exposed to the toxicant. Among the studied metals THQ value of Al exceeded the threshold value of one for adults and children in mustard, fenugreek, coriander leaves, spinach, carrot leaves, radish, carrot, and turnip while THQ was greater than one for beetroot in children only. THQ was greater than one for Cd in adults and children both by the use of mustard, beet leaves, spinach, and carrot leaves, while it was greater than one for children only due to the consumption of coriander leaves and chenopodium. THQ was less than one for Cobalt in all the vegetable samples. THQ for Cr was greater than one for beetroot and carrot in adults and children. THQ value for Ni and Pb was less than one in Chenopodium and mustard for adults and children. THQ due to Zn was greater than one in radish, carrot, turnip, pumpkin, and round guard for adults and children while it was greater than one in children in case of coriander leaves, chenopodium, and beetroot. THQ was less than one for Cu, Fe, and Mn in Mustard, fenugreek, beet leaves, coriander leaves, spinach, carrot leaves, and chenopodium for adults and children. THQ was less than one for Cu in radish and onion bulb and for Fe in onion leaves, brinjal, and potato for children. Cu showed higher THQ values for round guard and potato, and Mn has THQ less than one for brinjal and pumpkin. The THQ was high for leafy vegetables due to all studied heavy metals except Co and Cr, and in fruit vegetables, the THQ due to Fe, Cu, Mn, and Zn was higher than one. THQ values ??were higher than the safe limits for Fe, Mn, and Cu in root vegetables. The presence of Fe in the bulb, flower, and tuber group of vegetables can pose a significant health risk to the consumer. The total target hazard quotient expresses the non-carcinogen effect of multi-metals in a vegetable sample. The highest TTHQ value was observed for mustard in adults (23.45) and children (26.96). The total hazard index (HI) is the sum of individual THQ for vegetables. In the present study, HI was 140.85 (less than one) for adults and 170.11 (less than one) for children. Thus potential health risks from exposure to the vegetable are of great concern in the study area. THQ was high for leafy vegetables due to contamination of Al, Cd, Fe, Mn, Cu, and Pb. THQ was higher than one for Fe, Mn and Cu in fruit, for Fe and Cu in bulb and tuber, for Fe in flowery, and for Cd, Cu, and Fe in rooty vegetables.
 | Figure 6: THQ in adults and children due to contaminated vegetables
|
Discussion
The average concentration of Cd reported in the present study was higher than the concentration reported in by other researcher in coriander and fenugreek,55 cabbage,47 carrot,46 pumpkin.56 Chronic exposure to cadmium can affect the pancreas, kidneys, lungs, urinary bladder, breast, and prostate and other health issues.1,50 The concentrations of cadmium reported in the current study are higher in spinach54 and carrot57 Chronic exposure to Cobalt causes allergy while a high dose of it can cause lung fibrosis and can destroy the male reproductive system. Cobalt also affects the heart, thyroid, liver, and kidney.58,1 A high concentration of Cr was found in the present study as compared to the other studies in cabbage, carrot, onion and beetroot,46 spinach and brinjal,53 radish, potatoes and mustard,45 cauliflower and radish,48 fenugreek,55 and cabbage and onion47 and spinach.54 The mean concentration of Cu in different vegetable samples was higher in the present study than the concentration reported in cabbage and onion,52,47 cauliflower, and radish,48,45 beetroot, radish, and mustard,45 brinjal,53 potatoes,52 and spinach.48 Copper can cause mental disorders such as Alzheimer's. It also affects hepatic, renal, and central nervous systems.1,59,60 Higher uptake of iron increases the chances of the formation of gastrointestinal ulceration and the development of strictures in humans. Children are more susceptible to iron toxicity.50 Fe and Al are present in abundant amounts in the earth's crust as well as used in the inorganic fertilizer and industries which may result in high accumulation of these metals in the vegetables. As a micronutrient, nickel is a component of the urease enzyme molecule and catalyses the metabolism of nitrogen.61 Except for cabbage, carrot, and onion leaves, the mean concentration of nickel (mg kg-1) in all of the collected leafy vegetables was higher than the allowable limit of 1.5. Nickel induces allergic contact dermatitis (ACD) and adult respiratory disease syndromes (ARDS).
The high value indicating the potential non-carcinogen may occur due to the consumption of mustard in the population. TTHQ value due to consumption of vegetables in the study area was in the following decreasing order mustard, spinach, coriander, carrot leaves, chenopodium, fenugreek, beet leaves, pumpkin, turnip, brinjal, round guard, carrot, beetroot, cauliflower, radish, onion bulb, cabbage, potato, onion leaves respectively.
Stricter environmental laws and routine monitoring of industrial effluents to verify compliance are preventative methods to lessen heavy metal contamination in industrial regions. Heavy metal emissions can be reduced by using green chemistry and closed-loop systems, two cleaner production approaches.62 Furthermore, heavy metals in soil can be immobilised by environmentally benign methods including phytoremediation and the application of biochar, which lowers their bioavailability.63 Proactive industrial practices, employee awareness and training programs can help to prevent pollution commercially as well as environmentally.
Conclusion
Fe was the most prominent metal found in the vegetables while Co was the least reported metal in the present study. The order of relative abundance of heavy metals was higher in Fe, followed by Al, Mn, Zn, Cu, Cr, Ni, Pb, Cd, Co. Most of the vegetables exceeded the permissible limit of heavy metals prescribed by FAO/WHO standards. Statistical analysis supported the formation two primary clusters (Al-Fe-Pb and Zn-Cu) were observed in vegetables. Multivariate analysis showed that industrial activities are major contributor of Al, Fe, Cr, Cd, Ni, Pb, Zn and Mn in the vegetable samples. Metal pollution index was found to be high for leafy vegetables. High MPI values for leafy vegetables are pointing towards their high tendency of metal accumulation. Mint consumption may pose a health risk due to the high contents of Al, Cd, Cu, Fe, Mn, and Pb. TTHQ value for adults and children was 45.42 and 52.21 for the mint which is 45 and 52 times higher than the threshold value. The total target hazard (TTHQ) value was greater than one in all the vegetables suggesting potential non-carcinogenic risk due to the presence of multi-metal in vegetable samples.
Acknowledgment
All the authors wish to thanks to Deenbandhu Chhotu Ram University of Science and Technology for providing research environment.
Funding Sources
The author(s) received no financial support for the research, authorship, and/or publication of this article.
Conflict of Interest
The authors do not have any conflict of interest.
Data Availability Statement
The manuscript incorporates all datasets produced or examined throughout this research study.
Ethics Statement
This research did not involve human participants, animal subjects, or any material that requires ethical approval.
Informed Consent Statement
This study did not involve human participants, and therefore, informed consent was not required.
Author Contributions
Jyoti Rani performed the experiments and has been written original draft,
Sudesh Chaudhary and Tripti Agarwal supervised and reviewed the manuscript,
Sonia, Deepak and Abhilasha perfomed reviewing and editing.
References:
- Achparaki M, Thessalonikeos EH., Tsoukali O, Mastrogianni E, Zaggelidou F, Chatzinikolaou N, Vasilliades RN. Heavy metals toxicity. Aristotle Univ Med J. 2012; 39 (1): 29-34.
- Shefa ST and H´eroux P, Both physiology and epidemiology support zero tolerable blood lead levels. Toxicol. Lett. 2017; 280: 232–237.
CrossRef - Leso V, and Iavicoli I, Palladium nanoparticles: toxicological effects and potential implications for occupational risk assessment. Int. J. Mol. Sci. 2018; 19(2): 503.
CrossRef - Abdul KSM, Jayasinghe SS, Chandana EPS, Jayasumana C and De Silva PMCS. Arsenic and human health effects: A review. Environ. Toxicol. Pharmacol. 2015; 40(3): 828–846.
CrossRef - Kapaj S, Peterson H, Liber K and Bhattacharya P. Human health effects from chronic arsenic poisoning–a review. J. Environ. Sci. Health Part A Tox. Hazard. Subst. Environ. Eng. 2006; 41(10): 2399–2428.
CrossRef - Obiora SC, Chukwu A and Davies TC. Heavy metals and health risk assessment of arable soils and food crops around Pb-Zn mining localities in Enyigba, southeastern Nigeria. J. African Earth Sci. 2016; 116: 182–189.
CrossRef - Rani J, Chaudhary S, & Agarwal T. Impact of industrialization on heavy metals contamination in agricultural soils of Sonepat, a satellite township of New Delhi, India. Sustain. Agri, Food and Environ. Res. 2023:12(1).
CrossRef - Moussa L, Hassan HF, Savvaidis IN, and Karam L. Impact of source, packaging and presence of food safety management system on heavy metals levels in spices and herbs. PloS One. 2024;19(8): e0307884.
CrossRef - Najmi A, Albratty M, Al-Rajab AJ, Alhazmi HA, Javed SA, Ahsan W, Rehman ZU, Hassani R and Alqahtani SS, Heavy Metal Contamination in Leafy Vegetables Grown in Jazan Region of Saudi Arabia: Assessment of Possible Human Health Hazards. Int. J. Environ. Res. Public. Health 2023; 20(4): 2984.
CrossRef - Tchounwou PB, Yedjou CG, Patloll AK, and Sutton DJ. Heavy metals toxicity and the environment. In: Luch A, Molecular, Clinical and Environmental Toxicology. Experientia Supplementum, 101. Berlin: Springer, Basel; 2012: 133-164. https://doi.org/10.1007/978-3-7643-8340-4_6 (Accessed on 9/05/2025).
CrossRef - Li?ina V, Akši? MF, Tomi? Z, Trajkovi? I, Anti?Mladenovi? S, Marjanovi? M and, Rinklebe J. Bioassessment of heavy metals in the surface soil layer of an opencast mine aimed for its rehabilitation. J. Environ. Manage. 2017; 186: 240–252.
CrossRef - Gupta DK, Corpas FJ, and, Palma JM. Metalloenzymes Involved in the Metabolism of Reactive Oxygen Species and Heavy Metal Stress. In: Gupta, D., Corpas, F., Palma, J. (eds) Heavy Metal Stress in Plants. Spain: Springer, Berlin, Heidelberg; 2013: 1-17. https://doi.org/10.1007/978-3-642-38469-1_1 (Accessed on 09/05/2025).
CrossRef - Zhang RH, Li ZG, Liu XD, Wang BC, Zhou GL, Huang XX, Lin CF, Wang, AH and Brooks M. Immobilization and bioavailability of heavy metals in greenhouse soils amended with rice straw-derived biochar. Ecol. Eng. 2017; 98: 183–188.
CrossRef - Bathla S, and Jain T. Heavy Metals Toxicity. International Journal of Health Sciences and Research. 2016; 6(5): 361–368.
- Borjac J, El Joumaa M, Kawach R, Youssef L and Blake DA. Heavy metals and organic compounds contamination in leachates collected from Deir Kanoun Ras El Ain dump and its adjacent canal in South Lebanon. Heliyon. 2019; 5(8).
CrossRef - Kwon JC, Nejad ZD, and, Jung MC. Arsenic and heavy metals in paddy soil and polished rice contaminated by mining activities in Korea. Catena. 2017; 148: 92–100.
CrossRef - Islam MS, Ahmed MK, and, Habibullah AMM. Apportionment of heavy metals in soil and vegetables and associated health risks assessment. Stoch. Environ. Res. Risk Assess. 2016; 30: 365–377.
CrossRef - Khan MN, Aslam MA, Muhsinah AB, and Uddin J. 2023 Heavy Metals in Vegetables: Screening Health Risks of Irrigation with Wastewater in Peri-Urban Areas of Bhakkar, Pakistan. Tox. 2023, 11(5), 460.
CrossRef - Shakya PR, and Khwaounjoo NM. Heavy Metal Contamination in Green Leafy Vegetables Collected from Different Market Sites of Kathmandu and their associated health risks. Scintific World. 2013; 11(11): 37–42.
CrossRef - Amarloei A, Mirzaei SA, Noorimotlagh Z, Nazmara S, Nourmoradi H, Fard NJH, Heidari M, Mohammadi-Moghadam F and Mazloomi S. Human health risk assessment of toxic heavy metals in summer crops and vegetables: a study in Ilam Province, Iran. J. Environ. Health Sci. Eng. 2024; 22(1): 139–148.
CrossRef - Ismael DS and Goran SMA. Health risk assessment of heavy metals in some vegetables-Erbil City-Kurdistan Region of Iraq. Environ. Monit. Assess. 2024; 196(5); 417.
CrossRef - Jafarian-Dehkordi A. and Alehashem M, Heavy metal contamination of vegetables in Isfahan, Iran. Res. Pharm. Sci. 2013; 8(1): 51–58.
- Zhou H, Yang WT, Zhou X, Liu L, Gu JF, Wang WL, Zou JL, Tian T, Peng PQ and Liao B H. Accumulation of heavy metals in vegetable species planted in contaminated soils and the health risk assessment. Int. J. Environ. Res. Public. Health. 2016; 13(3): 289.
CrossRef - El-Nakat J. Measurement of levels of heavy metal contamination in vegetables grown and sold in selected areas in Lebanon. Jordan J. Chem. 2009; 4(3): 303–315.
- Nasreddine L, Hwalla N, El Samad O, LeBlanc JC, Hamz´e M, Sibiril Y and Parent-Massin D. Dietary exposure to lead, cadmium, mercury and radionuclides of an adult urban population in Lebanon: a total diet study approach. Food Addit. Contam. 2006; 23(6): 579–590.
CrossRef - Akoury E, Baroud C, El Kantar S, Hassan H and Karam L. Determination of heavy metals contamination in thyme products by inductively coupled plasma mass spectrometry. Toxicol. Rep. 2022; 9: 1962–1967.
CrossRef - El Hawari K, El Khatib M, Zeineh M, Beh D, Jaber F. and Mokh S. Contaminant and residue profiles in Lebanese food: a comparative analysis with global standards. Food Addit. Contam. Part A 2024; 41(9): 1077–1098.
CrossRef - El Kayal W, Darwiche L, Farhat YA, Hdeib M, Al Jardaly R, Shbaro M and Iskandar CF Agricultural Mitigation Strategies to Reduce the Impact of Romaine Lettuce Contamination. Plants Basel Switz. 2024; 13(17): 2460.
CrossRef - El Daouk S, Pineau A, Taha M, Ezzeddine R, Hijazi A and Al Iskandarani M Aluminum exposure from food in the population of Lebanon. Toxicol. Rep. 2020; 7: 1025–1031.
CrossRef - MSME-Development Institute. State Industrial Profile of Haryana 2015-16. Karnal, Haryana: Ministry of Micro, Small and Medium Enterprises, Government of India; 2016.
- Moore PD and Chapman SB. Methods in plant ecology. 2nd ed. Oxford: Blackwell Scientific; 1986. https://cir.nii.ac.jp/crid/1130282270348410880 (Accessed on 09/05/2025)
- Allen SE, Grimshaw HM, Rowland AP. Chemical analysis. In: Moore, P. D., Chapman, S. B. (Eds.), Methods in Plant Ecology. Oxford, London: Blackwell Scientific Publication; 1986: 285-344
- Sharma RK, Agrawal M, and Marshall F. Heavy metal contamination of soil and vegetables in suburban areas of Varanasi, India. Ecotoxicol Environ Saf. 2007; 66(2): 258-266.
CrossRef - Sharma RK, Agrawal M. and Marshall F. Heavy metal Cu, Zn, Cd and Pb contamination of vegetables in urban India: A case study in Varanasi. Environ. Pollut. 2008; 154(2): 254-263.
CrossRef - Giri S and Singh AK. Ecological and human health risk assessment of agricultural soils based on heavy metals in mining areas of Singhbhum copper belt, India. Hum. Ecol. Risk Assess. 2017; 23(5): 1008–1027.
CrossRef - Li F, Shi W, Jin Z, Wu H and, Sheng GD. Excessive uptake of heavy metals by greenhouse vegetables. J. Geochemical Explor. 2017; 173: 76–84.
CrossRef - Antoine JMR, Fung LAH, and Grant CN. Assessment of the potential health risks associated with the aluminium, arsenic, cadmium and lead content in selected fruits and vegetables grown in Jamaica. Toxicology Reports. 2017; 4: 181–187.
CrossRef - FAO/WHO. CODEX ALIMENTARIUS- International food standards. General standards for contaminants and toxins in food and feed. CXS 193-1995; 1-77.
- Chabukdhara M, Munjal A, Nema AK, Gupta SK and Kaushal, RK. Heavy metal contamination in vegetables grown around peri-urban and urban-industrial clusters in Ghaziabad, India. Hum. Ecol. Risk Assess. 2015; 22(3): 736–752.
CrossRef - Manzoor J, Sharma M, and Wani KA. Heavy metals in vegetables and their impact on the nutrient quality of vegetables: A review. J. Plant Nutr. 2018.; 41(13): 1744–1763.
CrossRef - Khan MU, Malik RN, Muhammad S, Ullah F and, Qadir A. Health risk assessment of consumption of heavy metals in market food crops from Sialkot and Gujranwala districts, Pakistan. Hum. Ecol. Risk Assess. An Int. J. 2015; 21(2): 327–337.
CrossRef - Arora M, Kiran B, Rani S, Rani A, Kaur B, and Mittal N. Heavy metal accumulation in vegetables irrigated with water from different sources. Food Chem. 2008; 111(4): 811–815.
CrossRef - Punetha D, Tewari G, Pande C, Kharkwal GC and Tewari K. Investigation on heavy metal content in common grown vegetables from polluted sites of Moradabad district, India. J. Indian Chem. Soc. 2015; 92(1): 97–103.
- Priya ES, Sunil G, Shivaiah K, Gaddameedi A and, Kumar A. Extent of heavy metal contamination in leafy vegetables, soil and water from surrounding of Musi River, Hyderabad, India. J. Ind. Pollut. Control. 2014; 30(2): 289–293.
- Verma P, Agrawal M and Sagar R. Assessment of potential health risks due to heavy metals through vegetable consumption in a tropical area irrigated by treated wastewater. Environ Syst Decis. 2015; 35: 375-388.
CrossRef - Guerra F, Trevizam AR, Muraoka T, Marcante NC and Caniatti-Brazaca SG. Heavy metals in vegetables and potential risk for human health. Sci. Agric. 2012; 69: 54–60.
CrossRef - Eliku T and Leta S. Heavy metals bioconcentration from soil to vegetables and appraisal of health risk in Koka and Wonji farms, Ethiopia. Environ. Sci. Pollut. Res. 2017; 24: 11807–11815.
CrossRef - Bo S, Mei L, Tongbin C, Yuanming Z, Yunfeng X, Xiaoyan L and Ding G. Assessing the health risk of heavy metals in vegetables to the general population in Beijing, China. J Environ. Sci. 2009; 21(12): 1702–1709.
CrossRef - Bhowmik D, Kumar KPS, and Umadevi M. Lead poisoning- the future of Lead’s impact alarming on our society. Pharma Innov. 2012; 1(6, Part A): 40–49.
- Jaishankar M, Tseten T, Anbalagan N, Mathew BB, and Beeregowda KN. Toxicity, mechanism and health effects of some heavy metals. Interdiscip. Toxicol. 2014; 7(2): 60–72.
CrossRef - Rani J, Agarwal T, & Chaudhary S. Evaluation of Heavy Metals in Vegetables and their Associated Health Risk through the consumption of Vegetables in the National Capital Region, India. Eco. Env. & Cons. 2021; 28(3): 1516-1525.
CrossRef - Roba C, Ro?u C, Pi?tea I, Ozunu A and Baciu C. Heavy metal content in vegetables and fruits cultivated in Baia Mare mining area (Romania) and health risk assessment. Environ. Sci. Pollut. Res. 2016; 23: 6062–6073.
CrossRef - Chary NS, Kamala CT, and Raj DSS. Assessing risk of heavy metals from consuming food grown on sewage irrigated soils and food chain transfer. Ecotoxicol. Environ. Saf. 2008; 69(3): 513–524.
CrossRef - Ahmed S, Mahdi, MM, Nurnabi M, Alam MZ, Choudhury TR. Health risk assessment for heavy metal accumulation in leafy vegetables grown on tannery effluent contaminated soil, Toxicology Reports. 2022; 9: 346–355.
CrossRef - Dheri GS, Brar MS and Malhi SS. Heavy-metal concentration of sewage-contaminated water and its impact on underground water, soil, and crop plants in alluvial soils of northwestern India. Commun. Soil Sci. Plant Anal. 2007; 38(9-10): 1353–1370.
CrossRef - Antoine JMR, Fung LAH and Grant CN. Assessment of the potential health risks associated with the aluminium, arsenic, cadmium and lead content in selected fruits and vegetables grown in Jamaica. Toxicol Rep. 2017; 4: 181–187.
CrossRef - Chowdhury AI, Shill LC, Raihan MM, Rashid R, Bhuiyan MNH, Reza S and Alam MR Human health risk assessment of heavy metals in vegetables of Bangladesh. Sci Rep. 2024; 14(1):15616.
CrossRef - Agency for Toxic Substances and Disease Registry (ATSDR). Public Health Statement: Cobalt. Atlanta, GA: U.S Department of Health and Human Services, Public Health Service; 2004.
- Koupaie EH, and Eskicioglu C. Health risk assessment of heavy metals through the consumption of food crops fertilized by biosolids: A probabilistic-based analysis. J. Hazard. Mater. 2015; 300: 855–865.
CrossRef - Rani J, Chaudhary S, & Agarwal T, Pesticide contamination in cauliflower and related health risk assessment in Gurugram, India. Holist Approach Environ. 2022; 12(3):110-116.
CrossRef - Nagajyoti PC, Lee KD and Sreekanth TVM. Heavy metals, occurrence and toxicity for plants: a review. Env. Chem Lett 8, 2010; 199–216.
CrossRef - Ali H, Khan E and Sajad MA. Phytoremediation of heavy metals—concepts and applications. Chemosphere. 2013; 91(7): 869-881.
CrossRef - Beesley L, Moreno-Jiménez E and Gomez-Eyles JL. Effects of biochar and greenwaste compost amendments on mobility, bioavailability and toxicity of inorganic and organic contaminants in a multi-element polluted soil. Environ Pollut. 2010; 158(6): 2282-2287.
CrossRef


