Heavy Metal Concentration in Some Common Spices Available at Local Market as Well as Branded Spicy in Chittagong Metropolitan City, Bangladesh
Prabhangshu Kumer Das1 , Milton Halder1 * , A.S.M. Mujib1 , Faridul Islam1 , Abu Sayeed Mohammad Mahmud1 , Samina Akhter1 and J.C. Joardar2
http://dx.doi.org/10.12944/CWE.10.1.12
Copy the following to cite this article:
Das P. K, Halder M, Mujib A. S. M, Islam F, Mahmud A. S. M, Akhter S, Joardar J. C. Heavy Metal Concentration in Some Common Spices Available at Local Market as Well as Branded Spicy in Chittagong Metropolitan City, Bangladesh. Curr World Environ 2015;10(1) DOI:http://dx.doi.org/10.12944/CWE.10.1.12
Copy the following to cite this URL:
Das P. K, Halder M, Mujib A. S. M, Islam F, Mahmud A. S. M, Akhter S, Joardar J. C. Heavy Metal Concentration in Some Common Spices Available at Local Market as Well as Branded Spicy in Chittagong Metropolitan City, Bangladesh. Curr World Environ 2015;10(1). Available from: http://cwejournal.org?p=606/
Download article (pdf)
Citation Manager
Publish History
“Spice” can be identified as the dry part of a plant such as roots, leaves and seeds which give a share of food a certain flavor and pungent stimuli.1 The culinary herbs and spices that are used to enhance the flavor of vegetables, soups, stir-fry, and pasta dishes can be derived from the bark, buds, flowers, leaves, fruit, seeds, rhizome, or roots of a plant. By clubbing spices and condiments into one group the International Origination For Standardization (ISO) explain that the term spice or condiment consist of natural plant or vegetable products or mixtures or thereof in whole or group form as are used for imparting flavor, aroma and piquancy to and for seasoning food.2 Spices have been recognized to have some medical properties due to antioxidant and antimicrobial action.3 Many spices have been documented to possess anti-diabetic, anti-inflammatory, and antihypertensive potential.4 Natural food spices such as pepper and mustard have been reported to contain significant quantities of some trace metals.5 These trace metals in spices and medicinal plants play vital role as structural and functional components of metalloprotiens and enzymes in living cells.6 In the last thirty to forty years, primarily for these medicinal values, the use of spices and other herbs has increased markedly in most regions of the world including Asia, Europe and North America. But the addition of spices –that may be contaminated with trace and heavy metals- to food as a habit may result in accumulation of these metals in food chain. Subjecting to trace and heavy metals above the permissible level affect the human health and may result in illness to human fetus, abortion and preterm labor, and mental retardation to children. Adults also may experience high blood pressure, fatigue and kidney and brain troubles. Heavy metals are a element with a mass density greater than 4.5g/cm,3 the essential metal like Iron, cupper, and zinc are very useful for the growth of the boy but high level are intolerable and mercury, lead, cadmium etc are toxic at very low concentration.7 Heavy metal may arrive and pollute plant, vegetables, fruits and canned foods through air, water and soil during cultivation8 and also during industrial processing and packaging.9 The powder of pepper (red), turmeric and coriander spices of the open local market indicated that these are processed by the individual seller. For attracting customer some businessman adds color that may contain heavy metal. These spices may be contaminated if soil contaminated with heavy metals or aerial depositions during drying on the ground or on the roof tops. Some factories may add metal into the seasonings due to wear and tear of the machinery. So, this metal is entering into our food chain through this spicy which is used for our daily life. There is no such research work in Chittagong metropolitan areas regarding to this work but event is concerning for local people due to daily news of multi media. Presence of heavy metals in spicy is need to inform to general mass people for health safety. Keeping this in mind our present study has been designed to investigate some heavy metals (as Zn, Cu, Cr, Mn, Fe) concentration in local market spices as well as branded spices in Chittagong metropolitan city, Bangladesh.
Materials and Methods
Sampling Area
The sampling area was located within Chittagong metropolitan city of Bangladesh. Five sampling sites are shown in below figure 1.
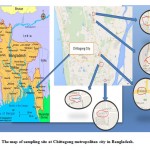 |
Figure 1: The map of sampling site at Chittagong metropolitan city in Bangladesh. Click here to View figure |
Sample Collection
Three types of powder spicy samples were collected from local market of Chittagong Metropolitan City of Bangladesh. Three types were red chili, Coriander and Turmeric. Samples were collected from five different points like as Khatungong (22°20'16.6"N 91°50'39.4"E), Chockbazar (22°21'25.9"N 91°50'14.1"E), Muradpur (22°22'08.9"N 91°49'59.0"E), Baluchora (22°24'35.0"N 91°49'04.5"E), Amanbazar (22°25'17.6"N 91°49'12.4"E). Each sample was collected in five points but in two different shops and total number of each sample were ten. In this way total 30 samples were collected from different places (Table 2). After collection, all samples were leveled and stored in polythene bags and brought in laboratory for analysis. But branded samples were not need to store in polythene bag because they were already packed. Scientific name, common name, and family name of these studied spices are given in following table 1.
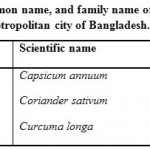 |
Table 1: Scientific name, common name, and family name of collected spices samples from local market of Chittagong metropolitan city of Bangladesh. Click here to View table |
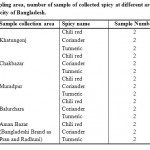 |
Table 2: Sampling area, number of sample of collected spicy at different area of Chittagong metropolitan city of Bangladesh. Click here to View table |
Sample Preparation and Analysis
Samples were dried in oven at 80oC for 8 hours, cooled, and stored in desiccators for the analysis. Initially these samples were digested by using concentrated H2SO4 and 30% H2O2 and the concentration of the heavy metals like as Cr, Cu, Zn, Fe and Mn were measured by using Atomic Absorption Spectrophotometer (Thermo Scientific iCE 3000 Series Atomic Absorption Spectrometer) according to the procedure of Huq and Alam, (2005).10
Statistical Analyses
The results were expressed as the averages of ten replications. The data were subjected to ANOVA. Differences between means were statistically analyzed using Tukey’s test (p<0.05) performed with the SAS. Parson co efficient of correlation (p<0.01, 0.05) was also calculated by using SPSS 16.0. The graphs were drown in excel.
Results and Discussions Zinc Concentration in Spices
In all over the samples average zinc concentration was more or less same shown in figure 2. The zinc concentration was highest in turmeric as 75.5± 22.23 mg/kg followed by red chili as 72.18±5.9 mg/kg and lowest in coriander as 68.78±10.32 mg/kg. The range of zinc concentration in turmeric differed from 48.97 mg/kg (at Baluchora) to 116.89 mg/kg (at Chakbazar). Two branded turmeric samples retained low concentration of zinc compared to others (RADHUNI, PRAN as 50.02, 67.57 mg/kg respectively). The range of zinc concentration in chili red was found from 83.62 mg/kg (at khatungonj) to 65.48 mg/kg(PRAN brand spicy at Aman Bazar). In coriander, the range of Zn concentration in determined samples was 87.89 mg/kg (at Muradpur) to 51.96 mg/kg (at Baluchora). Zinc concentration in RADHUNI and PRAN of coriander was 77.56 mg/kg and 60.78 mg/kg respectively. Zinc is an essential element for human health and in particular, zinc has been recognized as a co-factor of the superoxide dismutase enzyme, which is involved in protection against oxidative processes.11 According to WHO, permissible limits of Zinc is 100 mg/kg for spicy.12 However, the concentration of zinc (mg/kg) for all the spicy was very well below the permissible limit of WHO and may be considered tolerable. Statistically there was no significant (p<0.05) difference among the spicy in respect of Zn concentration.
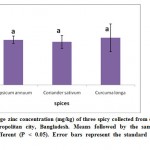 |
Figure 2: Average zinc concentration (mg/kg) of three spicy collected from different places of Chittagong city, Bangladesh. Means followed by the same letter are not significantly different (P < 0.05). Error bars represent the standard deviations (SDs). (n=10). Click here to View figure |
Cupper Concentration in Spices
In all over the samples average cupper concentration varied in narrow range which is shown in figure 3. The cupper concentration was highest in coriander as 10.38±8.65 mg/kg followed by red chili as 9.23±4.45 mg/kg and lowest in turmeric as 8.3±6.53 mg/kg. The range of cupper concentration in coriander differed within a wide range from 0.56 mg/kg (at Baluchora) to 24.90 mg/kg (at khatungonj). Two branded spicy of coriander contained low concentration of cupper compared to others (RADHUNI, PRAN as 7.27, 3.42 mg/kg). The range of cupper concentration in chili red was found from 4.35 mg/kg (at Muradpur) to 17.25 mg/kg (at khatungonj). For turmeric, range of cupper concentration in determined samples was 1.01 mg/kg (RADHUNI brand at Aman bazar) to 17.29 mg/kg of sample collected from Muradpur. According to WHO, permissible limits of cupper is 50 mg/kg for spicy.12 Cu concentration (mg/kg) in all the spicy samples was below the WHO recommended level. Therefore limit of Cu are very tolerable for all the samples collected from Chittagong metropolitan city. Statistically, there was no significant (p<0.05) difference among the spicy in respect of Cu concentration.
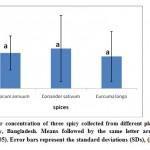 |
Figure 3: Cupper concentration of three spicy collected from different places of Chittagong metropolitan city, Bangladesh. Means followed by the same letter are not significantly different (P < 0.05). Error bars represent the standard deviations (SDs), (n=10). Click here to View figure |
Chromium Concentration in Spices
Cr concentration for all the spicy differed within a very narrow range shown in figure 4. The Cr concentration of spicy as coriander, turmeric, chili red was measured as 41.83±9.6 mg/kg, 39.74± 8.40 mg/kg, 39.43±8.68 mg/kg respectively. The concentration of Cr in coriander was found highest in Khatungonj as 55.68 mg/kg and lowest in brand sample PRAN (31.11 mg/kg) at Amanbazar. In turmeric, Cr concentration varied from 30.96 mg/kg in Muradpur to 53.58 mg/kg in Chackbazar. For PRAN and RADHUNI brand, Cr concentration in turmeric was measured as 38.24 mg/kg, 39.74 mg/kg respectively. But Cr concentration in chili red obtained from 27.43 to 55.29 mg/kg at Muradpur, Khatungonj respectively. However, the permissible limit of Cr recommended by WHO is 30 mg/kg.12 Average Cr concentration (mg/kg) in all the spicy was higher than WHO recommended value. So, it is very concerning for Cr toxicity. Cr has numerous effects due to toxicity like as Kidney disease, Liver disease, Diabetes, Chromate/leather contact allergy, Behavioral or psychiatric conditions such as depression, anxiety, or schizophrenia. Chromium particularly Cr (III) plays an important role in the body function in trace amount but it is toxic in excess amount. The high concentrations of Cr was found in these spicy items may be explained by several factors such as the metal content of the soil, variation in element uptake by different plants, and fertilization and processing techniques.8,9 Statistically, there was no significant (p<0.05) difference among the spicy in regarding to Cr concentration.
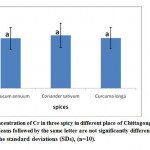 |
Figure 4: The concentration of Cr in three spicy in different place of Chittagong metropoliton city of Bangladesh. Means followed by the same letter are not significantly different (P < 0.05). Error bars represent the standard deviations (SDs), (n=10). Click here to View figure |
Manganese Concentration in Spices
Mn concentration in selected three spicy at different places of Chittagong metropolitan city areas was determined and showed wide range of variation (Figure 5). The highest concentration of Mn was found in turmeric as 76±34.1 mg/kg followed by chili red 74.02±42.6 mg/kg and least in coriander as 52.91±24.62 mg/kg. Among the collected samples of turmeric, highest concentration of Mn was found in brand sample of RADHUNI at Amanbazar (113.05 mg/kg) and least in Muradpur as 34.84 mg/kg. In case of chili red, range of Mn concentration differed within a wide range from 30.46 mg/kg (Brand sample of PRAN at Aman bazaar) to 132.7 mg/kg (Muradpur). Finally, the concentration of Mn in coriander was observed from 31.39 mg/kg in RADHUNI brand at Amanbazar to 104.73 mg/kg at Baluchora local market’s sample. The WHO recommended limit for Mn is 100 mg/kg.12 Mn concentration in most of the spicy was below the WHO recommended limit. It was very well below the limit and can be considered tolerable. But in RADHUNI brand and Baluchara local market spicy samples contained unusual concentration of Mn which exceed the WHO recommended limit. Mn concentration at these two places need to continuous monitoring and need further study to conform it. Statistically, there was no significant (p<0.05) difference among the spicy regarding to Mn concentration.
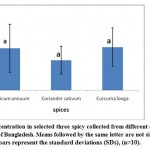 |
Figure 5: Mn concentration in selected three spicy collected from different areas of Chittagong city of Bangladesh. Means followed by the same letter are not significantly different (P < 0.05). Error bars represent the standard deviations (SDs), (n=10). Click here to View figure |
Iron Concentration in Spices
The average iron concentration in all over the sample differed widely shown in figure 6. The iron concentration was highest in turmeric as 840.69 ± 165.52 mg/kg followed by red chili as 807.60±128.89 mg/kg and lowest in coriander as 695.91±251.72 mg/kg. The range of iron concentration in turmeric varied from 605.83 mg/kg (at Muradpur) to 1124.97 mg/kg (at Baluchorr). Two branded spicy of turmeric retained low concentration of iron compared to others (RADHUNI, PRAN as 851.38, 740.17 mg/kg). The range of iron concentration in chili red was found from 559.96 mg/kg (at khatungonj) to 965.43 mg/kg (at Baluchora). In coriander, the range of iron concentration in determined samples varied widely from 100.28 mg/kg (at Muradpur) to 926.9 mg/kg (at Chackbazar). Iron concentration of coriander in RADHUNI and PRAN was 660.38 mg/kg and 475.28 mg/kg respectively. Iron is also an essential element and a common element in humans and plants. They occur predominantly in plants in the form of phytate complexes. They may also be in the form of inorganic iron salts such as Ferric hydroxides. However, the permissible limit of Fe is 300 mg/Kg recommended by WHO.12 Average Fe concentration (mg/kg) in all the spicy in collected from Chittagong metropolitan city of Bangladesh contained high level of Fe and cross the limit of WHO recommended. So, this research report is very much concerning regarding to iron concentration in spicy of Chittagong metropolitan city of Bangladesh. Statistically, there was no significant (p<0.05) difference among the spicy for Fe concentration.
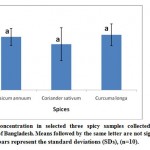 |
Figure 6: Iron concentration in selected three spicy samples collected from Chittagong city of Bangladesh. Means followed by the same letter are not significantly different (P < 0.05). Error bars represent the standard deviations (SDs), (n=10). Click here to View figure |
Comparison Among the Metals Concentrations (Mg/Kg) In Chilli Red
The metal concentration in chili red was differed with in a wide range which is shown in figure 7. The order of these metal concentration was Cu**, p<0.01) and Cr (r=0.689*, p<0.05) concentration significantly correlated with Mn concentration in red chili. Concentration of Cr also significantly (r=0.747*, p<0.05) correlated with Cu concentration in red chili. Pearson correlation coefficient among the metal concentration of red chili, coriander, turmeric, collected from different spot of Chittagong metropolitan city is given in table 3, 4, 5 respectively.
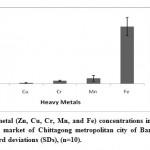 |
Figure 7: Average metal concentrations in Coriandercollected from different local market of Chittagong city.Error bars represent the standard deviations (SDs), (n=10). Click here to View figure |
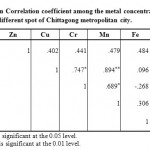 |
Table 3: Pearson Correlation coefficient among the metal concentrations of red chili. Click here to View table |
Comparison Among the Metals Concentrations (Mg/Kg) in Coriander
Fe concentration was the highest among the measured metal concentration (Figure 8). The order of these metal concentration was Cu*, p<0.05) correlated with cu concentration in coriander.
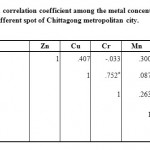 |
Table 4: Pearson correlation coefficient among the metal concentration of coriander collected from different spot of Chittagong metropolitan city. Click here to View table |
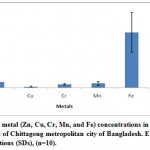 |
Figure 8: Average metals concentrations in Coriander collected from different spot of Chittagong city. Error bars represent the standard deviations (SDs), (n=10). Click here to View figure |
Comparison Among the Metals Concentration (Mg/Kg) in Turmeric
Cu concentration was found lowest in not only turmeric but also in other the spicy like as red chili, coriander (figure 9). The metals order in turmeric spicy was Cu*, p<0.05) and Mn (r= -0.793**, p<0.01) concentration in turmeric and Mn also significantly (r= -0.779**, p<0.01) correlated with Cr concentration of turmeric. But the concentration of cupper significantly and negatively correlated with Mn concentration (r= -0.871**, p<0.01) again Cu also significantly correlated with Cr (r= 0.867**, p<0.01) concentration of turmeric.
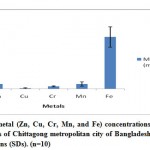 |
Figure 9: Average metal (Zn, Cu, Cr, Mn, and Fe) concentrations in Turmeric collected from different places of Chittagong city. Error bars represent the standard deviations (SDs), (n=10). Click here to View figure |
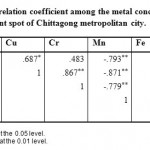 |
Table 5: Pearson correlation coefficient among the metal concentrations of turmeric. Click here to View table |
The results from overall discussion showed that there is no risk for the daily use of the above mentioned spices for Mn, Cu, Zn if taken in limited amount. Excessive use of these could therefore pose a health hazard to consumers. But for Cr and Fe exceeds the permissible limit recommended by WHO, 2005.12 So, it is a very concerning matter for daily use of this spicy. Among the five spots, spicy of khatungonj and chackbazar contained high concentration of heavy metals. It should need under continuous monitoring of local market of these areas to protect food chain contamination and environment pollution of Chittagong metropolitan city.
Acknowledgement
The author acknowledges Phytochemistry Research Division as well was fruit and Vegetable Research Division of BCSIR. Author also acknowledges the Director of BCSIR laboratory of Chittagong, Bangladesh for his cordial co-operation to continue this research work.
References
- Hirasa, K. and Takemasu, M. Spice Science and Technology. Marcel Decker Inc. New York, 1998.
- Manay, S. & Shadaksharaswami, M. Foods-facts and Principles. New Age International Publication, New Delhi, 321-330, 1997.
- Hinneburg I., Damien Dorman H.J., Hiltunen R. Food Chem. 97, 122, 2006
- Srinivasan K. Food Res. Int. 38, 77, 2005.
- Gupta K. K, Bhattacharjee S, Kar S., Chakrabarty S., Thakar P., Bhattacharyya G. and Srivastava S. C. Soil and plant anal. 34, 681-693, 2003.
- Ansari T.M, Ikram N., Najam-ul-Haq M., Fayyaz O., Ghafoor I. and Khalid N. J. Biol. Sci. 4, 95-99, 2004.
- Divrikli U, Horzum N, Soylak M, Elci L. Int. J. Food Sci. Technol., 41,712-716, 2006.
- Millour S, Noel L, Kadar A, Chekri R, Vastel C, Sirot V, Leblanc CJ, Guerin T. Food Chem., 126,1787-1799, 2011.
- Sherman, W. P. and Billing, J. Quarterly Review of Biology, 73, 1 – 47, (1998).
- HUQ, S. I. & ALAM, M. A handbook on analyses of soil, plant and water. BACER-DU, University of Dhaka, Bangladesh, 246. 2005.
- King J.C, Keen C.L. In: Shils M.E, Olsen J.A, Shike M, editors. Zinc Modern Nutrition in Health and Disease, 8th ed. Philadelphia, PA: Lea and Febiger, 1994.
- World Health Organization. "Quality Control Methods for Medicinal Plant Materials", Genava, 2005.


