Assessment of the Quality of Water in Sulaimaniyah City, Kurdistan Region– Iraq
Faisal A. Salih1 * , Nasih Othman1 , Faridon M. Muhidin2 and Attallah O. Kasem1
1
Biomedical Research Unit,
Sulaimani Polytechnic University,
Sulaimaniyah,
00964
Iraq
2
Quality Control The Directortae of Water,
Sulaimaniyah,
00964
Iraq
http://dx.doi.org/10.12944/CWE.10.3.08
Good drinking water quality is essential for the well being of all population. The object of this study was to assess the quality of drinking water in the city of Sulaimaniyah in Iraqi Kurdistan. A total of 2342 water samples from various sources providing water to the city collected during 2014 were analyzed for physiochemical and biological parameters using standard methods. Fifty percent of the samples were from, Dukan project after treatment, 26% from Dukan project before treatment, 8% from Sarchinar, 6% from city storage tanks and networks and 10% were brought by citizens from various sources.The total hardness of the city water at source after treatment was 186.3 (95% CI 179.6, 192.8), TDS was 150.6 (95% CI 149.5, 151.7), and PH was 7.74(95% CI 7.36, 8.12). The total hardness, TDS, turbidity and Calcium were considerably higher in Sarchinar than Dukan (231 vs. 161, 242 vs. 147, 2.7 vs. 1.8 and 72.9 vs. 44.5 mg/l respectively), while Sodium and Potassium were higher in Dukan than Sarchinar (3.4 vs. 1.4 and 1.4 vs. 0.08 mg/l respectively). Samples from the two supply lines from filtrated Dukan water project were compared in relation to physic-chemical characteristics and there were no significant differences in any of the parameters except PH, TDS and turbidity which were different. TDS of Dukan 1 project was slightly higher than Dukan 2 (148.9 vs. 145.9 respectively). Similarly turbidity of Dukan 1 was twice that of Dukan 2 (2.4 vs. 1.2). Overall, the parameter values were within standard ranges except Cl1- which was 19.8 (Iraqi standard 10 ppm) and dissolved oxygen which was 9 ppm (Iraqi standard 7-8 ppm). Microbiological results showed that 973 of the samples (91%) had an MPN of zero, 61 (5.7%) had an MPN of 2.2 and 35 (3.3%) had a higher MPN. The mean chlorination level for all samples was 1.12 (SD 0.44) .We can conclude that both Sarchinar and Dukan waters are acceptable for drinking purposes according to the parameters evaluated. We recommend to include monitoring heavy metals like Hg, Pb, Ni, Cr, Cd, Ag in the future; to consolidate the existing reporting system and to included samples from household tap water for analysis.
Copy the following to cite this article:
Salih F. A, Othman N, Muhidin F. M, Kasem A. O. Assessment of the Quality of Water in Sulaimaniyah City, Kurdistan Region– Iraq. Curr World Environ 2015;10(3) DOI:http://dx.doi.org/10.12944/CWE.10.3.08
Copy the following to cite this URL:
Salih F. A, Othman N, Muhidin F. M, Kasem A. O. Assessment of the Quality of Water in Sulaimaniyah City, Kurdistan Region– Iraq. Curr World Environ 2015;10(3). Available from: http://www.cwejournal.org/?p=12978
Download article (pdf)
Citation Manager
Publish History
Introduction
Good drinking water quality is essential for the wellbeing of all population and essential for their health. According to the WHO about 80% of all the diseases in human beings are related to water.1 Tremendous is increase in the request for clean water due to quick growth of population and the speeded pace of industrialization.2 The increase in population and expansion of economic activities undoubtedly leads to increasing request of water for various purposes. The quality of water is defined in terms of its physical, chemical and biological parameters.3,4 In addition, the physical condition of water (color, taste and odor) strength reduces it undrinkable as it can be disallowed by end-users. For this purpose, water quality evaluation and continuous observing are of highest importance.5,6,7 The estimated individual consumption of drinking water is about 2 liters per day for people weighted 60 kg and one liter per day for children weighted 10 kg for drinking depending on the nature of the climate and physical activity and the culture of the community.8 Disposal of sewerage and industrial waste into fresh water sources in a main cause water pollution.9 Therefore quality of drinking water is a major concern in urban populations and requires continuous monitoring to safeguard the health of people. The basic physical and chemical parameters have to be monitored such as disinfectant residuals, pH and turbidity, conductivity, color, taste and odor. Harmful chemicals such as nitrate, iron, arsenic, fluoride, lead, cyanide and other metals have to be checked as part of water quality assessment.10,11 The aim of this study was to assess the quality of drinking water in the city of Sulaimaniyah through determining the physical, chemical and microbiological characteristics of water samples from different sources of the city.
Material and Methods
Description of Study Area
Sulaimaniyah is one of major cities of the Iraqi Kurdistan region located in the north eastern part of Iraq with a population of over 1 million. Stretching between two mountain ranges at the intersection point of longitude ( 45.44312° ) and latitude ( 35.55719° ), the city center is around 850 m above the sea level.12
Sample Collection
The Study reports on a total of 2342 water samples from various sources providing water to the city and some other towns located nearby including Chamchamal, Shorsh, Takya, Bazyan, Gopala, Taynal, Bakrajo, Raparin, Tasluja, Allayee and Piramagroon. Samples were collected during 2014 from the raw water of Dukan project (Dukan Dam downstream ), Dukan project after water treatment, Sarchinar project before chlorination, city storage tanks, other local sources inside the city and samples brought by citizens. Samples were collected in in special clean glass bottle and transferred to the quality control laboratories of the Directorate of Water in Sulaimaniyah, Sarchinar and Dukan.
Analysis Methods
The water samples were analyzed at above mentioned laboratories for physico-chemical parameters using standard procedures for assessment of water samples.9,11 Physico-chemical characteristics tested include pH, temperature, total alkalify, total hardness (TH), dissolve oxygen (DO), Sulfate (SO42-), calcium, sodium, potassium, magnesium, nitrate (NO31-), chloride and residual chloride. The water samples were taken five days per week starting January ending December 2014. The observed results were compared with the WHO water standards.7,8 All reagent used in the present study were of analytical reagent grade and de-ionized water was used for experimental purposes. All precautions were taken as given in APHA, AWWA , WPCF ( 2003 ) for sampling and analysis.
Instruments used in the analysis included multi parameter photometer (HANNA Instrument HI 83200), portable data logging spectrophotometer (HACH DR/ 2010), conductivity meter (JENWAY portable 4150), PH/temperature (HANNA PH210), flame photometer (JENWAY PEP7), Lovibonddaylight 2000 unit color meter, digital burette (HIRSCHMANN) for tit rations, sensitive balance (Sartorius BP 310s, d = 0.001), ViromagTelesystem magnetic stirrer (Thermo Scientific brand) and T80+ UV/ VIS spectrophotometer.
Results
Samples and Sources
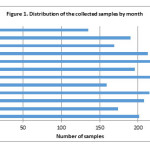
The analysis includes a total of 2342 water samples from various sources providing water to Sulaimaniyah city collected during 2014(table 1). There were 2342 samples collected and included in the current analysis. Samples were collected from the raw water of Dukan project before water treatment (26%), Dukan project after water treatment(50%), Sarchinar project before chlorination (8%) and city storage tanks and other network pipes inside the city(6%). In addition 10% of the samples were brought in for analysis by citizens but there sources were diverse and not necessarily from drinking water outlets. Thirty four percent of the samples were collected in winter and 21% were collected in autumn. Samples were collected throughout the year. More samples (241, 10%) were collected in August and less samples were collected in December (131, 6%). Monthly distribution of the samples is shown in figure 1.
 |
|
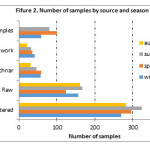
Samples from various sources were collected during all seasons. Distribution of the samples by source and season is displayed in figure 2. There were statistically significant variances among the sources in terms of seasonal sampling (chi-squared=110, p<0.001). Overall, 28% of the samples were taken in summer and 21% in autumn.
Dukan was more consistent with 23%, 24%, 25% and 27% for autumn, winter, spring and summer respectively.
Physo-chemical characteristics of pumped water at source
Samples from the two main water sources of the city were analyzed for physico-chemical parameters of the water. Dukan source is taken from a lake and the samples analyzed here are taken after the water treatment process when the water is ready to be pumped to the city. Sarchinar is a spring, it does not go through water treatment and the samples analyzed here are taken from the source directly. Table 2 shows the parameters of both sources combined (representing Sulaimani water in general) and parameters of each source separately with statistical comparison. Overall, the total hardness of the city water at source was 186.3 (95% CI 179.6, 192.8), TDS was 150.6 (95% CI 149.5, 151.7), and PH was 7.74(95% CI 7.36, 8.12). The values and 95% confidence intervals of other parameters of the water can be found in the table. The two sources were statistically different in relation to most parameters. The total hardness, TDS and turbidity were considerably higher in Sarchinar than Dukan (231 vs. 161, 242 vs. 147 and 2.7 vs. 1.8 respectively). Calcium was also higher in Sarchinar than Dukan (72.9 vs. 44.5 mg/l) while Sodium and Potassium were higher in Dukan than Sarchinar (3.4 vs. 1.4 and 1.4 vs. 0.08 mg/l respectively).
 |
|
Comparison of the two lines of Dukan Project
Samples from the two supply lines from filtrated Dukan water project were compared in relation to physic-chemical characteristics as shown in table 3. The two lines were similar and there were no significant differences in any of the parameters except PH, TDS and turbidity which were different. TDS of Dukan 1 project was a slightly higher than Dukan 2 yet it was significant (148.9 vs. 145.9 respectively). Similarly turbidity of Dukan 1 was twice that of Dukan 2 (2.4 vs. 1.2).
Physo-chemical characteristics of pumped water at source
Samples from the two main water sources of the city were analyzed for physico-chemical parameters of the water. Dukan source is taken from a lake and the samples analyzed here are taken after the water treatment process when the water is ready to be pumped to the city. Sarchinar is a spring, it does not go through water treatment and the samples analyzed here are taken from the source directly. Table 2 shows the parameters of both sources combined (representing Sulaimani water in general) and parameters of each source separately with statistical comparison. Overall, the total hardness of the city water at source was 186.3 (95% CI 179.6, 192.8), TDS was 150.6 (95% CI 149.5, 151.7), and PH was 7.74(95% CI 7.36, 8.12). The values and 95% confidence intervals of other parameters of the water can be found in the table. The two sources were statistically different in relation to most parameters. The total hardness, TDS and turbidity were considerably higher in Sarchinar than Dukan (231 vs. 161, 242 vs. 147 and 2.7 vs. 1.8 respectively). Calcium was also higher in Sarchinar than Dukan (72.9 vs. 44.5 mg/l) while Sodium and Potassium were higher in Dukan than Sarchinar (3.4 vs. 1.4 and 1.4 vs. 0.08 mg/l respectively).
Table 1: Source and season of samples included in the analysis
|
Samples |
Number |
Percent |
|
Total |
2342 |
100 |
|
Source of samples |
||
|
Dukan project filtered |
1171 |
50.0 |
|
Dukan project Raw |
608 |
26.0 |
|
Sarchnar project |
193 |
8.2 |
|
City tanks/network |
130 |
5.6 |
|
Citizens |
240 |
10.3 |
|
Season of collection |
||
|
Winter |
584 |
34.2 |
|
Spring |
614 |
26.2 |
|
Summer |
650 |
27.8 |
|
Autumn |
494 |
21.1 |
Table 2: Comparison of physico-chemical properties of water samples from the two main
sources of Sulaimaniyah water supply
|
(Characteristics at source) |
||||
|
Overall (n=1364) |
Dukan project (n=1171) |
Sarchinar Project (n=193) |
P value (t-test) |
|
|
Parameters |
Mean (95% CI) |
Mean (95% CI) |
Mean (95% CI) |
|
|
Hardness mg/l |
186.3 (179.6,192.8) |
163.5(160.9,166.2) |
231.3(222.6,239.9) |
<0.001 |
|
TDS |
150.6 (149.5,151.7) |
147.3(146.8,147.8) |
242.7(235.4,250.0) |
<0.001 |
|
Turbidity |
1.9(1.7,2.0) |
1.8(1.6,1.9) |
2.7(2.1,3.3) |
<0.001 |
|
PH |
7.55(7.54,7.56) |
7.54(7.53,7.55) |
7.58(7.55,7.61) |
0.005 |
|
Chloride, mg/l |
19.8(18.7,20.8) |
17.4(16.6,18.3) |
23.0(21.1,24.9) |
<0.001 |
|
Conductivity, ms/cm |
299.1(295.5,302.6) |
296.2(292.6,299.7) |
378.4(367.4,389.4) |
<0.001 |
|
Dissolved O2, |
9.0(7.7,10.3) |
9.1(7.8,10.5) |
4.8(4.7,5.0) |
0.3 |
|
Calcium, mg/l |
54.4(51.7,57.1) |
44.5(43.5,45.5) |
72.9(70.3,75.5) |
<0.001 |
|
Sodium, mg/l |
2.6(2.1,3.1) |
3.4(2.7,4.2) |
1.4(0.9,1.9) |
<0.001 |
|
Potassium, mg/l |
1.2(1.1,1.3) |
1.4(1.3,1.6) |
0.8(0.7,0.9) |
<0.001 |
|
Magnesium, mg/l |
12.1(11.4,12.8) |
12.1(11.3,12.9) |
12.1(10.6,13.5) |
1.0 |
|
Total alkalinity |
172.9(166.2,177.7) |
162.4(153.7,171.1) |
184.3(179.3,189.3) |
<0.001 |
|
SO4 |
29.7(28.3,31.6) |
39.9(34.9,45.0) |
27.5(26.5,28.6) |
<0.001 |
|
NO3 |
11.2(10.2,12.3) |
2.8(2.1,3.4) |
13.7(12.5,14.8) |
<0.001 |
|
Temperature, C |
18.5(18.1,19) |
18.4(17.9,18.9) |
19.2(18.9,19.5) |
0.2 |
Table 3: Comparison of physico-chemical properties of water samples from the 2 lines of Dukan project
|
(Characteristics at source)
|
||||
|
Dukan 1 (n=429) |
Dukan 2 (n=637) |
P value (t-test) |
||
|
Parameters |
Mean (95% CI) |
Mean (95% CI) |
||
|
Hardness mg/l |
164.3(160.0,168.7) |
162.9(159.4,166.3) |
0.6 |
|
|
TDS |
148.9(148.1,149.7 |
145.9(145.3,146.5) |
<0.001 |
|
|
Turbidity |
2.4(2.2,2.7) |
1.2(1.0,1.3) |
<0.001 |
|
|
PH |
7.53(7.52,7.54) |
7.5(7.53,757) |
0.02 |
|
|
Chloride, mg/l |
16.6(15.1,18.2) |
18.1(17.1,19.0) |
0.1 |
|
|
Conductivity, ms/cm |
301.8(294.1,309,4) |
291.6(290.3,292.8) |
0.005 |
|
|
Dissolved O2, |
9.3(6.3,12.3) |
9.0(8.9,9.1) |
0.8 |
|
|
Calcium, mg/l |
44.7(43.4,46.1) |
44.2(42.7,45.7) |
0.6 |
|
|
Sodium, mg/l |
3.4(2.2,4.7) |
3.4(2.5,4.4) |
1 |
|
|
Potassium, mg/l |
1.4(1.2,1.6) |
1.4(1.2,1.6) |
0.9 |
|
|
Magnesium, mg/l |
12.2(11.0,13.5) |
12.0(10.8,13.1) |
0.7 |
|
|
Total alkalinity |
163.4(148.2,178.5) |
161.7(150.7,172.7) |
0.8 |
|
|
SO4 |
41.0(32.3,49.8) |
39.0(32.7,45.3) |
0.7 |
|
|
NO3 |
2.6(1.8,3.4) |
2.9(1.9,3.9) |
0.7 |
|
|
Temperature, C |
19.9(18.9,21.0) |
17.2(16.7,17.5) |
<0.001 |
|
Comparison of the two lines of Dukan Project
Samples from the two supply lines from filtrated Dukan water project were compared in relation to physic-chemical characteristics as shown in table 3. The two lines were similar and there were no significant differences in any of the parameters except PH, TDS and turbidity which were different. TDS of Dukan 1 project was a slightly higher than Dukan 2 yet it was significant (148.9 vs. 145.9 respectively). Similarly turbidity of Dukan 1 was twice that of Dukan 2 (2.4 vs. 1.2).
Table 4: Characteristics of the water samples brought by citizens (n=240)
|
Parameters |
Mean (95% CI) |
Range |
|
Hardness mg/l |
285.1(241.5,328.7 |
8-2900 |
|
TDS |
552.0 (433.2,670.7) |
8-7116 |
|
PH |
7.70 (7.64,7.76) |
6.1-9.2 |
|
Chloride, mg/l |
60.0(49.6,70.3) |
8-900 |
|
Conductivity, ms/cm |
670 (555.9,784.1) |
12.4-8800 |
|
Calcium, mg/l |
78.1(67.4,88.9) |
8-680 |
|
Sodium, mg/l |
76.4(54.6,98.3) |
2/5-1269 |
|
Potassium, mg/l |
2.2(1.6,2.8) |
0.1-41 |
|
Magnesium, mg/l |
27.8(20.8,34.8) |
0.9-310 |
|
Total alkalinity |
247.4(217.1,277.7) |
20-3501 |
|
SO4 |
62.3(498,74.8) |
0.4-713 |
Physico-chemical characteristics of samples brought by citizens
Results of water samples brought to the water department for analysis by residents of Sulaimani city is shown in table 4.These Samples from the two main water sources of the city were analyzed for physico-chemical parameters of the water. Dukan source is taken samples are not necessarily from potable water and most of them come from shallow and deeper wells dug in household and other premises. These citizens are usually given appropriate advice when they are handed the results.
Physico-Chemical Characteristics by Season of Collection
As both Dukan and Sarchinr projects depend on surface water , parameters of water may be different in different seasons. Therefore the parameters were tabulated by season and the observed data shown in tables (5,6,7,8 and 9). Table 5 shows parameters of both Dukan and Sarchnar projects combined. was lowest in autumn (140.8) and highest in summer (155.5). total hardness were lowest in Autumn in all projects. Highlited figures indicate highers and lowest values for each parameter. Total hardness, turbidity, chloride, dissolved oxygen, potassium and NO3 were highest in winter; calcium was highetst in spring; TDS, conductivity, magnesium, total alkalinity and SO4 were highest in summer and Sodium was highest in autumn. SO4 was lowest in winter; chloride, sodium, magnesium and total alkalinity were lowest in spring; Turbidity, PH, dissolved oxygen and potassium were lowest in summer and total hardness and TDS, conductivity and calcium were lowest in autumn. Parameters for indivudual projects are shonw in tables 6-9.
Table 5: Physic-chemical properties of water samples from the two main sources of Sulaimani water
supply by season (n=1364)
|
Parameters |
Winter |
Spring |
Summer |
Autumn |
||||
|
Mean |
SD |
Mean |
SD |
Mean |
SD |
Mean |
SD |
|
|
Hardness mg/l |
192.8 |
37.3 |
187.8 |
37.7 |
192.3 |
39.5 |
165.6 |
27.4 |
|
TDS |
151.1 |
23.7 |
153.7 |
20.9 |
155.5 |
15.5 |
140.8 |
16.7 |
|
Turbidity |
3.1 |
4.2 |
1.4 |
1.7 |
1.1 |
1.3 |
2.1 |
2.0 |
|
PH |
7.6 |
0.1 |
7.6 |
0.1 |
7.4 |
0.2 |
7.6 |
0.2 |
|
Chloride, mg/l |
21.8 |
4.6 |
18.2 |
3.3 |
20.9 |
6.2 |
18.6 |
7.3 |
|
Conductivity, ms/cm |
297.3 |
25.5 |
302.8 |
20.6 |
309.2 |
26.9 |
284.7 |
121.2 |
|
Dissolved O2, |
11.9 |
47.6 |
8.5 |
1.3 |
7.8 |
1.6 |
7.9 |
1.6 |
|
Calcium, mg/l |
54.4 |
13.3 |
58.0 |
16.3 |
55.5 |
16.6 |
47.3 |
10.0 |
|
Sodium, mg/l |
2.8 |
2.3 |
1.8 |
1.1 |
2.3 |
1.7 |
4.3 |
4.8 |
|
Potassium, mg/l |
1.4 |
0.5 |
1.2 |
0.7 |
0.9 |
0.3 |
1.0 |
0.2 |
|
Magnesium, mg/l |
13.4 |
2.7 |
10.2 |
3.4 |
13.8 |
5.4 |
10.7 |
2.6 |
|
Total alkalinity |
174.8 |
9.7 |
164.4 |
40.8 |
186.7 |
16.2 |
165.6 |
19.0 |
|
SO4 |
27.0 |
11.4 |
30.2 |
11.6 |
33.3 |
7.9 |
28.1 |
8.3 |
|
NO3 |
15.1 |
7.0 |
9.8 |
5.9 |
9.6 |
10.9 |
10.1 |
4.9 |
|
Temperature, C |
13.9 |
7.8 |
18.1 |
3.2 |
22.5 |
12.0 |
19.1 |
3.9 |
Table 6: Physic-chemical properties of water samples from the Line 1 Dukan project by season (n=530).
|
Parameters |
Winter |
Spring |
Summer |
Autumn |
||||
|
Mean |
SD |
Mean |
SD |
Mean |
SD |
Mean |
SD |
|
|
Hardness mg/l |
168.1 |
11.4 |
167.6 |
9.3 |
168.8 |
7.7 |
149.3 |
16.8 |
|
TDS |
147.3 |
4.5 |
151.8 |
3.6 |
155.7 |
2.6 |
138.5 |
15.1 |
|
Turbidity |
4.4 |
3.2 |
1.9 |
2.2 |
1.0 |
0.6 |
3.1 |
2.3 |
|
PH |
7.6 |
0.1 |
7.6 |
0.1 |
7.4 |
0.1 |
7.6 |
0.2 |
|
Chloride, mg/l |
17.9 |
3.6 |
17.4 |
2.2 |
16.7 |
1.4 |
14.7 |
6.1 |
|
Conductivity, ms/cm |
295.0 |
9.3 |
304.1 |
7.2 |
314.1 |
31.3 |
289.3 |
182.7 |
|
Dissolved O2, |
15.9 |
74.8 |
8.4 |
1.0 |
6.7 |
1.2 |
7.4 |
1.9 |
|
Calcium, mg/l |
43.8 |
3.0 |
46.7 |
1.8 |
45.5 |
5.2 |
42.4 |
3.5 |
|
Sodium, mg/l |
4.0 |
2.2 |
2.6 |
0.8 |
2.1 |
0.3 |
5.2 |
7.2 |
|
Potassium, mg/l |
1.7 |
0.2 |
1.5 |
0.5 |
0.8 |
0.4 |
1.0 |
0.3 |
|
Magnesium, mg/l |
13.6 |
3.8 |
11.7 |
2.4 |
13.5 |
4.6 |
9.6 |
2.6 |
|
Total alkalinity |
172.5 |
9.6 |
153.1 |
53.2 |
185.0 |
12.9 |
158.3 |
5.2 |
|
SO4 |
49.1 |
13.1 |
35.5 |
21.5 |
41.3 |
15.6 |
||
|
NO3 |
1.6 |
0.3 |
2.4 |
1.7 |
2.4 |
1.7 |
5.1 |
1.1 |
|
Temperature, C |
14.2 |
12.7 |
19.4 |
3.7 |
24.7 |
17.9 |
19.5 |
4.4 |
Table 7: Physic-chemical properties of water samples from the Line 2 Dukan project by season (n=641).
|
Parameters |
Winter |
Spring |
Summer |
Autumn |
||||
|
Mean |
SD |
Mean |
SD |
Mean |
SD |
Mean |
SD |
|
|
Hardness mg/l |
164.0 |
8.0 |
161.2 |
8.2 |
169.2 |
8.1 |
157.1 |
19.9 |
|
TDS |
145.2 |
5.1 |
147.7 |
6.5 |
150.4 |
5.9 |
140.0 |
9.7 |
|
Turbidity |
2.3 |
3.0 |
0.4 |
0.4 |
0.7 |
0.3 |
1.1 |
1.4 |
|
PH |
7.6 |
0.1 |
7.6 |
0.1 |
7.4 |
0.1 |
7.6 |
0.2 |
|
Chloride, mg/l |
18.3 |
4.1 |
18.6 |
3.2 |
17.9 |
1.5 |
16.9 |
1.1 |
|
Conductivity, ms/cm |
290.3 |
10.5 |
295.3 |
12.7 |
301.0 |
11.7 |
279.0 |
19.4 |
|
Dissolved O2, |
9.6 |
0.5 |
8.9 |
1.1 |
9.1 |
0.8 |
8.3 |
1.2 |
|
Calcium, mg/l |
43.8 |
2.5 |
46.1 |
2.3 |
44.2 |
7.9 |
42.0 |
5.6 |
|
Sodium, mg/l |
4.0 |
2.1 |
2.3 |
0.8 |
2.1 |
0.2 |
5.3 |
5.9 |
|
Potassium, mg/l |
1.6 |
0.2 |
1.7 |
0.8 |
0.8 |
0.3 |
1.0 |
0.2 |
|
Magnesium, mg/l |
12.7 |
2.0 |
10.1 |
2.1 |
13.9 |
6.2 |
11.7 |
2.3 |
|
Total alkalinity |
166.7 |
5.2 |
152.3 |
44.3 |
180.0 |
11.0 |
157.9 |
15.2 |
|
SO4 |
41.0 |
11.5 |
38.6 |
16.5 |
35.0 |
13.8 |
||
|
NO3 |
1.7 |
0.0 |
2.2 |
1.5 |
2.6 |
1.8 |
7.2 |
3.7 |
|
Temperature, C |
12.8 |
1.6 |
16.5 |
2.4 |
20.6 |
2.3 |
18.7 |
3.9 |
Table 8: Physic-chemical properties of water samples from the Sarchinar project by season (n=193).
|
Parameters |
Winter |
Spring |
Summer |
Autumn |
||||
|
Mean |
SD |
Mean |
SD |
Mean |
SD |
Mean |
SD |
|
|
Hardness mg/l |
236.5 |
17.9 |
234.0 |
26.3 |
238.9 |
35.9 |
200.0 |
17.2 |
|
TDS |
255.3 |
18.3 |
248.2 |
17.8 |
230.1 |
28.0 |
223.6 |
14.4 |
|
Turbidity |
2.6 |
7.4 |
2.2 |
1.2 |
3.0 |
2.9 |
3.0 |
1.7 |
|
PH |
7.5 |
0.0 |
7.5 |
0.1 |
7.7 |
0.4 |
7.7 |
0.2 |
|
Chloride, mg/l |
25.3 |
1.8 |
18.2 |
4.1 |
24.6 |
7.2 |
25.3 |
8.7 |
|
Conductivity, ms/cm |
400.5 |
28.3 |
382.6 |
21.7 |
360.5 |
44.0 |
349.4 |
22.4 |
|
Dissolved O2, |
4.9 |
0.4 |
4.8 |
0.5 |
4.9 |
0.5 |
||
|
Calcium, mg/l |
70.0 |
2.3 |
78.5 |
7.3 |
75.7 |
9.0 |
61.8 |
5.8 |
|
Sodium, mg/l |
0.7 |
0.1 |
0.6 |
0.1 |
2.5 |
2.2 |
2.7 |
1.5 |
|
Potassium, mg/l |
0.7 |
0.2 |
0.7 |
0.2 |
0.9 |
0.3 |
1.0 |
0.2 |
|
Magnesium, mg/l |
13.9 |
2.5 |
9.1 |
4.7 |
14.0 |
6.1 |
11.0 |
2.7 |
|
Total alkalinity |
179.2 |
9.1 |
183.5 |
16.0 |
190.9 |
19.1 |
185.0 |
22.4 |
|
SO4 |
22.4 |
4.6 |
27.9 |
7.1 |
32.5 |
6.4 |
28.1 |
8.3 |
|
NO3 |
18.5 |
1.7 |
12.3 |
4.5 |
11.0 |
11.4 |
11.6 |
4.8 |
|
Temperature, C |
16.6 |
1.0 |
19.7 |
1.4 |
21.6 |
1.0 |
19.4 |
1.7 |
Table 9: Physic-chemical properties of water samples from the raw water Dukan project by season (n=608)
|
Parameters |
Winter |
Spring |
Summer |
Autumn |
||||
|
Mean |
SD |
Mean |
SD |
Mean |
SD |
Mean |
SD |
|
|
Hardness mg/l |
168.2 |
11.8 |
169.1 |
9.2 |
165.5 |
6.2 |
146.2 |
44.9 |
|
TDS |
145.4 |
13.2 |
148.1 |
3.7 |
153.2 |
3.4 |
137.5 |
7.4 |
|
Turbidity |
13.3 |
33.9 |
4.4 |
4.6 |
2.3 |
1.7 |
13.0 |
40.8 |
|
PH |
8.0 |
0.2 |
7.9 |
0.2 |
7.6 |
0.1 |
7.8 |
0.4 |
|
Chloride, mg/l |
19.2 |
4.4 |
17.4 |
3.3 |
16.8 |
2.0 |
16.0 |
1.9 |
|
Conductivity, ms/cm |
287.7 |
16.5 |
294.7 |
15.4 |
323.5 |
213.9 |
275.0 |
14.8 |
|
Dissolved O2, |
9.6 |
1.1 |
8.4 |
1.3 |
4.9 |
1.4 |
6.8 |
2.3 |
|
Calcium, mg/l |
43.8 |
2.5 |
46.4 |
2.8 |
43.1 |
8.0 |
41.7 |
37.4 |
|
Sodium, mg/l |
3.8 |
2.2 |
2.7 |
0.9 |
2.1 |
0.2 |
1.0 |
0.1 |
|
Potassium, mg/l |
1.7 |
0.2 |
1.2 |
0.4 |
0.7 |
0.4 |
1.1 |
0.4 |
|
Magnesium, mg/l |
12.4 |
4.7 |
12.1 |
3.1 |
13.6 |
4.5 |
12.5 |
2.9 |
|
Total alkalinity |
176.0 |
15.2 |
181.1 |
16.2 |
161.5 |
74.2 |
135.9 |
60.3 |
|
SO4 |
40.6 |
13.7 |
40.9 |
21.4 |
41.5 |
22.2 |
8.2 |
6.4 |
|
NO3 |
1.8 |
0.0 |
2.5 |
1.4 |
2.3 |
1.2 |
3.3 |
2.7 |
|
Temperature, C |
12.3 |
1.8 |
17.6 |
12.2 |
21.6 |
3.1 |
18.5 |
4.0 |
Table 10: quality of drinking water of Sulaimani City, MPN and E. coli tests and comparison by source, season and chlorination level.
|
|
MPN |
Escherichia coli |
||||
|
|
0-2.2 Number (%) |
Over 2.2 Number (%) |
P value |
Negative Number (%) |
Positive Number (%) |
P value |
|
All |
1034 (96.7) |
35(3.3) |
54(58.7) |
38 (41.3) |
||
|
Source |
||||||
|
Project site |
109(100) |
0(0) |
<0.001 |
2(100) |
0(0) |
0.50 |
|
Municipality Storage tank |
322(100) |
0(0) |
3(42.9) |
4(57.1) |
||
|
Network |
200(95.7) |
9(4.3) |
14 (60.9) |
9 (39.1) |
||
|
Household samples |
403(93.9) |
26(6.1) |
35 (58.3) |
25 (41.7) |
||
|
Season |
||||||
|
Winter |
278(98.2) |
5(1.8) |
0.06 |
12 (75) |
4 (25) |
0.30 |
|
Spring |
311(97.2) |
9(2.8) |
16 (57.1) |
12 (42.9) |
||
|
Summer |
204 (94.0) |
13 (6.0) |
11 (45.8) |
13 (54.2) |
||
|
Autumn |
241 (96.8) |
8 (3.2) |
15 (62.5) |
9 (37.5) |
||
|
MPN |
||||||
|
0- 2.2 |
- |
- |
45 (77.6) |
13 (22.4) |
<0.001 |
|
|
Over 2.2 |
- |
- |
9 (26.5) |
25 (73.5) |
||
|
Chlorination level , PPM (SD) |
1.16 (0.43) |
1.05(0.39) |
0.20 |
1.05 (0.43) |
1.1 (0.22) |
0.80 |
Microbiological Contamination
A total of 1069 samples from Sulaimani drinking water sources and households were tested for biological contamination. These included 640 (60%) from the projects, distribution storage tanks and city networks and 429 samples (40%) from households. Of all these samples 973 (91%) had an MPN of zero, 61 (5.7%) had an MPN of 2.2 and 35 (3.3%) had a higher than 2.2 MPN. The mean chlorination level for all samples was 1.12 (SD 0.44) and there were no significant differences between contamination indicators and PPM (see table 10 ). When the MPN was analysed by sources of the samples, 6% of the household samples and 4% of the network samples had MPN higher than 2.2, while none of the project site and municipality tanks had MPN higher than 2.2. These differences were statistically significant. In relation to season, more contamination was observed in summer samples (6%) and less in winter samples (2%) but these differences were not statistically significant. In relation to Escherichia coli, although more positive samples were reported in household samples (41%) and in summer samples, these differences were not statistically significant. A total of 92 samples of the city’s drinking water were tested for Escherichia coli of which 38(41%) were positive. There was a statistically significant association between MPN and E. coli positivity. While 73.5% of the samples with MPN higher than 2.2 was positive for E. coli, only 22.4% of the samples with MPN lower than 2.2 was positive for the bacteria.
Overall MPN for project site and municipality storage tank were zero while for network and household samples were contaminated ( 9 4.3% , 6.1% ) respectively, it show that water from sources was clean for MPN test but some time contaminated in network and household. Season MPN and Escherichia coli contaminated in order (Summer > Spring > Autumn > winter).Escherichia coli for project site was zero while for municipality storage tank, network and household samples were contaminated (57.1% , 39.1% , 41.7%) respectively.
Discussion
pH indicates the intensity of acidic or basic character at a given temperature. pH is an significant factor that decides the suitability of water for various purposes.13 Every phase of water treatment and water quantity like acid-base neutralization, water softening, precipitation, coagulation, decontamination, corrosion contsrol is pH reliant. pH values of Dukan 1 and Dukan 2 water projects in all seasons are similar and in range of (7.4 – 7.6) which is close to the value of Sarchinar (7.5–7.7). The pH value of untreated water of Dukan were higher in autumn and winter causing change in the color and requiring pH regulation in those seasons. The permissible limit of pH according to the WHO is (6.5 - 8.50). This pH is comparable with results presented from other studies about Dukan lake raw water14 and Tigris River15 which were 6.45-8.20 and 7.1-8.4 respectively.
In relation to turbidity, the observed values (4.4-0.4 NTU) for treated water were within the permissible level recommended by WHO for drinking water. Turbidity in water is produced by incidence of suspended particles such as clay, silt, finely divided organic matter, plankton and other microscopic organisms.16 Electrical conductivity is a amount of cations in water which can greatly affect its taste and has significant effect on the acceptability of water for drinking17,18 and its suitability for irrigation. Higher value of conductivity shows higher concentration of dissolved ions. Conductivity of water sample was found in range 275 -400.5 ms/cm which is below the WHO standards.
Temperature was in range of 12.3 – 24.7 c. Temperature is one of important factors in aquatic environment19 It has major effect on growth and activity of ecological life and Solubility of oxygen in water increases with decreasing temperature20 therefor Dissolved oxygen was higher in winter than summer .in all sources see table (6-9 ).
The electrical conductivity of water samples correlates with the concentration of dissolved minerals or with what is commonly known as the total dissolved salts of water samples. The result presented that TDS was within the permissible level mentioned by the WHO (500 mg/l) where our values range from (137.5 – 255.3) mg/l. TDS of Sarchinar was higher than Dukan 1 and Dukan 1 water project. TDS generally decreased in autumn and increased in summer in all sources except Sarchinar which was highest in winter. Main sources for TDS are farming and residential runoff, leaching to soil contamination and point source water pollution release from industrial or sewage treatment plants.21
The total hardness is a main parameter of water excellence whether to be used for domestic, industrial or agricultural purposes. The results observed were in range of (146.2- 238.9) mg/l and thus within WHO standards. Hardness in Sarchinar was higher than in Dukan water projects. Total hardness was less in autumn in all sources.
Calcium values ranged from (41.7 – 78.5) mg/l which is within WHO standards. Calcium in Sarchinar was higher than in Dukan and the increased hardness resulted from calcium and magnesium. Calcium was highest in spring and lowest in autumn in all sources.Common calcium-holding minerals are calcite and gypsum. Some human actions might rise calcium by increasing concentration of carbon dioxide which forms the carbonic acid that eventually lead to dissolve the bituminous rocks.21
Magnesium value ranged from (9.1- 4) mg/l which fall within WHO standards. The maximum value of magnesium was 14 mg/l and found in summer at Sarchinar water. Chlorides are collective constituents of all natural waters. Higher value of chloride imparts a salty taste to water making it unacceptable for human drinking. The WHO permissible limit of chloride for drinking water is 250 mg/l. The chloride values in this study varied from (16 – 25.3) mg/l which is much lower the WHO limit.
The total alkalinity is the quantitative size of an aqueous media to respond with H+ ions and its needed limit is 200 mg/l and maximum permissible limit is 600 mg/l. In the current study total alkalinity ranged from 135.9 – 190.9 mg/l. The observed dissolved oxygen study ranged from 4.9 – 15.9 mg/l, being maximum in Dukan 1 and minimum in Dukan raw water in summer. The observed average DO concentration level of 9.1 and 4.8 mg/l for Dukan and Sarchinar observes with WHO standard and is considered good to sufficient for human drinking and most biota. The results of DO in Dukan sources are consistent with those of unpolluted water bodies in other parts in Iraq and follows with Dukan results of 8.12 mg/l. In the this study nitrates ranged from1.6-18.5 µg/l.The concentration of different forms of nitrogen gives a beneficial indication of the level of micro-nutrients in the water and hence their ability to provision plant growth. The observed values of nitrate were within the permissible WHO border of 50 µg/l for domestic water. The possible causes of nitrate in the surface water of Dukan source are mainly from the atmosphere, surface runoff, sewage discharges, farming fertilizers and organic wastes.17 Sulfate values were found in the range from (8.2 – 41) mg/l which is acceptable. High concentrations of sulfate may induce diarrhea, intestinal disorder and cathartic effect of human health. High concentration of Sodium and magnesium sulfate is associated with respiratory illness.
Practically all sodium compounds are water soluble and tend to remain in aqueous solution. Water in contact with igneous rocks will dissolve sodium from its natural source. Higher concentration of Na + ion in drinking water may cause heart problems. Higher Na + ion in irrigation water may cause salinity problems. The range of Na + ions in water samples varied from of 0.6 – 5.3 mg/l which are within the WHO standards. Potassium is an important cation and plays a vital role in intermediately metabolism. K + is an essential nutrient for both plant and human life. However ingestion of excessive amounts may prove detrimental to human beings. The K + concentration of analyzed water samples varied from 0.7 – 1.7 mg/l. Generally comparing different sources, parameters of Sarchinar were higher than Dukan water project except dissolved oxygen, sodium, potassium and total alkalinity. The parameters of Dukan 1 and Dukan 2 were similar indicating similar quality of water in both project lines.
Three percent of samples were contaminated microbiologically including 2.4% from samples brought by citizens and 0.6% from city’s water networks. None of the project site samples were contaminated. This might indicate contamination in the network and probably damaged pipes and mixing with soil and sewerage in some areas. Concentration of chlorine level in positive samples was less than negative samples indicating poorer chlorination. Most contaminated samples were taken in summer and least in winter. Ninety two samples were analyzed for Escherichia coli of which 41% were positive for Escherichia coli mostly samples taken in summer and from citizens.
The study indicates that physicochemical parameters of all sources are inside the limits given by WHO guidelines for drinking water quality. It can, therefore, be concluded that water from the Dukan project, Sarchinar project and city storage tanks area generally safe and suitable for drinking and other domestic purposes. However, there is need for regular monitoring of water quality at the household and network level especially for biological contamination in summer to make sure that the quality of water is ensured and maintained from source to consumption. It is also recommended to expand observing to cover other health-related heavy metals (Ag , Hg, Pb, Ni, Cr, Cd and As). We also suggest that establish mechanisms to monitor surface water sources and protect them from all sorts of contamination.
Acknowledgment
The authors would like to thank Sulaimani water Directorate and its staff for providing institutional and personal support to achieve this work.
Reference
- Mishra, A., Mukherjee, A. and Tripathi, B. D. Seasonal and Temporal Variations in Physico-chemical and Bacteriological Characteristics of River Ganga in Varanasi. Int. J. Environ. Res.2009. 3(3):395-402.
- Ramakrishnaiah, C.R., C. Sadashivalah and G. Ranganna, (2009). Assessment of water quality index for the groundwater in Tumkur Taluk,Karnataka State. Indian J. Chem., 6: 523-530.
- Al meini, A.K. A proposed index of water quality assessment for irrigation. Eng. Tech. j., 28(22):6557-6571,(2010).
- Panda, R.B. and Sinha, B.K., Investigation of water quality of Brahmani River. Indian Journal Environmental Health, 33(1), pp. 45-49, (1991).
- Diersing N. 2009. Water Quality: Frequently Asked Questions. Florida Keys National Marine Sanctuary, KeyWest, FL. Available at: http://floridakeys.noaa.gov/scisummaries/wqfaq.pdf
- Sargaonkar, A., and Deshpande, V. 2003. Development of an overall index of pollution for surface water based on a general classification scheme in Indian context. Environmental Monitoring and Assessment, 89, 43–67.
- Khan, F., Husain, T., and Lumb, A. 2003. Water quality evaluation and trend analysis in selected watersheds of the Atlantic Region of Canada. Environmental Monitoring and Assessment, 88, 221–242.
- Fewtrell, L. and Bartram, J. (2001). Water Quality Standards and Health. Assessment of Risk and Risk Management for Water Related Infectious Disease. IWA Publishing, London, UK.
- Panigrahi, T.; Das, K.K.; Dey, B.S. and Panda, R.B., Assessment of Water Quality of river Sono, Balasore. International Journal Environmental Science, 3(1), pp. 49-56, (2012).
- Razuki, S.M.M and AL-Rawi, M.A (2010). Study of Some Physiochemical and Microbial Properties of Local and Imported bottled Water in Baghdad City, Iraqi Journal of Market Research and Consumer Protection Vol. 2, NO. 3, 75-103.
- Almosawi, B.N.E and Alzubaidi, I.S.H (2010). Detection of Microbial and chemical contaminants of the plastic bottled drinking waters, Iraqi Journal of Market Research and Consumer Protection Vol. 2, NO. 3, 168 -184.
- Dana A. Mohammed Barznji , DilshadG.A. Ganjo . Asian journal of water Environmental and Pollution ,Vol(2) No.(2014) . pp. 19-28.
- M. V. Ahipathy and E. T. Puttaiah, “Ecological Characteristics of Vrishabhavathy River in Bangalore (India),” Environmental geology, Vol. 49, No. 8, 2006, pp. 1217-1222.
- Abdul Hameed M. Jawad Alobaidy1 , Haider S. Abid2 , Bahram K. Maulood3 , Journal of Water Resource and Protection, 2010, 2, 792-798.
- Zahraa Zahraw Al-Janabi*, Abdul-Rahman-Al-Kubaisi* and Abdul-Hameed M. Jwad Al-Obaidy** Journal of Al-Nahrain University Vol.15 (1), March, 2012, pp.119-126.
- Charles E. Reen (1970). "Investigating Water Problems: A Water Analysis Manual". Publishing by LaMotte Chemical Products Company, Chestertown, Maryland. 72pp.
- Sastry, K. V. and Prathima Rathee, Physicochemical and microbiological characteristics of water of village Kanneli (distt. Rohtak), Haryana. Proc. Acad. Biol., 7(1): 103-108 , 1998.
- J. K. Pradeep, “Hydrogeology and Quality of Ground Water around Hirapur, District Sagar (M.P.),” Pollution Research, Vol. 17, No. 1, 1998, pp. 91-94.
- Singh, R.P.and Mathur, P., investigation of variations in physico chemical characteristics of fresh water reservoir of Ajmer city, Rajasthan, Ind. J. Env., 9: 57-61 (2005).
- Joshi, P.C and Singh, Analysis of certain physico-chemical parameters and planktons of fresh water hill stream at Nanda Devi biosphere reserve. Uttar Pradesh J. Zoo., 21: 177-179 (2001).
- Boyd, C.E. (2000). "Water Quality an Introduction". Kluwer Acadamic Publi-shers, Boston, USA, 330P.


