Investigating the Effect of Admixtures on Surface Strength of Concrete in Urban Sewage Systems.
Hassan Roustaei 1 *
1
Department of Civil Engineering,
Asadabad Branch,
Islamic Azad University,
Asadabad,
Iran
http://dx.doi.org/10.12944/CWE.10.Special-Issue1.06
One of the most important properties of concrete is its strength. However, in certain circumstances, like urban sewage systems, concrete is attacked and corroded, being exposed to the sulfuric acid produced from H2S in a biological process, thereby undergoing a decrease in its strength. This paper studies the effect of concrete admixtures on surface strength of concrete in acidic environments, using Twist-Off method. In order to investigate the corrosion process in concrete and consequent decrease in its strength, the calibration curve for the partially destructive twist-off method was firstly determined. Then, 15 concrete samples mixed with air-entraining admixtures, plasticizers, and micro-silica were prepared and placed in acidic and neutral PH environments in sewer pipes and sewage treatment plant. Using twist-off method and calibration curve, surface strengths of the samples were measured in a 135-day period and compared with one another.
Copy the following to cite this article:
Roustaei H. Investigating the Effect of Admixtures on Surface Strength of Concrete in Urban Sewage Systems. Special Issue of Curr World Environ 2015;10(Special Issue May 2015). DOI:http://dx.doi.org/10.12944/CWE.10.Special-Issue1.06
Copy the following to cite this URL:
Roustaei H. Investigating the Effect of Admixtures on Surface Strength of Concrete in Urban Sewage Systems. Special Issue of Curr World Environ 2015;10(Special Issue May 2015). Available from: http://www.cwejournal.org/?p=10577
Download article (pdf) Citation Manager Publish History
Introduction
The larger the cities of our country and their populations get, the more important the issue of environmental pollution becomes. Thus, sewage, which is one of the main causes of environmental pollution, needs to be collected and removed from cities, purified, and returned to the water cycle in the nature.
Sewage treatment plants and sewer pipes are mostly made of concrete. Biogenic sulfuric acid corrosion of concrete as a result of the waste present in sewers poses a problem to the sewer pipes. In fact, following from the corrosion process, the firm structure of the concrete pipes is seriously weakened, which leads to spending huge costs on early replacement of the corroded pipes. The chief cause of the corrosion is M.I.C.C, which is a process whereby sulfuric acid is produced in sewer systems from the reaction between hydrogen sulfide (H2S) gas and Thiobacillus bacteria.1
The genus Thiobacillus is the major cause of M.I.C.C in sewer pipes.1 The produced acid by these bacteria piles up on upper levels of the flow line actually attacking the pipes crown. Consequently, some parts of collection interceptors along with all pumping stations are subject to complete destruction due to the corrosion-induced failure in concrete structures. Although the process of concrete corrosion takes place gradually, it sometimes leaves misleading effects.
In the worst cases, concrete decomposition occurs a few millimeters per year. Biogenic sulfuric acid corrosion has been studied since 1945.1 Great efforts have been made to study corrosion ever since.2-3 The bacterial and chemical activity in sewer pipes can create the sulfur cycle, resulting in the production of sulfuric acid. Under the anaerobic conditions caused by long residence time or slow transportation of the sewage, sulfate-reducing bacteria, like Desulfovibrio, reduce sulfur compounds to H2S, which is then emitted to the sewer atmosphere as a result of turbulent flow and decreased PH. After the available H2S in sewer atmosphere has been absorbed by concrete pipes or the accumulated biofilm on upper levels of the flow line, it is converted to sulfuric acid under aerobic conditions. H2S may react with the oxygen deposited on the interior surface of the sewer pipes to form elemental sulfur. Sulfur is an essential nutrient for many species of bacteria from the genus Thiobacillus, including Thiobacillus thiooxidans, Thiobacillus neapolitanus, and Thiobacillus intermeddius.4-5 These bacteria change sulfur to sulfuric acid, which leads to concrete decomposition. The produced sulfuric acid reacts with the calcium hydroxide in concrete to form gypsum, which in turn reacts with hydrated tricalcium aluminate to form ettringite. Both of the newly formed products need more volume compared to the reactants, leading to the concrete cracking. Finally, the decomposed components are washed away by the wastewater flow, accelerating the corrosion process.6-7
Considering the fact that Iran is a developing country and all of its large cities need to benefit from domestic wastewater collection systems, this study could prove to be a response to this need in that it is efficient in the reduction of maintenance, replacement, and repair costs in the long term.
Materials and Methods
The Partially Destructive Twist-off Method
This method was invented and introduced by Mahmood Naderi in 2005 and is regarded as one of the proper methods for determining in-situ compressive strength of concrete, thanks to easy implementation, no need for special expertise, high speed of performing the test, and sufficient accuracy.
This test can be easily performed horizontally, vertically, and generally on any plane surface without the need to prior planning. Required tools for this test are very simple and accessible.
Required Tools
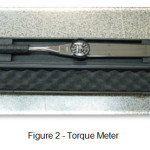
As shown in Figure 1, an aluminum or steel cylinder is one of the tools required for this method. A diameter of 40 mm and a 25-millimeter height are optimal dimensions of the cylinder, according to conducted studies. The Torque meter is illustrated in Figure 2. And another test tools, epoxy resin is a two-episode torsional resistance should be greater torsional strength concrete.
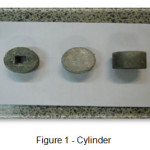 |
Fig. 1: Cylinder Click here to View figure |
 |
|
Experimental Works
First, 13 concrete types of different compressive strength grades were prepared. Then, 3 cubic samples of 15*15*15 cm dimensions were provided from each strength grade. The samples were stored under standard conditions. Since type II cement had been used to prepare concrete mixes, the following tests were performed on each group of the samples after 42 days.
Two of the three samples were used to perform standard compression test, and their compressive strength was determined.
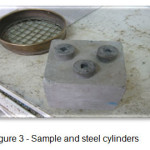
One of the three samples underwent torsion test. To this end, after grinding and cleaning the surface of the concrete, aluminum cylinders with a diameter of 40 mm and a height of 25mm (Figure 3) were glued to the concrete in three parts by means of an epoxy resin. After 24 hours, a torque was constantly applied to the cylinder at a constant speed by a torque meter until the underlying concrete broke, and the corresponding torque was read. Fractures in the samples formed after twisting are shown in Figure 4.
 |
|
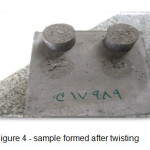 |
Fig. 4: sample formed after twisting Click here to View figure |
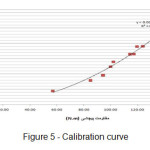
This test is based on the principle saying the amount of torque that is required to be applied to a metal cylinder so that the cylinder, together with the concrete surface layer, may dissociate, is associated with the concrete compressive strength. Hence, the following equation indicates the relationship between concrete compressive strength and torsional strength:
Fc = a. Tb ..................(1)
where FC represents concrete compressive strength in mega Pascal (MPa), T denotes torsional strength in newton meter (NM), and a and b are empirical coefficients which depend upon the type of concrete. In this study, FC and T values were found to be 0.0243 and 2.0053, respectively, with a correlation coefficient (R2) of 0.9798; the resulting calibration curve is as follows.
 |
|
Results
Having done the experiments discussed later in the following section in detail, the following preliminary results are drawn;
Admixture-free Concrete
In aeration basin number 1 (neutral environment): The concrete strength has decreased by 2%.
In the space above sewer pipe number 1 (acidic environment): The concrete strength has decreased by 13%.
In the space above sewer pipe number 2 (acidic environment): The concrete strength has decreased by 17%.
Concrete with Air-entraining Admixtures
In aeration basin number 1 (neutral environment): The concrete strength has increased by 2.3%.
In the space above sewer pipe number 1 (acidic environment): The concrete strength has decreased by 9%.
In the space above sewer pipe number 2 (acidic environment): The concrete strength has decreased by 13%
Concrete with Super plasticizers and Air-entraining Agents
In aeration basin number 1 (neutral environment): The concrete strength has increased by 3%.
In the space above sewer pipe number 1 (acidic environment): The concrete strength has decreased by 5%.
In the space above sewer pipe number 2 (acidic environment): The concrete strength has decreased by 8%.
Concrete with 10% Micrisilica Replacement in Cement
In aeration basin number 1 (neutral environment): The concrete strength has increased by 6.5%.
In the space above sewer pipe number 1 (acidic environment): The concrete strength has decreased by 1.5%.
In the space above sewer pipe number 2 (acidic environment): The concrete strength has decreased by 4%.
Concrete with 20% Microsilica Replacement in Cement
In aeration basin number 1 (neutral environment): The concrete strength has increased by 5%.
In the space above sewer pipe number 1 (acidic environment): The concrete strength has decreased by 5.2%.
In the space above sewer pipe number 2 (acidic environment): The concrete strength has decreased by 5.5%.
Microsilica, as a cement replacement material, fills the pores in concrete, resulting in the decreased permeability and corrosion of the concrete. Therefore, concrete shows more resistance to acid attacks. In these experiments, however, as the replacement level of microsilica was increased by 20% (per weight of cement), just the opposite turned out to be true. Following investigations, it was found that although cement replacement by 20% microsilica contributes to the filling of the pores in concrete ― which is considered as an advantage, it causes unwanted compounds to be formed out of Na2O and K2O present in cement, which is a drawback. (The reaction of microsilica with Na2O and K2O in cement and formation of byproducts which have less volume and strength than the primary compounds lead to the increased corrosion rates of test samples in addition to the samples cracking.) Thus, disadvantages of replacing cement by 20% microsilica outweigh its advantages, making the concrete samples with 20% micrisilica exposed to more corrosion than the samples containing 10% micrisilica.
In total, the following findings are obtained as the results of this study:
- There is a direct relationship between the rate of PH decline in acidic environments and the rate at which permeability and strength of the samples decrease.
- Strengths of almost all of the samples placed in neutral environments have increased, which can be attributed to the natural process of concrete strength gain through ageing by immersion method.
- In contrast to admixture-free samples, those with microsilica, superplasticizers, and air-entraining agents have shown increased strengths, with the sample containing 10% microsilica exhibiting the highest increase in concrete strength.
- Concrete strength has decreased for the whole samples in acidic environment number 1, with the sample containing 10% microsilica demonstrating the smallest rate.
- Concrete strength has also decreased for the whole samples in acidic environment number 2, but with a greater rate compared to acidic environment number 1.
- In response to PH changes in acidic environments, the concrete containing 20% microsilica has shown the slightest changes in terms of strength loss.
- According to the results of these experiments, it is concluded that the concrete containing 10% microsilica has shown the slightest permeability, with the slightest strength loss in acidic environments.
Discussion
Laboratory Program
Since this study introduces a laboratory method and aims to investigate the effect of wastewater on concretes without admixtures and those with admixtures (air-entraining, superplasticizers, and microsilica), it is essential that a sufficient number of samples be prepared for testing. Number of the samples is determined according to the sites and admixtures involved. Then, these samples are placed in different parts of sewage treatment plant and sewer pipes for a specific period of time. Different parameters such as environmental PH have been measured during the experiment. Further information on different stages of the experiment and how to prepare the samples will be given later. Treatment plant-involved experiments (biological treatment) are done in Malayer.
Concrete Mix Design
Efforts were made to use actual concrete mix designs for preparing the samples, which were supposed to be placed in test environments. To this end, the same materials and admixtures have been used for preparing the samples as those used to build the sewage treatment plant in Hamedan.
Thus, type II cement produced by Hegmataneh Cement Co. in Hamedan and admixtures such as air-entraining agents, super plasticizers, and microsilica (replacing cement 10% and 20% by mass) were used. The concrete mix design is shown in Table 1.
Table1: The concrete mix design used for preparing the samples.
|
Sample's name |
Sand |
Pea gravel |
Coarse gravel |
Cement |
Water |
micro-silica |
plasticizers |
Micro air |
|
|
SBO1&SBT1& SPO1&SPT1 |
639 |
590 |
408 |
444 |
195 |
0.44 |
- |
- |
- |
|
SBO2&SBT2 & SPO2&SPT2 |
723 |
354 |
530 |
424 |
186 |
0.44 |
- |
- |
100CC Micro air |
|
SBO3 &SBT & SPO3&SPT3 |
862 |
231 |
757 |
375 |
150 |
0.4 |
- |
1400 cc G51 |
- |
|
SBO4&SBT4 & SPO4&SPT4 |
795 |
359 |
498 |
360 |
148 |
0.37 |
36 |
800 cc G51 |
- |
|
SBO5&SBT5 & SPO5&SPT5 |
795 |
359 |
498 |
310 |
160 |
0.43 |
62 |
700 cc G51 |
- |
Sample Preparation
After determining concrete mix design and preparing a cm mold as well as type II cement, preparation of 15 samples got started. Then, the samples were transferred to a tub, which had been filled with tap water, and were kept there at 22ËšC for 42 days.
Placing the Samples in Wastewater Treatment Plant
15 samples were tested in the sewage treatment plant:
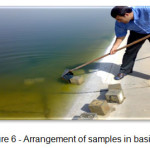
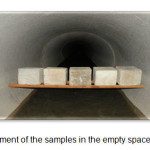
As illustrated in Figure 5, five samples were placed in the aeration basin (number 1). Five samples were placed in the empty space above sewer pipe number 1 with a PH of 5-6, and the last five samples were located in the empty space above sewer pipe number 2 with a PH of 4-5. Arrangement of the last 10 samples can be seen in Figure 6.
 |
|
 |
|
PH Measurement
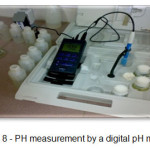
In order to carefully control and evaluate the PH of test sites, wastewater samples were taken several times, with the PH measured each time by a digital PH meter. Figure 7 demonstrates PH measurement by a digital PH meter.
 |
|
Testing of the Samples
The samples were removed out of the testing environment every 45 days, dried, cleaned (by removing algae), and prepared for torsion test. This process was repeated three times, that is each sample remained in the testing environment for a total period of 135 days.
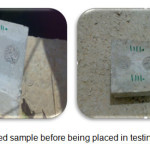
Testing of the samples involved the samples undergoing torsion test before being placed in testing environments (Figure 8). To this end, surfaces of the samples were smoothed by grinding; metal cores were attached to two parts of one face of the cubes by means of an epoxy. After almost 24 hours, samples were held by a vise and then, using a torque meter, a torque was applied to the cores; the amounts of twisting were read while the cores along with the concrete surface layer were separating from the underlying concrete. Then, the samples were located in testing environments. Torsional strengths of other faces, as well as the same face, of the samples were measured and recorded every 45 days. Figure 9 shows a tested sample after being placed in testing environment. The torsional strengths were changed/ converted to compressive strengths by the obtained regression curve in order for evaluation and comparison.
 |
|
References
- Javaher, D. Microbial corrosion (Behruzan, 1999).
- translated by Faymely, H. Properties of Concrete (Jihad, Iran University of Science and Technology, 1989).
- Attiogbe, E.K. and Rizhalla, S. H. Response of concrete to sulfuric acid attack, ACI J, 85(6), 481-488(1988).
- Barton, L. and Tomei, F. Characteristics and activities of sulfate reducing bacteria (Plenum, 2003).
- Leonard, B. and Troy, N. Wastewater System Design and Evaluation. Proceedings ofthe 4 th materials Engineering Conference, November 10-14,Washington D.C. (1996).
- Cao, H. T. Bucea, L. Ray, A. and Yozghatlian, S. The effect of cement composition and PH of environment on sulfate resistance of Portland cements and blended cements. cem concr compos,19(2),161-171 (2002).
- Cho, K. S. and Mori, T. A newly isolated fungus participates in the corrosion of concreter sewer pipes. Water science and technology, 31(7), 263-271(2003)


