Study of Physico-Chemical and Biological Characteristics of the Water of River Ganga at Patna, India
Kumari Satya1
and Chandravir Narayan2
*

1
Department of Zoology,
Patna University,
Patna,
Pin 800005
India
2
Department of Environmental Science,
Gautam Buddha University,
Greater Noida, Gautam Budh Nagar,
Pin 201312
Uttar Pradesh
India
http://dx.doi.org/10.12944/CWE.13.3.10
Copy the following to cite this article:
Satya K, Narayan C. Study of Physico-Chemical and Biological Characteristics of The Water of River Ganga at Patna, India. Curr World Environ 2018;13(3). DOI:http://dx.doi.org/10.12944/CWE.13.3.10
Copy the following to cite this URL:
Satya K, Narayan C. Study of Physico-Chemical and Biological Characteristics of The Water of River Ganga at Patna, India. Curr World Environ 2018;13(3). Available from: https://bit.ly/2Q68sAJ
Download article (pdf)
Citation Manager
Publish History

Introduction
River is a structure comprising the major route and the tributaries, the flow of which carrying an important load of substance in dissolved and particulate phases as of both natural and anthropogenic sources. The river Ganga is a holy and historic river of India. The river has the largest basin among the rivers covering 26.3% of the entire geographical region of Indian sub-continent. The river Ganga covers 475 km area in Bihar; Patna city is situated on the bank of the Ganga. The Gange calls at the join of Devprayag the Bhagirathi and Alaknanda rivers where the Bhagirathi flows at the bottom of Gangotri Glacier, at Gaumukh. It has total length of 2,525 km. The river rises in the western Himalaya and flows south and east from end to end the Gangetic Plain of North India and terminates in to the Bay of Bengal through Bangladesh. The river is the longest one of India and is the second greatest river in the world by water discharge.1 Its exciting, socio-cultural, spiritual, and historical repression with Indian culture has given the river Ganga its distinctiveness.
Rivers play an important function in incorporation or transportation of municipal and manufacturing waste water effluent discharge that constitute invariable polluting sources, where surface runoff is a regular phenomena.2 Pollution of river is a global problem because these days in view of increasing population, urbanisation and industrialisation, the rivers and the streams are often being treated as detriment disposal site. Ganga has been reported to turn into a foul-smelling stream extremely polluted with raw sewage, industrial effluents and wastes, or else agricultural runoffs.3 River Ganga carries the maximum silt load of comparatively any river in the world and the deposition of this substance in the delta area consequences in the biggest river delta inside the world 400 km from north to south and 320 km as of east to west.4
This study carried out in the month of May to June, 2014 to the physico-chemical and biological distinctiveness of water quality of river Ganga at Patna at two different sites.
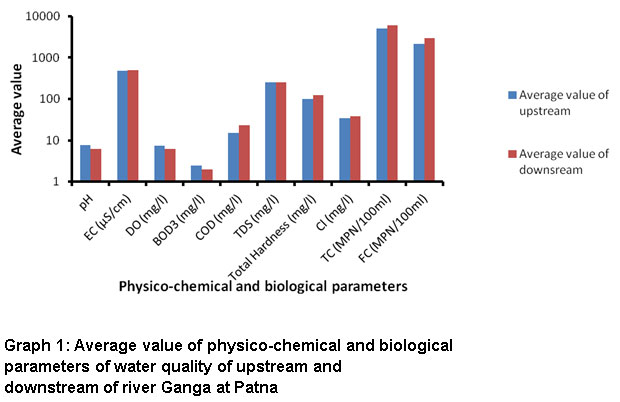 |
Graph 1: Average value of physico-chemical and biological parameters of water quality of upstream and downstream of river Ganga at Patna. Click here to view graph |
Materials and Methods
Study Area
The present study was completed after selecting two sampling sites along the right bank of river Ganga, viz., Digha Ghat (upstream; latitude 25º39'04.15'' N and longitude 85º06'28.49'' E) and Gai Ghat (downstream; latitude 25º36'43.00'' N and longitude 85º12'35.71'' E), during May to June, 2014.
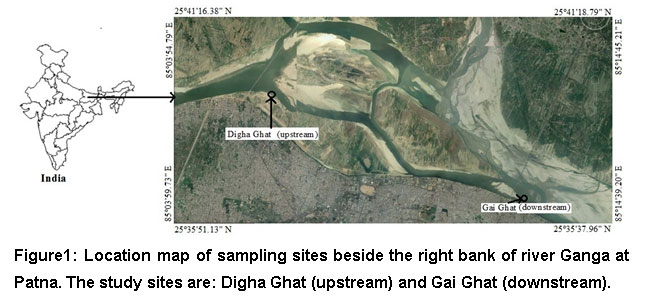 |
Figure1: Location map of sampling sites beside the right bank of river Ganga at Patna. The study sites are: Digha Ghat (upstream) and Gai Ghat (downstream). |
The altitude of the study area ranges from 44.2 to 50.3 meters asl. Patna district had the total population 5,838,465 and population density 1,823 people per km2 recorded.5 Patna town is the capital of Bihar and situated lying on the south bank of the river Ganga. A feature of the geography of Patna is its convergence of rivers of Ganga and Gandak at downstream. Uniqueness of Patna is having four large rivers in its surrounding area and also it is the prime riverine city in the world. Patna has a humid sub-tropical climate. Temperature ranges from 47ºC uppermost in summer to 1ºC lowly in winter, and annual rainfall is recorded approximately 1100 mm. Weather conditions are characterize by hot and dry summer starting March to June and cold winter starting November to February where as the humidity is high starting July to September with average annual humidity approximately 72%.
Collection of Water Samples
The sub-surface water samples of the river Ganga were collected as of two sampling sites referred above during same day and carried to the laboratory for analysis. Water samples were stored and preserved without delay inside acid-cleaned polypropylene bottles during frozen condition using transportable ice box to reduce the biogeochemical alterations as per standard procedure.6 Water samples were collected at the interval of seven days during May to June, 2014 and kept in refrigerator at 4oC in the laboratory for experiment.
Water Analysis Process
The study was undertaken at two sampling sites: Digha Ghat (upstream) and Gai Ghat (downstream) along an 18 km stretch of river Ganga. Following the Standard method (APHA 1995) water samples were collected for analyzing pH, electrical conductivity (EC), total hardness (TH), total dissolved solids (TDS), chloride (Cl), dissolved oxygen (DO), biochemical oxygen demand (BOD), chemical oxygen demand (COD), faecal coliform (FC) and total coliform (TC) bacteria. Some variables (pH, DO and EC) were analyzed at the sampling station just after sampling and other parameters were analyzed in the laboratory of Bihar State Pollution Control Board, Patna. There were used standard methods. Water samples were bringing to the laboratory inside the ice boxes. Total DO was analyzed by using water analyzer electrode, total hardness through EDTA titrimetric method, BOD3 was analyzed by the titration methods, COD through dichromate reflux method, chloride by argentometric method by Potassium chromate as indicator, and total coliform and faecal coliform by MPN method.
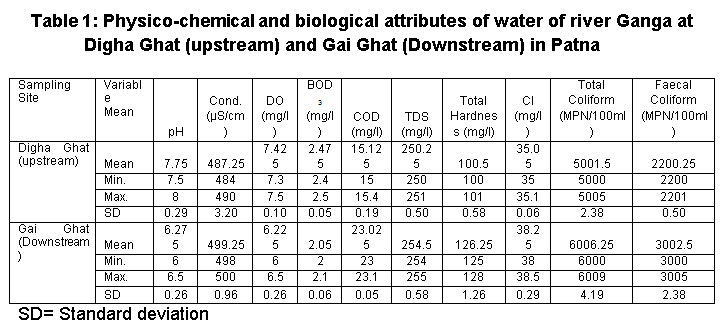 |
Table 1: Physico-chemical and biological attributes of water of river Ganga at Digha Ghat (upstream) and Gai Ghat (Downstream) in Patna. Click here to view table |
Results
Physico-chemical and biological characteristics of the river water samples at the study sites are shown in Table 1. The majority of the chemical and biochemical reactions were influenced with the pH. The pH value was maximum (7.75) at upstream and minimum (6.28) at downstream. The value of EC was maximum (499.25 μS/cm) and minimum (487.2 μS/cm) at downstream and upstream, respectively. The DO values were observed maximum and minimum 7.42 and 6.22 mg/l at upstream and downstream sampling sites respectively. It has been used as determine of the quantity of organic materialism a water solution which supports the growth of microorganism.7 The values of BOD were observed maximum and minimum 2.48 and 2.0 mg/l at upstream and downstream sites, respectively. COD decides the quantity of oxygen requisite for chemical oxidation of organic matter with a strong chemical oxidant like potassium dichromate beneath reflux conditions.8 The COD mean value varies from 23 mg/l to 15.12 mg/l at the study sites.
Total dissolved solid (TDS) depend on different factors, such as, geological nature of quantity of surface runoff, rainfall and watershed, and gives an sign of the degree of liquefied substances.9 The mean values of total solids were observed maximum (254.5 mg/l) and minimum (250 mg/l) at downstream and upstream, respectively. Hardness of water may due to natural accretion of salts from get in touch with soil and geological formations or it might enter from direct pollution through industrial discharge. The value of total hardness ranged from 126.2 mg/l to 100.5 mg/l at downstream and upstream respectively. Chloride is one of the most important inorganic anion inside water and waste water. The most significant source of chloride in the water is the discharge of domestic water.10 The chloride content was highest (38.25 mg/l) and lowest (35 mg/l) at downstream and upstream, respectively. The total coliform counts were observed maximum and minimum, 6006.25 and 5001.5 MPN/100 ml, respectively, at downstream and upstream. Faecal coliform is a part of the total coliform group which is of faecal origin. The faecal coliform values were maximum and minimum 3002.5 and 2150 MPN/100 ml at downstream and upstream, respectively.
Discussion
By Fakayode (2005),11 the pH of a water sample is very significant in determination of water quality given that it affects further chemical reactions, such as, easily dissolving and metal toxicity. The pH values were found to be slightly alkaline at upstream, which dropped to an acidic at downstream. The water at the sampling sites could, therefore, be considered as polluted. Conductivity is an excellent and quick method to determine the total dissolved ions and is directly related with total solids. Conductivity and total dissolved solids were found more or less similar at both the sites.
The chloride content were found maximum (38.5 mg/l) at downstream. The total hardness of the constraint of water quality used to illustrate the consequence of dissolved minerals. In the present study, it was found maximum at downstream. The auto-purifying capability of the river Ganga is derived from its curiously high capacity to maintain dissolved oxygen inherited from this environment. Lack of adequate DO leads to infected condition and increases BOD in the river.3 The DO is also an imperative limnological factor representing level of water eminence and organic pollutants in the water body.12 It was found low in downstream. The BOD was high at upstream and minimum at downstream, where the COD was maximum at downstream only. Urbanization and population sudden increase due to industrial development and infrastructure enlargement in India lead to most of the region faces to stress on water resources.13
The total coliform and faecal coliform is very important parameter to determining river water quality; these were found undesirable at downstream. It appears from the result that when the river enters to the city (upstream), it is less polluted; all the pollutants are in low concentration. While when the river leaves city (downstream), concentration of all the pollutants increases remarkably. This increment may be because of domestic and sewage discharge. Downstream the river Ganga converted black and infected, and ripples are frothy at several places, emitting methane bubbles, with floating untaken bodies of the dead, corpses of animals, partially cremated remnants of the babies and relic waste thrown to the river to attain eternal peace, floral offerings, garlands and refuse.3
Conclusion
Systematic and comprehensive analysis with incorporation of biological methods, samples to elucidate the local factors shows that impact of untreated sewage is increasing in the river Ganga. The elevated level of bacteriological population makes the surface water unsuitable for consumption which may cause depletion of dissolved oxygen in it. The major source of pollutions contributed by the heavy discharge of sewage from municipality of Patna. The surface water require treatment earlier than its consumption; suitable water treatment process such as water softening, ion exchange and demineralization may be used to decrease the concentrations of contaminants. Finally, these finding showed the importance of understanding the water characterization for effective utilization and prediction of change to minimize the effect of urbanization. It is essential to safeguard the utilization and monitoring after three months of water resources for future generations.
Acknowledgements
I express my deep sense of gratitude to the Chairman and Member Secretary, Bihar State Pollution Control Board, Patna for granting permission to carry out this study. I would like to state my gratitude and indebtedness to Dr. S.N. Jaiswal, Senior Scientist, BSPCB, Patna introducing the present topic and inspiring guidance. I am also grateful to Dr. Gopal Sharma, Scientist 'D', Zoological Survey of India, Gangetic Plains Regional Centre, Patna for assigning me this attractive project and for precious suggestions and encouragements at different stages of the work.
References
- Rai B. Pollution and Conservation of Ganga River in Modern India. International Journal of Scientific and Research Publications. 2013;3(4):1-4.
- Singh K. P., Malik A., Mohan D., Sinha S. Multivariate statistical techniques for the evaluation of spatial and temporal variations in water quality of Gomti river (India)—A case study. Water Research. 2004;38:3980-3992.
CrossRef - Das S. Cleaning of the Ganga. Journal Geological Society of India. 2011;78:124-130.
CrossRef - Sharma Y. Water Pollution Control - A Guide to the Use of Water Quality Management Principles. Edited by Richard Helmer and Ivanildo Hespanhol Published on behalf of the United Nations Environment Programme, the Water Supply and Sanitation Collaborative Council and the World Health Organization by E. and F. Spon ©. 1997.
- Census of India. Provisional Population Totals, Ministry of Home Affairs, Government of India, New Delhi. 2011.
- APHA. Standard Methods for the Examination of Water and Wastewater, 19th edn. American Public Health Association, New York. 1995.
- Sinha M. R., Dev A., Prasad A., Ghosh M., Tagore R. N. Physico-chemical examination and quality assessment of groundwater (Hand-Pump) around Patna main town, Bihar state, India. Journal of Chemical and Pharmaceutical Research. 2010;3(3):701-705.
- Namrata S. Physico-chemical properties of polluted water of river Ganga at Varanasi. International Journal of Energy and Environment. 2010;1(5):823-832.
- Singh, M. R., Gupta A., Beeteswari K. H. Physico-chemical Properties of Water Samples from Manipur River System, India. J. Appl. Sci. Environ. Manage. 2010;14(4):85-89.
- Trived P. K., Goel R. K. Chemical and Biological Methods for Water Pollution Studies. Publish by Environmental Publications, Post box 60, Karad 415 110. 1986.
- Fakayode, S.O. Impact Assessment of Industrial Effluent on Water Quality of the Receiving Alaro River in Ibadan, Nigeria. Ajeam-Ragee. 2005;10:1-13.
- Wetzel R.G., Likens G.E. Limnological analysis.3rd ed. Springer-Verlag, New York, 391. 2006.
- Kumar B., Venkatesh M., Triphati A., Anshumali. A GIS-based approach in drainage morphometric analysis of Rihand River Basin, Central India. Sustain. Water Resour. Manag. 2018;4(1):45-54.
CrossRef


