Spatial Variability in Physico-Chemical Parameters of Water in Lake Baringo Catchment, Kenya
Molly A Ochuka 1
*
 , C.O. Ikporukpo2
, G.M. Ogendi3
and Y. Mijinyawa4
, C.O. Ikporukpo2
, G.M. Ogendi3
and Y. Mijinyawa4
1
Department of Agricultural and Environmental Engineering,
Pan African University,
Life and Earth Sciences Institute, University of Ibadan,
Ibadan,
Nigeria
2
Department of Geography,
University of Ibadan,
Ibadan,
Nigeria
3
Department of Environmental Science,
Egerton University,
Njoro,
Kenya
4
Department of Agricultural and Environmental Engineering,
University of Ibadan,
Ibadan,
Nigeria
http://dx.doi.org/10.12944/CWE.14.3.12
Copy the following to cite this article:
Ochuka M, Ikporukpo C. O, Ogendi G. M, Mijinyawa J. Y. Spatial Variability in Physico-Chemical Parameters of Water in Lake Baringo Basin, Kenya. Curr World Environ 2019; 14(3).
DOI:http://dx.doi.org/10.12944/CWE.14.3.12Copy the following to cite this URL:
Ochuka M, Ikporukpo C. O, Ogendi G. M, Mijinyawa J. Y. Spatial Variability in Physico-Chemical Parameters of Water in Lake Baringo Basin, Kenya. Curr World Environ 2019; 14(3). Available from: https://bit.ly/2otCaTb
Download article (pdf) Citation Manager Publish History

Introduction
Water is a substantial abiotic factor of the ecosystem which is extensively considered as the most valuable of natural resource on the earth’s surface (Gadiga and Garandi, 2018). Lakes offer varied ecological services, including water supply and habitats for many aquatic animals and plants (Ondiba et al., 2018). Water quality indicates the suitability of water to support its purposes for domestic use, agricultural, industrial and nature preservation
(Angweya et al., 2005). It is affected by a combination of natural and anthropogenic factors (Mouri et al.,2011). Anthropogenic factors such as farming, urban settlement, deforestation and recreation, negatively impacts on the water quality in many freshwater lakes worldwide (Dennis, 2009).
The negative impacts comprise of sedimentation, water pollution, habitat destruction, decline in lake surface area and depth, and decline in aquatic life (Taylor et al., 2010).The eutrophication of East African lakes has been increased due to the sedimentation of rivers and lakes (Olago and Odada, 2007). Sedimentation reduces light penetration into water (Chaudhry and Malik, 2017). Increased sedimentation increases nutrients input into the water bodies. Excessive nutrient inputs are the main reason for lake eutrophication (Banaszuk and Wysocka, 2005). Nutrient enrichment also affects the composition and productivity of phytoplankton and other aquatic angiosperms which alter the ecosystems function and structure (Manohar et al., 2016)and decreases the resource value of rivers, lakes, and estuaries (Pathak and Pathak, 2012)
Baringo has long been recognized as an example of human misuse and mismanagement of land resources (Olago and Mavuti, 2017). The growing population in Baringo has led to exerted pressure on the land and prompted the utilization of fertilizers to meet the increased demand for food (Ontumbi et al., 2015). Lake Baringo catchment with relatively high altitude, renders it highly vulnerable to surface water and wind erosion of the loose fine soil on the land surface (Ouma and Mwamburi, 2014). This has resulted into countless ecological disruptions including decreased fish yields, siltation, deteriorating water quality, frequent algal blooms sedimentation, land use changes and uncontrolled abstractions of water which has impacted negatively on its biodiversity and increasing levels of poverty of the adjacent lake communities et al., 2003). The most significant limnological challenge is its extreme turbidity with an average secchi disc reading of 9.5 cm (Mouri et al., 2011). A previous study on the Lake Baringo basin revealed high trophic condition indicated by increasing salinity, low oxygen concentrations and high turbidity (Ouma and Mwamburi, 2014).
Poor water quality negatively impacts on the health of plants and animals. High nutrient content in water bodies causes algal bloom and the development of hypoxic or anoxic conditions thus threatening the life of fish and other aquatic species (Segor et al., 2012). Due to increased siltation, Lake Baringo’s bed is virtually devoid of invertebrate life (Aloo, 2006). As previous study revealed a high concentration of cyanotoxin exceeding WHO's upper limit of 1.0 μg l−1 for drinking water in Lake Baringo (Kotut et al., 2006).High concentrations of nitrates in drinking water is a health hazard and is thought to cause miscarriages in pregnant women and blood poisoning in young children, which can result in death (Weselak et al., 2007).
Most of the tributaries in lake Baringo catchment offload suspended soilds into the lake consequently increasing organic matter content. Rivers are a conduit through which pollutants drain into water sources from the land (Yao et al., 2009). Rivers carry elements, in suspended or in dissolved form, from their source and deposit them sequentially based on their physico-chemical nature at different locations (Raj and Azeez, 2009).
Water resources management is a fundamental need and safe water must be considered as a basic human right. Therefore there is a need to save the Lake Baringo catchment from further deterioration, to avoid the disastrous consequences of these threats and lead to a future where the full potential of Africa’s water resources can be readily unleashed as envisaged in the new Africa Water Vision for 2025. water security was acknowledged as one (Goal 6) of the seventeen sustainable development goals (SDGs) by the United Nations which aims at ensuring availability and sustainable management of water and sanitation for all by 2030 (Gain et al., 2016).
Therefore there is a great need to understand the spatial patterns of water deterioration for water resources management underpinned by the 2016 Water Act in light of aiming to achieve Kenya’s Vision 2030 ambitions.
This study therefore seeks to examine the water quality spatial patterns and to identify the major sources of contaminants. This will guide in the prioritization of the management projects based on location and source of contaminants. The results of this spatial variability analysis provide valuable information to the governments to formulate evidence-based water resource management strategies and environmental policies.
Materials and Methods
Study Area
Lake Baringo is one of the two freshwater lakes in the Rift Valley floor in Kenya. Lake Baringo is an internationally recognized important world Ramsar site. It is located in the Eastern arm of the Great Rift Valley (00°30’ N and 00°45’N, and 36°00’E and 36°10’E) and at an elevation of about 970 meters. It has a surface area of 130 km² and an altitude of about 1100 m.a.s.l. It drains a total area of 6,820 km2. The lake’s water catchment includes the Mau Hills and Tugen Hills. Perkerra and Molo are the perennial rivers that drain into the lake whereas seasonal rivers include Endau, Chemeron Ol Arabel, Makutan and Tangulbei. It has no visible outlet and it is believed to have an underground seepage at Kapedo to the north and the water flows out as geysers and hot springs into Lake Turkana. The area receives an annual rainfall that ranges from 450 from 900 mm. It is characterized by a very high annual evaporation rate that ranges from 1,650 to 2,300 mm. The short rains fall from October to November while long rains on the other had occur from April to August (Odada et al., 2006)
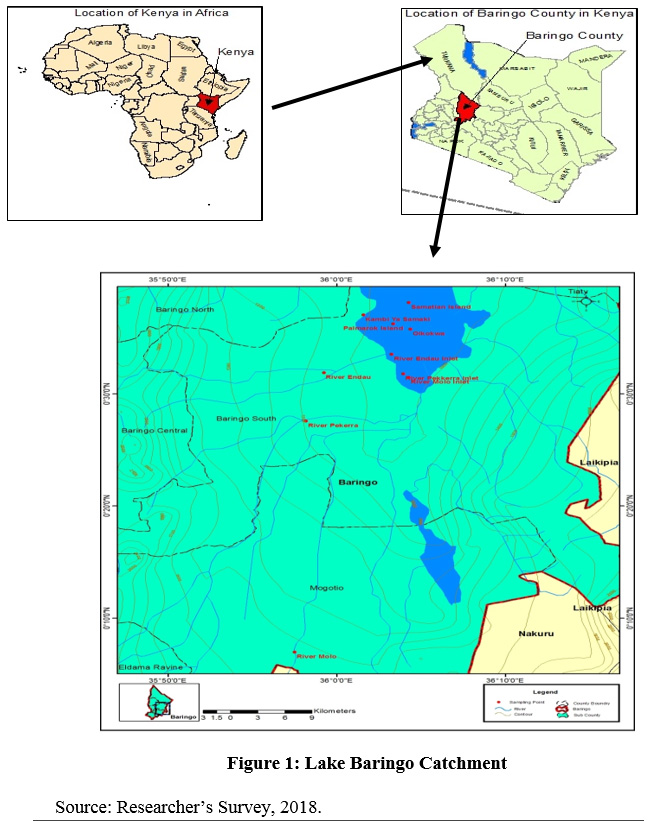 |
Figure 1: Lake Baringo Catchment.. Click here to view Figure |
Population Density
According to the population and housing census conducted in 2009, the population size of Baringo County was 555,561, consisting of 279,081 males and 276,480 females (Kenya National Bureau of Statistics, 2010) The County’s growth rate is 3.3 per cent per annum, which is above the national average of 3 per cent. (Sergon, 2018)
Socio-Economic Activity
The study area is inhabited by three major ethnic groups namely the Turgens to the east, Pokots, to the north, Ilchamus/Njemps South and eastern sides. All groups are agro-pastoralists. Pokot who inhabit the northern part of the area are heavily dependent on livestock keeping and in particular goats while the Njemps are mainly fishermen. The Turgen settled up on the humid hills with good conditions for rain fed farming and are in most cases agriculturalist. Perkerra irrigation scheme has increased horticultural production and led to the growth of Marigat town. Additionally, large scale sisal farming has led to the establishment of the sisal industry in the catchment. The community heavily relies on charcoal burning as one of the major socio-economic activity alongside bee-keeping and brewing of local liquor as an alternative source of income. A donkey abattoir in Mogotio, the Goldox Company, is one of the latest companies for large scale production of donkey meat for export to China.
Lake Baringo catchment is also an international tourist site and tourism has become one of the key economic activities in the catchment. It is a home for approximately 500 species of birds have been including parrots, bush shrikes, pelicans, and cormorants, hammer cops weaver, herons and Guinea fowls (Choge et al., 2002).In addition ,it is a home for seven species of fresh water fish, and mammals hippopotamus and reptiles (Mathea, 2009).The lake has seven major islands namely Ruko, Rongena, Linage, Samatian, Olkokwa, Parmalok and the Devil’s Island. The largest being Ol-Kokwa Island which has an extinct volcanic center and has several hot springs. Ruko Island on the other hand is a park having a variety of wildlife such as zebra and giraffe.
The lake also provides an invaluable habitat for seven fresh water fish species. Lake fishing is important to local social and economic development. Additionally the area is a habitat for many species of animals including the hippopotamus, crocodile and many other mammals, amphibians, reptiles and the invertebrate communities.
Causes and Impacts of Water Pollution
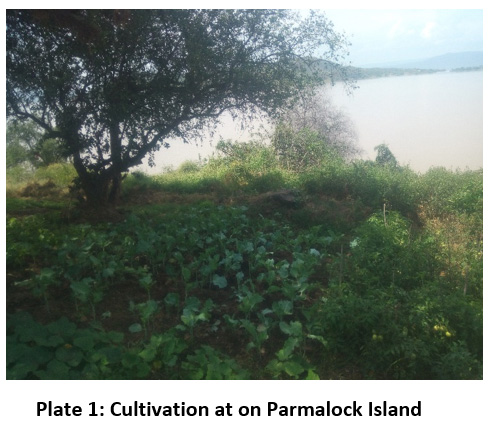 |
Plate 1: Cultivation at on Parmalock Island Click here to view Plate |
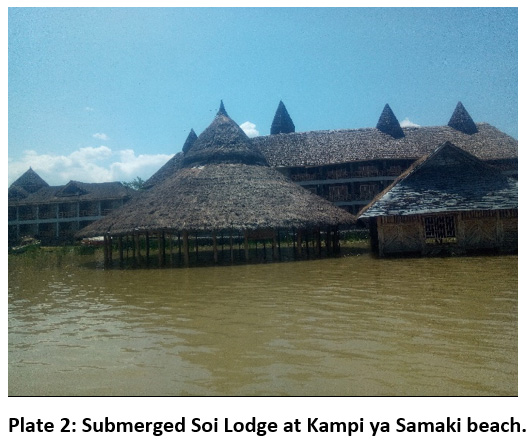 |
Plate 2: Submerged Soi Lodge at Kampi ya Samaki beach. Click here to view Plate |
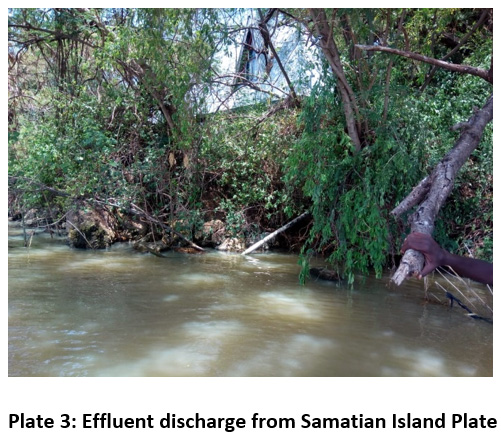 |
Plate 3: Effluent discharge from Samatian Island Plate Click here to view Plate |
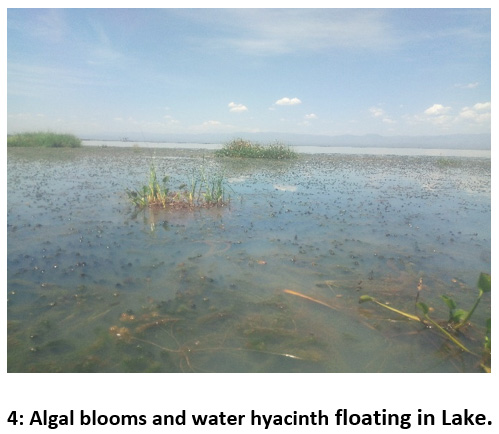 |
Plate 4: Algal blooms and water hyacinth floating in Lake. Click here to view Plate |
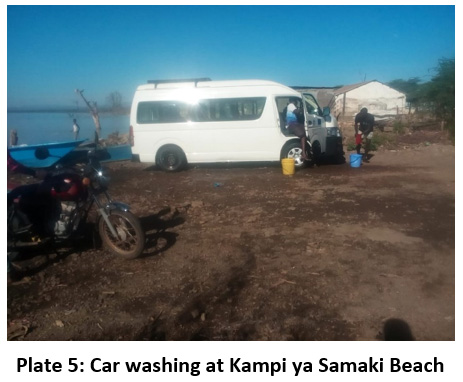 |
Plate 5: Car washing at Kampi ya Samaki Beach Click here to view Plate |
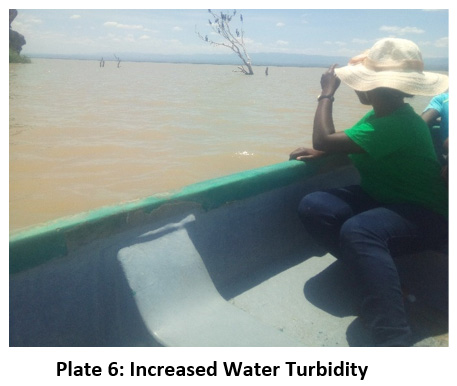 |
Plate 6: Increased Water Turbidity Click here to view Plate |
Sampling
Ten water quality sampling points were selected in areas where human activities were high. It is important to design the sampling that covers a wide range of determinants representing the water quality of the catchment (Zheng et al., 2015). The sampling sites are, River Molo inlet (Site 1), River Perkerra inlet (Site 2), River Endau Inlet (Site 3), Samatian Island (Site 4), Ol-Kokwa Island (Site 5), Parmalock Island (Site 6), Kampi ya Samaki (Site 7), River Endau (Site 8), River Perkerra (Site 9) and River Molo (Site 10). Ten samples were collected at ever sampling station. The duration of sampling were during the dry season (January), beginning of the wet season (April), mid-wet season (August) and end of the wet season (October) during the year 2018. However river Endau being a seasonal river, was sampled once in the month of August when the rains were high and not during the other sampling sessions when the river was completely dry. The sampled water quality parameters included water temperature, water pH, total dissolved solids, electrical conductivity, salinity, total nitrogen, nitrates, and nitrites, ammonia, total phosphate and orthophosphate.
Sampling Procedures
Physical parameters were measured insitu which are: temperature, electrical conductivity, salinity and total dissolve solids using a HACH multimeter, USA (Model: sension™+ EC71). The concentrations of nitrogen (TN) and total phosphorus (TP) were analyzed according to APHA 2005. Total nitrogen (TN) was analyzed with unfiltered water samples, via digestion with concentrated sulphuric acid (by autoclave procedure) to convert organic nitrogen to ammonium nitrogen (NH4-N), with subsequent analysis for TN carried out, as outlined for NH4-N. Nitrate and nitrite concentrations were measured with the cadmium reduction method and ascorbic acid method (using HACH DR2800 spectrophotometer). Ammonium was determined with the phenol hypochlorite method using nitroprusside as a catalyst. Total phosphorus was analyzed by oxidizing unfiltered water samples with hot 5% potassium per sulfate (K2S2O8) in distilled water. The tubes (samples, standards and blanks) were autoclaved for 30 min. They were further cooled to room temperatures with the tube caps slightly loosened. The TP concentration was then determined using the methods described above for inorganic phosphate. Phosphate phosphorus (PO4-P) was measured with the ascorbic acid method. Means and standard deviations (mean ± SD) of the determined physicochemical parameters were calculated using Microsoft office excel and SPSS statistical packages. The variation in physical and chemical parameters were analyzed using one Way ANOVA at a significance level of p< 0.05.
Results and Discussion
The determination of water quality was done by measuring the water temperature, pH, conductivity, total dissolved solids, salinity, total nitrogen, nitrates, nitrites, total phosphates and orthophosphates. Apart from nitrate and orthophosphate, all the physical and chemical parameters of Lake Baringo and its catchment demonstrated significant (P < 0.05) spatial variations. A summary of the mean (± standard deviation) values of the spatial distribution of the physicochemical parameters in Lake Baringo Basin is presented in Table 1.
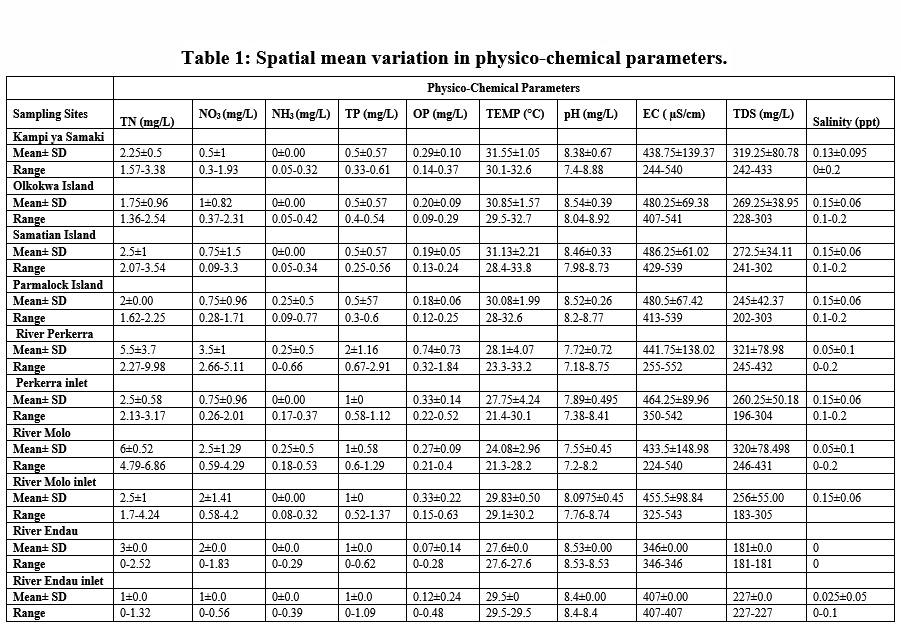 |
Table 1: Spatial mean variation in physico-chemical parameters. Click here to view Table |
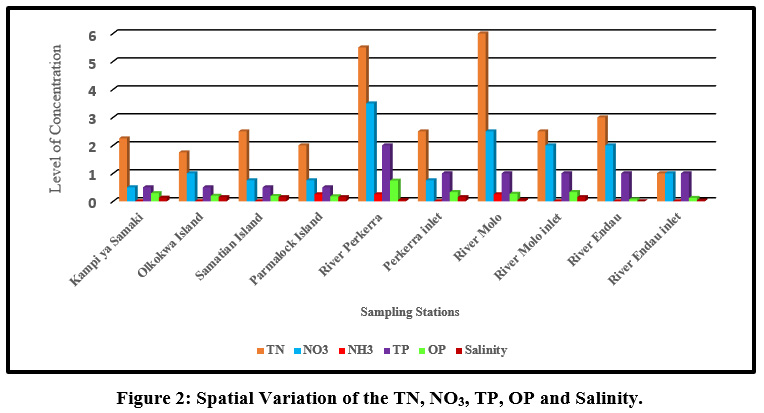 |
Figure 2: Spatial Variation of the TN, NO3, TP, OP and Salinity. Click here to view Figure |
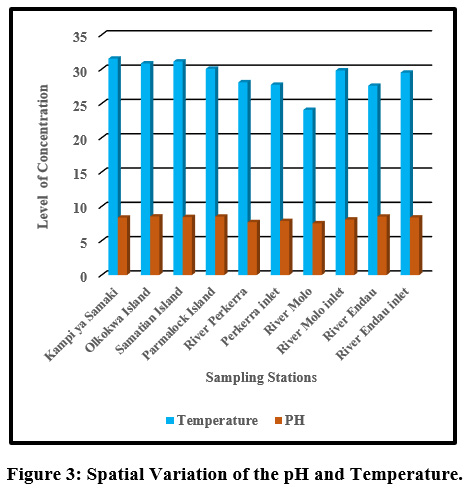 |
Figure 3: Spatial Variation of the pH and Temperature. Click here to view Figure |
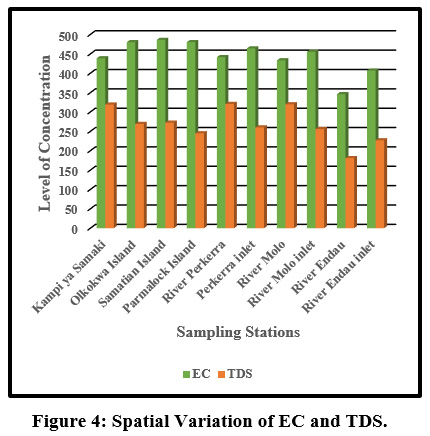 |
Figure 4: Spatial Variation of EC and TDS. Click here to view Figure |
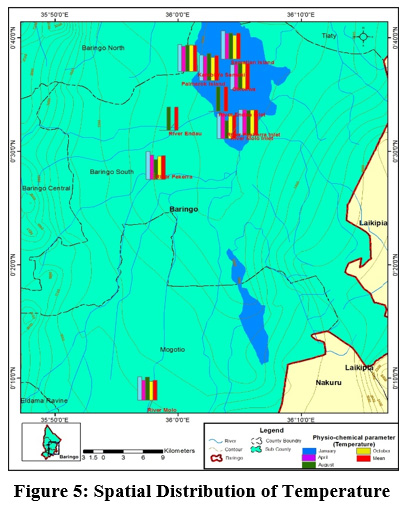 |
Figure 5: Spatial Distribution of Temperature Click here to view Figure |
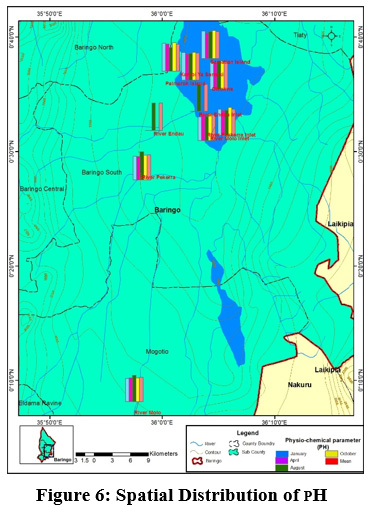 |
Figure 6: Spatial Distribution of PH Click here to view Figure |
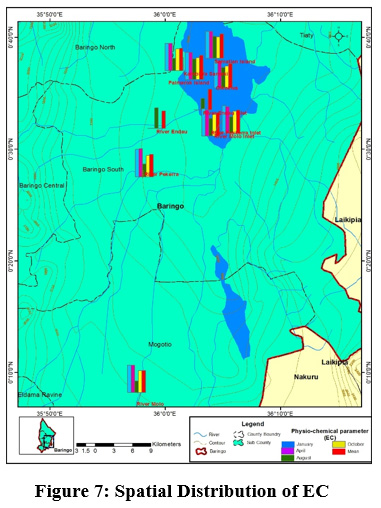 |
Figure 7: Spatial Distribution of EC Click here to view Figure |
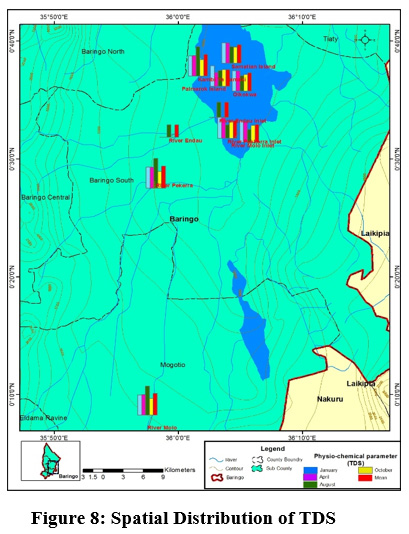 |
Figure 8: Spatial Distribution of TDS Click here to view Figure |
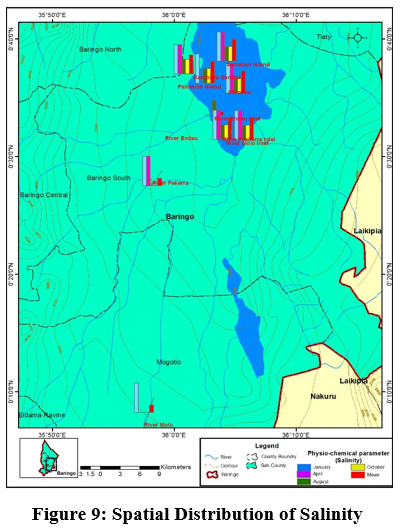 |
Figure 9: Spatial Distribution of Salinity Click here to view Figure |
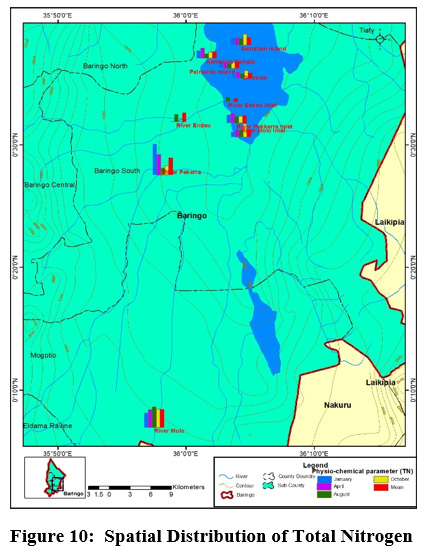 |
Figure 10: Spatial Distribution of Total Nitrogen Click here to view Figure |
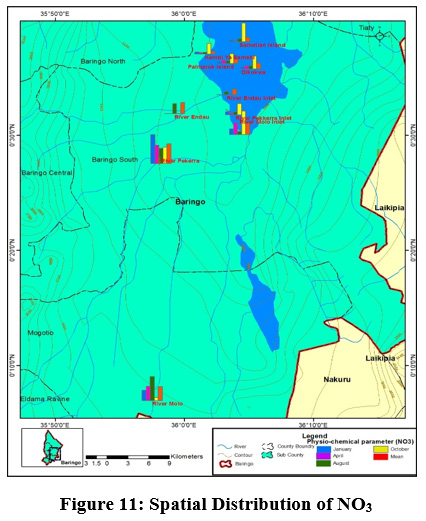 |
Figure 11: Spatial Distribution of NO3 Click here to view Figure |
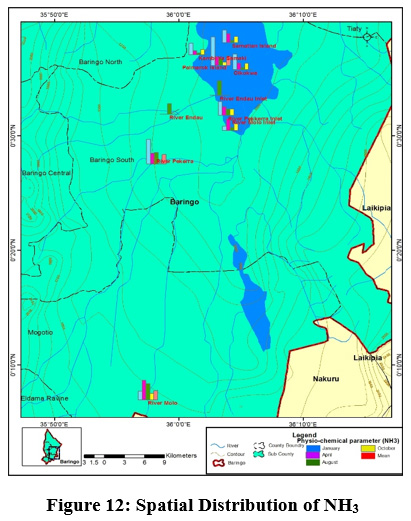 |
Figure 12: Spatial Distribution of NH3 Click here to view Figure |
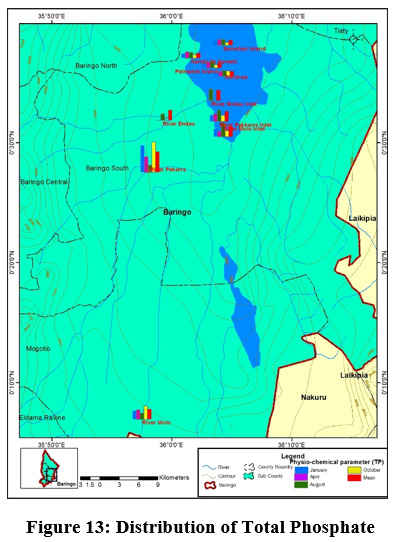 |
Figure 13: Distribution of Total Phosphate Click here to view Figure |
 |
Figure 14: Distribution of Orthophosphate Click here to view Figure |
The mean temperature value ranged from (24.08±2.96°C) to (31.55±1.05 °C) at river Molo and Kampi ya Samaki, respectively Figure 3. The temperature variation of water in this study can be associated to intense solar radiation considering the fact that the catchment is in a semi-arid region of Kenya. In addition other climatic factors such as rainfall could also influence the variations in temperature. The average water temperature were within the required standards of (25°C –32 °C) by the World Health Organization. However, the water temperature recorded at Samatian Island exceeded the required limits. The low water temperatures in river Molo is attributed to high altitude and forest cover which is consistent with the findings of Kibichii (2007) who observed that tree canopy cover protects river water from solar radiation hence ameliorating the water temperatures. The high-water temperatures could be attributed to waste water discharges from the tourist lodges on the Island Figure.5. Previous studies on the same Lake reported high temperature (Omondi, et al., 2011). Water temperature variations results from thermal discharges, agricultural run offs, river regulation, industrial effluents, domestic discharge and global warming (Dallas, 2017). The blooming of alga usually arises at temperature range of 23°C and 28°C (Yang et al., 2008) and cyanobacteria blooms only when temperature exceeded 21°C in Lake St George, Ontario (Christian and Hartmann, 1988). Temperature outside of the optimum range may affect the life cycle of aquatic life (Dallas, 2017). According to Ouma and Mwamburi, (2014) higher temperature contributed to chlorophyll-a concentration in Lake Baringo. Similar results were recorded across Lake Anchar, Khushalsar Lake Dal Lake in China (Olmstead et al., 2013).
Generally, the Lake and its tributaries portrayed high pH levels. The mean pH value ranged from between (7.55±0.45) to (8.54±0.39) at river Molo and Olkokwa Island, respectively Figure 3. High pH values recorded in River Endau inlet, River Perkerra inlet, and River Molo inlet, may be attributed to fertilizers from the nearby horticultural and sisal farms, and irrigation schemes Figure 6. At Ol-Kokwa Island and Samatian Island, the high pH could be attributed to lack of any surface outlet and high concentrations of carbonate salts, typically sodium carbonate. The low pH in river Molo could be attributed to discharges from Mogotio town, car washing and decomposition of organic matter from wastewater can lead to acidification as displayed in plate 5.The pH range of 6.5–8.0 is conducive for the flourishing of different aquatic organisms (Sreenivasulu et al., 2014).When the pH goes beyond this range, aquatic diversity may decrease as a result of physiological stresses (Boman et al., 2008).
Electrical conductivity mean values ranged between (433.5±148.98 µS/cm) to (486.25±61.02 µS/cm), at River Molo and Samatian Island, respectively Figure 4. The electrical conductivity values were slightly below the WHO limits of 600 µS/cm for natural water. This could be attributed to domestic effluent discharges into the Lake from the Samatian Island tourist lodges. Agricultural surface runoffs increased the concentration of the ions Figure 7. In addition, the streams within Lake Baringo catchment run through clay loam soils which relatively have a high conductivity (Ochuka et al., 2019). anthropogenic activities such as utilization of agro-chemicals, waste disposal, and agricultural activated have been linked to higher EC River Nairobi, Nyando Catchment and Khushalsar Lake recorded (Mbui et al., 2017;Basin and Raburu , 1998; Many et al., 1994).
The mean values for TDS ranged between (245±42.37mg/L) to (321±78.98 mg/L) at Parmalock Island and River Perkerra, respectively Figure 8. The TDS values were within the acceptable National Environmental Management Authority (NEMA, Kenya) limits of 1200 mg/L and WHO permissible limit 1,000 mg/L. High TDS values in the catchment can be attributed to surface runoffs, weathering of rocks, agricultural runoff, discharge of domestic waste discharge and animals watering. This conforms to the recent studies conducted earlier within the same lake (Ndiba et al., 2018). Siltation has affected the quality of lake Baringo water with approximately 400 tonnes of silt deposited into the lake during every rainy season turning the appearance of the lake muddy and brown in appearance (Josephine, 2014). High concentration of TDS is a clear reflection of harmful contaminates for instance contaminants industrial and agricultural effluents (Benham et al., 2011). Suspended solids in Lake Baringo has been attributed to the reduced water transparency in the Lake. Compared to turbid lakes, clear lakes are characterized by high diversity of plants and animals (Ndungu, 2014). Higher concentration of TDS yields noxiousness through heightened salinity and modification in the ionic composition (Manoj and Padhy, 2015).High TDS affects water taste, odour, colour and hardness. Palatability of water with TDS less than 600 mg/L is considered suitable (WHO, 2011.) However, extremely low TDS reduces the taste of drinking water.
Mean concentration of salinity ranged from (0.05±0.1 ppt) at river Molo and the highest values (0.15±0.06 ppt) were obtained on the islands and at the river inlets. TN mean concentrations ranged from TN (1.75±0.96mg/l) to (6±0.52mg/l) at Olkokwa Island and river Molo, respectively Figure 9. The concentration of salinity can be attributed to the discharge of industrial effluents and Sewage discharge. Begum and Harikrishna (2008) reported high concentration of salinity in Cauvery River streams due to inefficient treatment of industrial effluents. High salinity alters the biodiversity structure affecting the organisms at specific stages of growth and development (Weber-Scannell and Duffy,2007).
High TN in river Molo and Perkerra could be attributed to the runoffs from farms and Perkerra irrigation scheme and the surrounding flower farms. Figure 10.A similar result showed that rose flower greenhouses situated near Chepsit River contributes to run offs into streams in Lake Baringo catchment. Rivers are the main pathways for lake water pollution as the streams offload into the lake. The mean TN concentrations decreased from the river as it flows into the lake. For instance the TN concentration of river Molo decreased from (6±0.52mg/l) to (2.5±1mg/l) as it enters the lake and river Perkerra TN total mean concentration decreased from (5.5±3.7mg/l) to (2.5±0.58mg/l) as it enters the lake. This is consistent with a study in Dongting Lake Allinson et al., (2000). High concentration of total nitrogen load in lake Chivero resulted from the buildup of organic material and increased bacterial activity (Rommens et al., 2003).
High TN concentration detected along the rivers and low values on the islands and inlets. Nutrient enhancement intensifies the biological processes resulting to sudden fluctuations in the structure and composition of aquatic food webs (Smith et al., 2006). A similar observation was made in Danish Lakes (Søndergaard et al., 2009).Mean nitrate concentration value ranged from (0.5±1mg/L) to (3.5±1mg/L) at Kampi ya samaki and river Perkerra, respectively Figure 11. High nitrate detected in river Perkerra can be attributed to the use of fertilizers Perkerra irrigation scheme which get leached and eroded to streams. Additionally, it could also arise due to oxidation of ammonia to nitrites and then to nitrates by bacteria during the nitrogen cycle. Livestock drop their waste into the river water as they are being watered causing contamination through increased nutrients loads leading to foul odours. High nitrate concentration in Lake Baringo could also result from internal nutrient loading .Lake Baringo being a shallow lake, it experiences frequent distribution of sediments by wind-wave releasing nutrients into the water. (Boqiang et al., 2006) argues that internal nutrient loading is common phenomenon in shallow lakes than in deep lakes.Recent studies in Lake Baringo reflected the presence of algae at river Molo inlet due to rich inflow of nutrients into the lake from the catchment areas (Ndiba et al., 2018). Algal bloom is an extreme response of Lake Ecosystem to the eutrophication. The presence of nitrate originate from the contamination by surface runoff from riverine agricultural irrigated horticultural farms (Maghanga et al., 2013; Barrado and Deba, 1998). However, the concentration of nitrates on the islands were relatively low. Concentrations decreased from the river inflows to the central area. The nitrate levels for all the sites sampled were within WHO and KEBS (Kenya Bureau Standards) water quality standards for nitrates (10mg/L). In this study, concentration of nitrate was higher than phosphate. This is inconsistent compared to a study in Nwaja creek surface water which recorded a higher phosphate concentration than nitrate (Adeola et al., 2015).
The study areas depicted very low ammonia concentration with some sampling points recording values below the detectable limits. The mean value ranged from (0±0.00mg/L) to (0.25±0.5mg/L). Mean value of (0.25±0.5mg/L) was recorded in river Perkerra, river Molo and Parma lock Island Figure 12. The rest of the sampling exhibited mean values below the detectable limits. The presence of ammonia recorded at the three sites can be likely due to inputs of decomposing animal dung during animal watering and waste water discharges. According to Varol et al., (2011), high values of ammonia results from waste water discharges. Presence of ammonia indicates pollution from organic wastes such as fertilizer run offs, sewage waste and fertilizer.(Varol et al., 2011).
River Perkerra displayed the highest mean concentrations of phosphates (2±1.16mg/L) while the lowest mean values (0.5±0.57mg/L) were recorded at Kampi ya Samaki beach, Olkokwa Island and Samatian Island. Phosphate values ranged between (0.5±0.57mg/L) to (2±1.16mg/L) Figure 13. The highest values of phosphate were obtained in river Perkerra. Higher phosphates levels arise from household wastes, industrial waste. The residents around the lake bath directly in the Lake and even wash clothes right inside the lake. Apart from that the car washing process uses soap which are drained into the streams contributing to phosphate increase. Phosphates can also be naturally generated from, weathering of rocks releasing phosphate minerals. Danha et al., ( 2014) reported high concentrations of Phosphates released from wash bay effluents at Charter Estates discharge point that resulted in rampant algal and weed growth The concentration of phosphate in the study area was within the WHO recommended limit of 5mg/L for natural water. Regardless of the presence of nitrogen, Phosphorus still remains a is the key determinant of phytoplankton development (Wang and Wang, 2009). Orthophosphate had the highest mean concentration (0.5±1mg/L) recorded in river Perkerra followed by (0.25±0.5mg/L) for river Molo inlet and river Perkerra inlet Figure 14. The other sampling stations recorded mean values below the detectable limits. Mean concentration of OP ranged from (0.18±0.06mg/L) to (0.74±0.73mg/L) at Parmalock Island and river Perkerra, respectively.
Conclusion and Recommendations
The spatial variations in water quality parameters in this study points out the vulnerability of the Lake Baringo catchment to pollution from anthropogenic factors such as irrigation schemes at Perkerra, large scale sisal plantations in Mogotio, intensive pastoralism activities in the northern part of the catchment, charcoal burning, poor management of abattoir, waste dumping, industrial activities and urban development. These factors are interwoven for instance de-afforestation for charcoal burning loosens the soil structure making it vulnerable to soil erosion. Due to surface runoffs, the pollutants are drained into the water bodies consequently leading to eutrophication and flooding. We therefore have the following recommendation for the relevant stakeholders.
- The Government of Kenya should enforce legislation against cultivation on the riparian land to help reduce soil erosion and siltation of the rivers and Lake Baringo.
- The County Government of Baringo should introduce alternative sources of income to reduce dependency on charcoal burning as a major source of livelihood. This will reduce soil erosion and sedimentation.
- Ministry of Livestock and Fisheries (MoALF) and Ministry of Agriculture, should advocate for sustainable Agricultural practices to protect quality of water in the catchment.
- County government of Baringo, WRMA and NEMA and the, should penalize managers of tourist lodges directly discharging effluent into Lake Baringo and relocate the donkey abattoir.
- Eldama Ravine Water and Sanitation Company should ensure that Municipal effluents treated before discharge into water bodies.
Acknowledgment
We acknowledge Nakuru Water and Sanitation Services Company (NAWASSCO) Laboratory for analyzing the parameters. Thanks also are due to those who reviewed this manuscript.
Funding
This research was supported by research grants from the African Union Commission through flagship institution Pan African University (PAU).
Conflict of Interest
The authors do not have any conflict of interest.
References
- Adeola Alex Adesuyi, Valerie Chinedu Nnodu, Kelechi Longinus Njoku, Anuoluwapo, J. (2015). Nitrate and Phosphate Pollution in Surface Water of Nwaja Creek, Port Harcourt, Niger Delta, Nigeria. International Journal of Geology, Agriculture and Environmental Sciences, 5(11), 13–20.
- Allinson, G., Coates, M., Cordell, S., Modelling, E., and Victoria, P. (2000). Strategies for the Sustainable Management of Industrial Wastewater. Determination of the Chemical Dynamics of a Cascade Series of Five Newly Constructed Ponds. Phys. Chem. Earth 25(7), 629–634.
CrossRef - Aloo, P. A. (2006). Effects of Climate and Human Activities on the Ecosystem of Lake Baringo, Kenya. Kluwer Academic Publishers, 335-347.
CrossRef - Angweya, R., Okungu, J., Abuodha, J. O. Z., and Hecky, R. E. (2005). Environmental impacts of water quality change on beneficial uses of Lake Victoria.
- Banaszuk, P., and Wysocka-Czubaszek, A. (2005). Phosphorus dynamics and fluxes in a lowland river: The Narew Anastomosing River System, NE Poland. Ecological Engineering, 25(4), 429–441.
CrossRef - Barrado, E., and Deba, L. (1998). Assessment of Seasonal And Polluting Effects on The Quality of River Water by Exploratory. 32(12).
CrossRef - Boman, B. J., Wilson, P. C., and Ontermaa, E. A. (2008). Understanding Water Quality Parameters for Citrus Irrigation and Drainage Systems 1. Irrigation and Drainage Systems, 1–12.
- Boqiang, Q. I. N., Liuyan, Y., Feizhou, C., Guangwei, Z. H. U., Lu, Z., and Yiyu, C. (2006). Mechanism and control of lake eutrophication. 51(19), 2401–2412.
CrossRef - Chaudhry, F., and Malik, M. (2017). Factors Affecting Water Pollution: A Review. Journal of Ecosystem and Ecography, 07(01), 6–8.
CrossRef - Steinberg, C. E., & Hartmann, H. M. (1988). Planktonic bloomâ€forming Cyanobacteria and the eutrophication of lakes and rivers. Freshwater Biology, 20(2), 279-287.
CrossRef - Dallas, H. F. (2009). The effect of water temperature on aquatic organisms: a review of knowledge and methods for assessing biotic responses to temperature. Water Research Commission Report KV, 213(09).
- Danha, C., Utete, B., Soropa, G., and Rufasha, S. B. (2014). Potential Impact of Wash Bay Effluent on the Water Quality of a Subtropical River. Journal of Water Resource and Protection, 06(11), 1045–1050.
CrossRef - Trolle, D. (2009). The influence of sediment nutrient dynamics on the response of lake ecosystems to restoration and climate change (Doctoral dissertation, The University of Waikato).
- Edition, F. (2011). Guidelines for drinking-water quality. WHO chronicle, 38(4), 104-8.
- Gadiga, B. L., and Garandi, I. D. (2018). “ The Spacio-Temporal Changes of Kiri Dam and Its Implications ” In Adamawa State , Nigeria . International Journal of Scientific and Research Publications 8(8), 469–477.
CrossRef - Wada, Y., Gain, A. K., and Giupponi, C. (2016). Measuring global water security towards sustainable development goals. Environmental Research Letters, 11(12), 2-13.
CrossRef - Johnson, B. A. M. W. C., and Wetzel, R. G. (1994). Nutrient additions by waterfowl to lakes and reservoirs : predicting their effects on productivity and water quality . Hydrobiologia 279/280: 121-132
CrossRef - Josephine, K. (2014). Implications of climate change on the management of Rift Valley lakes in Kenya . The case of lake Baringo Implications of climate change on the management of Rift Valley lakes in Kenya . The case of lake Baringo . (June), 133–138.
- Kibichii, S., Shivoga, W. A., Muchiri, M., and Miller, S. N. (2007). Macroinvertebrate assemblages along a land-use gradient in the upper River Njoro watershed of Lake Nakuru drainage basin, Kenya. Lakes and Reservoirs: Research and Management, 12(2), 107–117.
CrossRef - Kotut, K., Ballot, A., and Krienitz, L. (2006). Toxic cyanobacteria and their toxins in standing waters of Kenya: Implications for water resource use. Journal of Water and Health, 4(2), 233–245.
CrossRef - Maghanga, J. K., Kituyi, J. L., Kisinyo, P. O., and Ng’Etich, W. K. (2013). Impact of nitrogen fertilizer applications on surface water nitrate levels within a Kenyan tea plantation. Journal of Chemistry, 2013.
CrossRef - Manoj, K., and Padhy, P. K. (2015). Discourse and review of environmental quality of river bodies in India: an appraisal of physico-chemical and biological parameters as indicators of water quality. Current World Environment, 10(2), 537.
CrossRef - Mathea, C. . (2009). Our Lakes, Our Future. 13th World Lake Conference, (November), 17.
- Mbui, D., Chebet, E., Kamau, G., and Kibet, J. (2017). The state of water quality in Nairobi River, Kenya. Asian Journal of Research in Chemistry, 9(11), 579.
CrossRef - Mouri, G., Takizawa, S., and Oki, T. (2011). Spatial and temporal variation in nutrient parameters in stream water in a rural-urban catchment , Shikoku , Japan : Effects of land cover and human impact. Journal of Environmental Management, 92(7), 1837–1848.
CrossRef - Ndiba, R., Omondi, R., Nyakeya, K., Abwao, J., and Oyoo-okoth, Eo. (2018). Environmental constraints on macrophyte distribution and diversity in a tropical endorheic freshwater lake. 6(3), 251–259.
- Ndungu, J. N. (2014). Assessing water quality in Lake Naivasha.
- Ochuka, M. A., Ikporukpo, C. O., Ogendi, G. M., and Mijinyawa, Y. (2019). Temporal Variations in Nutrients Loading in Lake Baringo Basin , Kenya. Journal of Earth Sciences & Environmental Studies. 4(4) ,668–680.
- Odada, E. O., Onyando, J. O., and Obudho, P. A. (2006). Lake Baringo: Addressing threatened biodiversity and livelihoods. Lakes & Reservoirs: Research & Management, 11(4), 287-299.
CrossRef - Odhiambo, W., and Gichuki, J. (2011). Seasonal dynamics of the phytoplankton community in relation to environment in Lake Baringo, Kenya (impact on the Lake’s resource management). African Journal of Tropical Hydrobiology and Fisheries, 9(1).
CrossRef - Olago, D. O., and Mavuti, K. (2017). The diversity and ecology of the east african lakes, with a case study of lakes baringo, nakuru and victoria-nyanza. (March), 1–24.
- Olago, D. O., and Odada, E. O. (2007). Sediment impacts in Africa ’ s transboundary lake / river basins : Case study of the East African Great Lakes. 10(1), 23–
CrossRef - Olmstead, S. M., Muehlenbachs, L. A., Shih, J. S., Chu, Z., and Krupnick, A. J. (2013). Shale gas development impacts on surface water quality in Pennsylvania. Proceedings of the National Academy of Sciences, 110(13), 4962-4967.
CrossRef - Omondi, R., Yasindi, W. A., and Magana, A. (2011). Spatial and Temporal Variations of Zooplankton in Relation to Some Environmental Factors in Lake Baringo, Kenya. Egerton Journal of Science and Technology, 11(2011), 29–50.
- Ondiba, R., Omondi, R., Nyakeya, K., Abwao, J., and Oyoo-okoth, E. (2018). Environmental constraints on macrophyte distribution and diversity in a tropical endorheic freshwater lake. International Journal of Fisheries and Aquatic Studies, 6(3), 251–259.
- Ontumbi, G., Obando, J., and Ondieki, C. (2015). The Influence of Agricultural Activities on the Water Quality of the River Sosiani in Uasin Gishu County, Kenya. International Journal of Research in Agricultural Sciences, 2(1Online), 2348–3997.
- Otiang, G. E., Oswe, I. A., Otiang, G. E., and Oswe, I. A. (2010). he case of Lake Human impact on lake ecosystems : the case of Lake Naivasha , Kenya. African Journal of Aquatic Science Human impact on lake ecosystems : t (April 2015), 37–41.
- Ouma, H., & Mwamburi, J. (2014). Spatial variations in nutrients and other physicochemical variables in the topographically closed Lake Baringo freshwater basin (Kenya). Lakes and Reservoirs: Research and Management, 19(1), 11-23.
CrossRef - Pathak, H., and Pathak, D. (2012). Eutrophication: Impact of Excess Nutrient Status in Lake Water Ecosystem. Journal of Environmental and Analytical Toxicology, 02(05), 1–5.
CrossRef - Raburu P. O. and Okeyo-Owuor J.B. (1998). Impact of agro-industrial activities on the water quality of River Nyando, Lake. 307–314.
- Raj, N., and Azeez, P. A. (2009). Spatial and temporal variation in surface water chemistry of a tropical river, the river Bharathapuzha, India. Current Science, 96(2), 245–251.
- Brendonck, L., Maes, J., Rommens, W., Dekeza, N., Nhiwatiwa, T., Barson, M., ... & Stevens, M. (2003). The impact of water hyacinth (Eichhornia crassipes) in a eutrophic subtropical impoundment (Lake Chivero, Zimbabwe). II. Species diversity. Archiv für Hydrobiologie, 158(3), 389-405
CrossRef - Segor, K.F,Chebii, J.F, Kituyi, L.J, Kiptoo and Maghanga. J.(2010). Nutrient Pollutant Loads and Their Effects on Water Quality of Perkerra River, Baringo County, Kenya. East African Journal of Pure and Applied Science 1 (2): 74-85.
- Sergon, D. (2018). Republic Of Kenya Baringo County Government County Integrated Development Plan.
- Smith, V. H., Joye, S. B., & Howarth, R. W. (2006). Eutrophication of freshwater and marine ecosystems. Limnology and Oceanography, 51(1part2), 351-355.
CrossRef - Jeppesen, E., Kronvang, B., Meerhoff, M., Søndergaard, M., Hansen, K. M., Andersen, H. E and Olesen, J. E. (2009). Climate change effects on runoff, catchment phosphorus loading and lake ecological state, and potential adaptations. Journal of Environmental Quality, 38(5), 1930-1941.
CrossRef - Sreenivasulu, K., Hossain, K., and Damodharam, T. (2014). Seasonal variations in water quality and major threats to Nellore Cheruvu (tank), Nellore district, India. International Journal of Environment, 3(2), 28–35.
CrossRef - Varol, M., Gökot, B., Bekleyen, A., and Åžen, B. (2012). Water quality assessment and apportionment of pollution sources of Tigris River (Turkey) using multivariate statistical techniques—a case study. River research and applications, 28(9), 1428-1438.
CrossRef - Wang, H., and Wang, H. (2009). Mitigation of lake eutrophication : Loosen nitrogen control and focus on phosphorus abatement. Progress in Natural Science, 19(10), 1445–1451.
CrossRef - Weselak, M., Arbuckle, T. E., Wigle, D. T., & Krewski, D. (2007). In utero pesticide exposure and childhood morbidity. Environmental Research, 103(1), 79-86.
CrossRef - Yang, X., Wu, X., Hao, H., and He, Z. (2008). Mechanisms and assessment of water eutrophication . 9(705824), 197–209.
CrossRef - Yao, Q. Z., Yu, Z. G., Chen, H. T., Liu, P. X., and Mi, T. Z. (2009). Phosphorus transport and speciation in the Changjiang (Yangtze River) system. Applied Geochemistry, 24(11), 2186–2194.
CrossRef


